Electronic structure of transition metal dichalcogenides PdTe2 and Cu0.05PdTe2 superconductors obtained by angle-resolved photoemission spectroscopy

Electronic structure of transition metal dichalcogenides PdTe2 and Cu0.05PdTe2 superconductors obtained by angle-resolved photoemission spectroscopy |
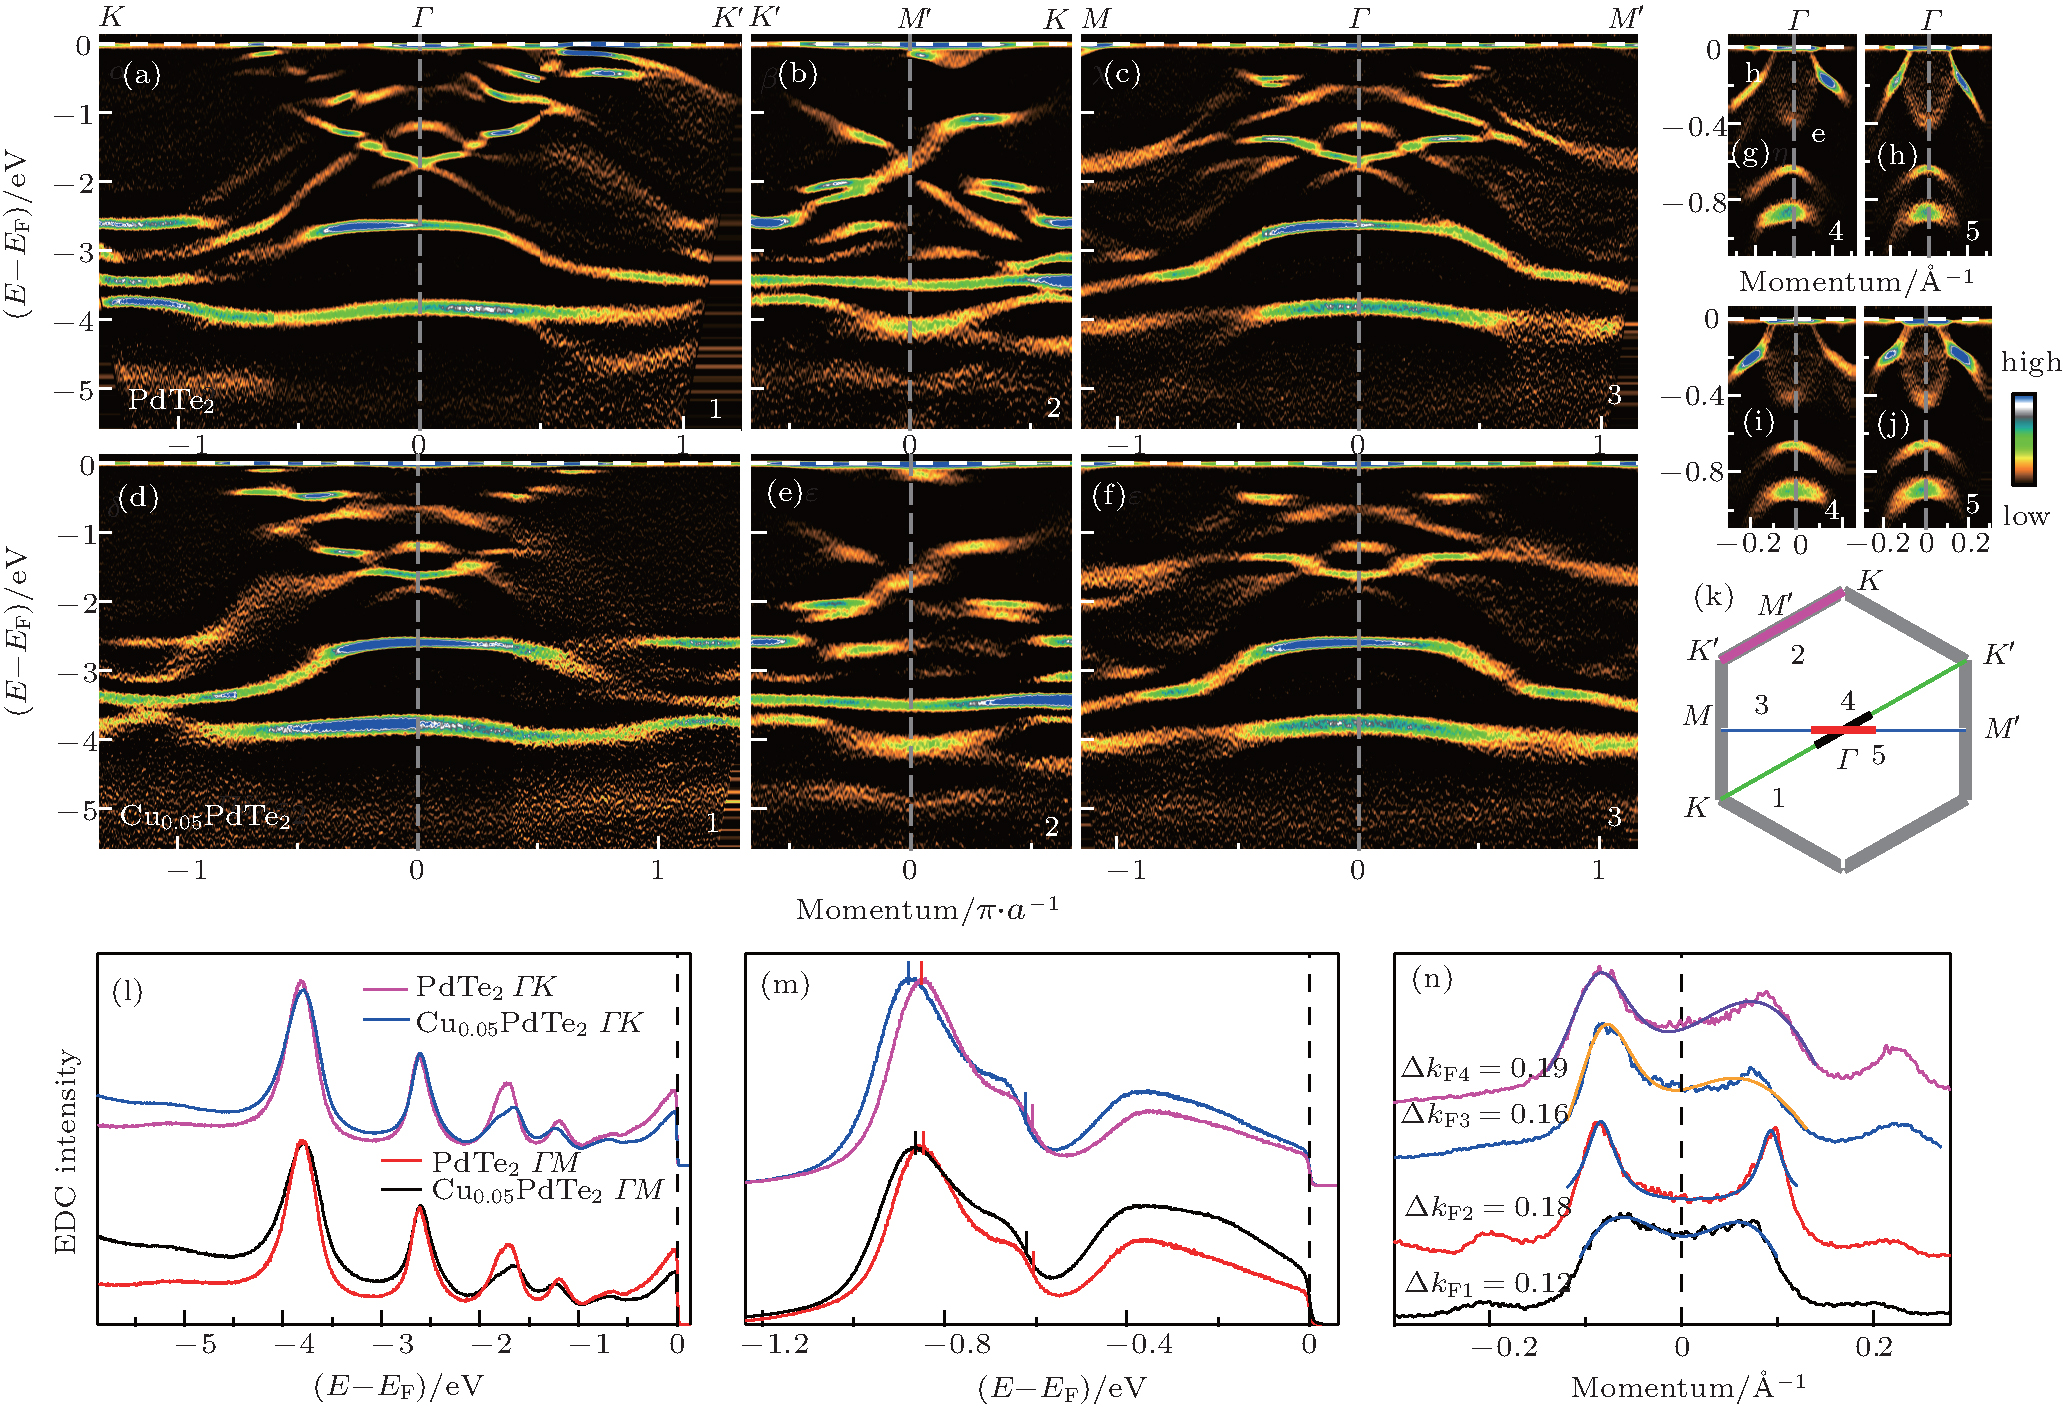
| Band structure comparison between PdTe2 and Cu0.05PdTe2 by using hellium I (21.218 eV) and laser (6.994 eV) as the photon source. (a)–(c) Band structures of PdTe2 measured by He I along three high symmetry cuts 1–3. (d)–(f) Band structures of Cu0.05PdTe2 along three high symmetry cuts 1–3. (g) and (h) Band structure of PdTe2 measured by laser along two high symmetry cuts 4 and 5. (i) and (j) Band structure of Cu0.05PdTe2 measured along two high symmetry cuts 4 and 5. The locations of the five momentum cuts 1–5 are shown in panel (k). To highlight the measured bands, all the images shown here are the second-derivative images of the original data with respect to the energy. Panel (l) shows the energy distribution curves (EDCs) of Cu0.05PdTe2 and PdTe2 at the Γ point in panels (a)–(c) and (f) from the helium I measurements. Panel (m) shows the extracted EDCs of Cu0.05PdTe2 and PdTe2 at the Γ point in panels (g)–(j) from the laser-ARPES measurement. The vertical bars indicate the peak position in EDCs. Panel (n) shows the momentum distribution curves (MDCs) at the Fermi level of panels (g)–(j). The fitted MDC lines are put on top of the measured data and the obtained Fermi momentum difference is marked. |
 |