Metal–organic–vapor phase epitaxy of InGaN quantum dots and their applications in light-emitting diodes

Metal–organic–vapor phase epitaxy of InGaN quantum dots and their applications in light-emitting diodes |
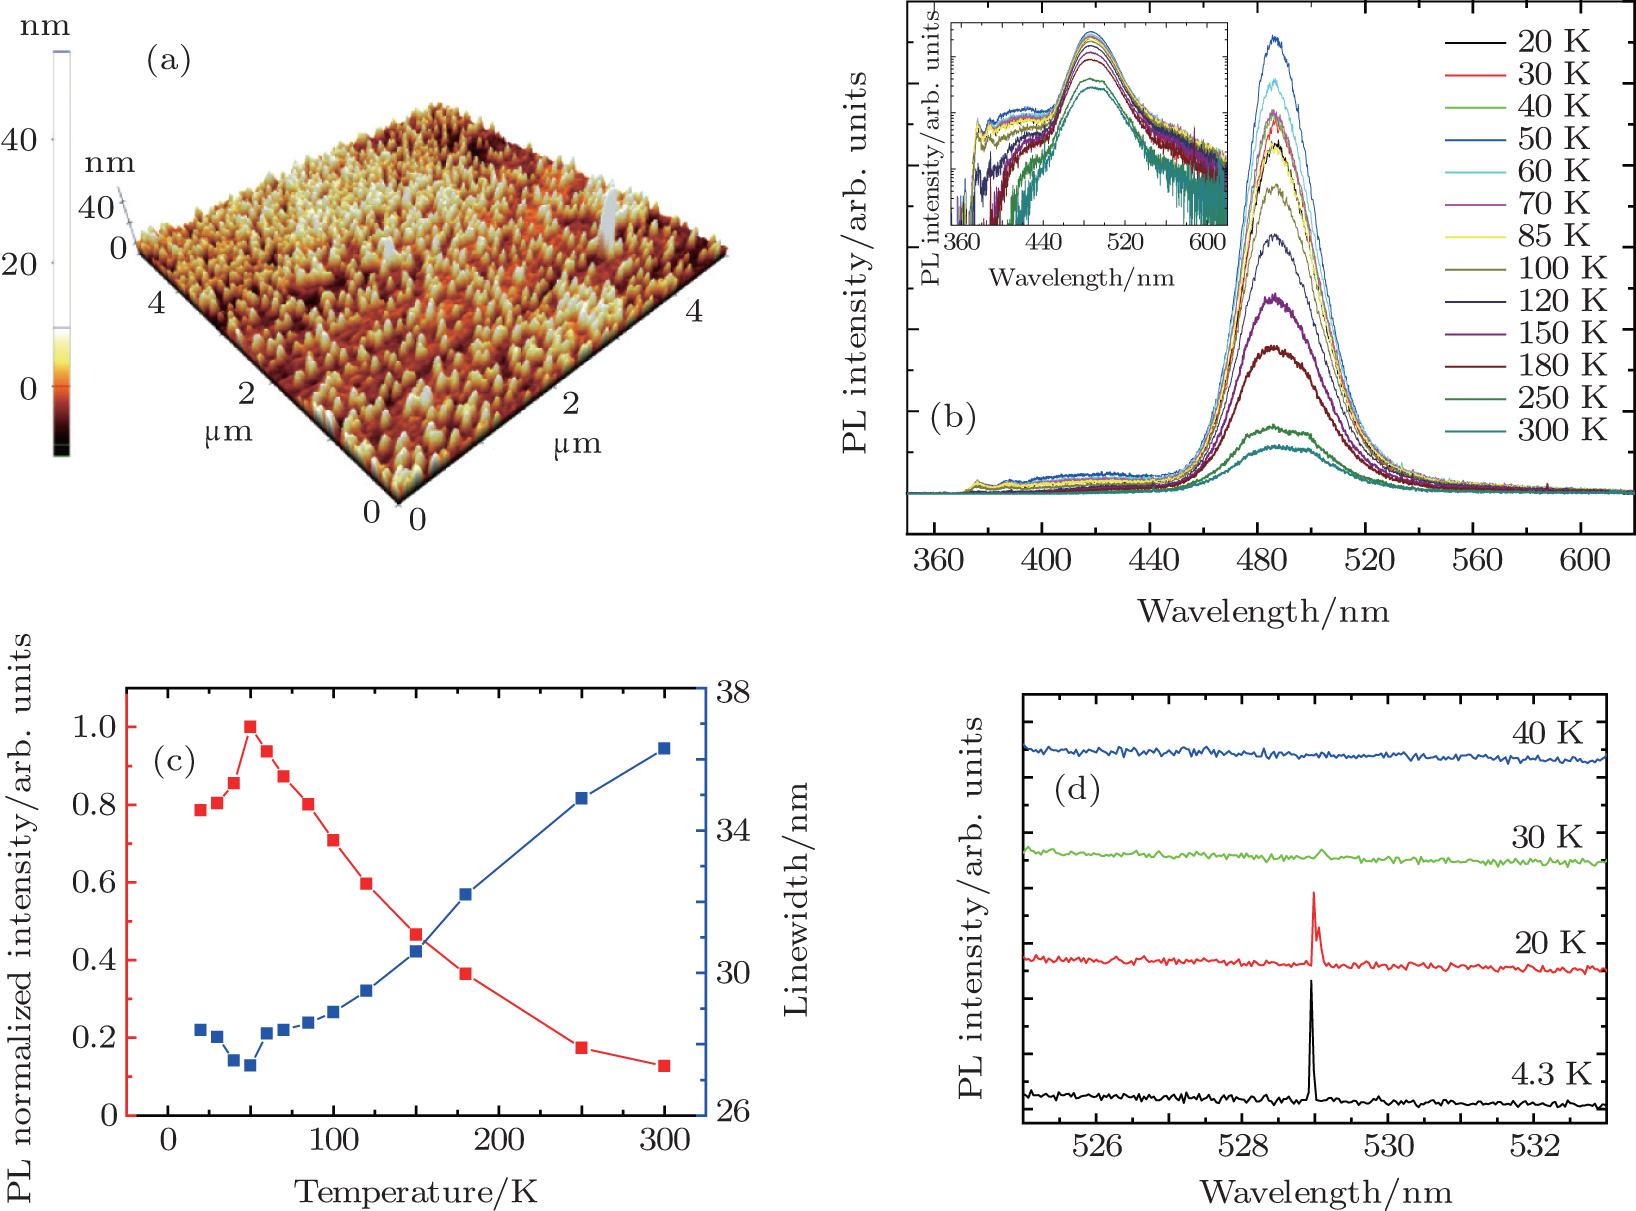
| AFM image and optical spectra of InGaN QDs: (a) AFM image of InGaN; (b) temperature-dependent PL spectra, the inset in panel (b) is a plot of logarithmic vertical axis scale; (c) normalized intensity and FWHM under different temperatures; (d) micro-PL spectra of a single QD at low temperature. Reprinted from Ref. [ 30 ]. Copyright 2012, with permission from Wiley. |
 |