

Band structures of elastic waves in two-dimensional eight-fold solid–solid quasi-periodic phononic crystals*
[Chen A-Li† , Tong-Li Liang, Wang Yue-Sheng]
, Tong-Li Liang, Wang Yue-Sheng]
|
|


†Corresponding author. E-mail: alchen@bjtu.edu.cn
*Project supported by the National Natural Science Foundation of China (Grant Nos. 11272043 and 10902012) and the Project-sponsored by SRF for ROCS, SEM.
Combined with the supercell method, band structures of the anti-plane and in-plane modes of two-dimensional (2D) eight-fold solid–solid quasi-periodic phononic crystals (QPNCs) are calculated by using the finite element method. The influences of the supercell on the band structure and the wave localization phenomenon are discussed based on the modal distributions. The reason for the appearance of unphysical bands is analyzed. The influence of the incidence angle on the transmission spectrum is also discussed.
Only the two-, three-, four-, and six-fold symmetries are allowed in the traditional crystallography in which the five-fold symmetry is forbidden. In 1984 this situation was broken by Shechtman et al., [1] who found experimentally that for the rapidly solidified A1– Mn alloys a new phase appeared with its electron diffraction patterns displaying icosahedral symmetry, including the crystallographically unallowed five-fold symmetry. The concept of the quasicrystal, as the abbreviation of quasi-periodic crystal, was presented by Shechtman et al. at the same time. In the same year, Levine and Steinhardt[2] confirmed the existence of the quasicrystal by analytically computing the diffraction pattern of an ideal quasicrystal which showed the five-fold symmetry. Ranganathan and Chattopadhyay[3] reviewed the studies on the quasicrystal and focused on electron diffraction and microscopic studies. Lifshitz[4] discussed the symmetry of quasicrystals. Steurer and Haibach[5] studied the periodic average structures (PASs) of particular quasicrystals. Steurer[6] presented a review paper focusing on structure researches on quasicrystals. Li and Chai[7] were concerned with the longitudinal shear elasticity of three-dimensional (3D) icosahedral quasicrystals. Li and Xie[8] determined the solution of a strip with a semi-infinite crack embedded in decagonal quasicrystals. Li[9] studied the octagonal quasicrystal with an elliptic hole.
The most important property of the quasicrystal is short-range disorder but long-range order. The loss of the translation invariance means that the Bloch theory cannot be used any longer. However, the waves are not localized modes strictly because of the long-range order. So both the propagating and localized modes exist when waves propagate in a quasi-periodic phononic crystal, which will lead to more wave phenomena. Not only in real crystals, but also in metamaterials like photonic or phononic crystals (PTCs or PNCs), the studies on this fascinating type of order have continued. Steurer and Sutter-Widmer[10] reviewed the peculiarities of quasiperiodic order for the photonic and phononic quasicrystals (QPTCs and QPNCs) in which the mechanisms for band gap formation were covered. Lai and Zhang[11] enhanced the phononic gap of two-dimensional (2D) periodic or quasiperiodic PNCs by using air inclusions. Zhang[12] investigated the focus behaviors of acoustic waves through 2D 8-, 10-, and 12-fold QPNCs by using exact multi-scattering numerical simulation. Sutter-Widmer et al.[13] studied the transmission behaviors of 2D QPNCs with different rotational symmetries in comparison to those of their periodic average structures. The prediction of the band gaps governed by Bragg scattering[14] and resonance mechanisms[15] in different systems were also discussed. There are also many researches on waves propagating in the 1D QPNCs.[16– 20] The above researches show that the band gaps will split in the quasi systems and there are more abundant localized modes than those in periodic systems. These properties are useful for designing the acoustic or elastic wave filters. However, the above studies mostly used the transmission spectrum to discuss the band gaps of the QPNCs, especially for 2D systems. Chen et al.[21] have discussed the band structures of the eight-fold solid– liquid QPNCs experimentally and theoretically. In the present paper, we will study the dispersion curves and mode distributions for the eight-fold solid– solid QPNCs in order to have a better understanding of their physical meanings. In this paper the dispersion curves of the 2D eight-fold solid– solid QPNCs will be studied and calculated directly by the finite element method combined with the supercell method. For waves propagating in the solid– solid system, both the anti-plane and the in-plane modes exist. The transverse and longitudinal waves will be coupled for the in-plane mode, which is different from the anti-plane mode for which there is only the transverse wave. So the sizes of the supercells for the anti-plane and in-plane modes may be different and need to be studied respectively. In this paper we will start from the simpler anti-plane mode. The influences of the supercell on the band structure and the wave localization phenomenon are discussed based on the modal distributions. The influences of the incidence angles on the transmission spectrum are also discussed.
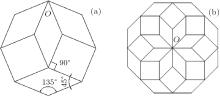
Unlike the periodic structure, there is no unit cell for the quasi-periodic strucuture, for which the quasicrystal cell should be mentioned. The quasicrystal cell for the eight-fold quasi-periodic system has two kinds of rhombusea. One is square, i.e., it has four right angles and the other has two angles of 45° and two angles of 135° . These two rhombuses assemble into a quasicrystal cell as shown in Fig. 1(a). Then as shown in Fig. 1(b) the center pattern of the quasicrystal cell can be obtained by taking the quasicrystal cell as the basic constitutional unit and rotating 360° around point O as the center.[22] This pattern has the eight-fold symmetry and can generate the Penrose tiling by the self-similiarty quasi-periodicity with 

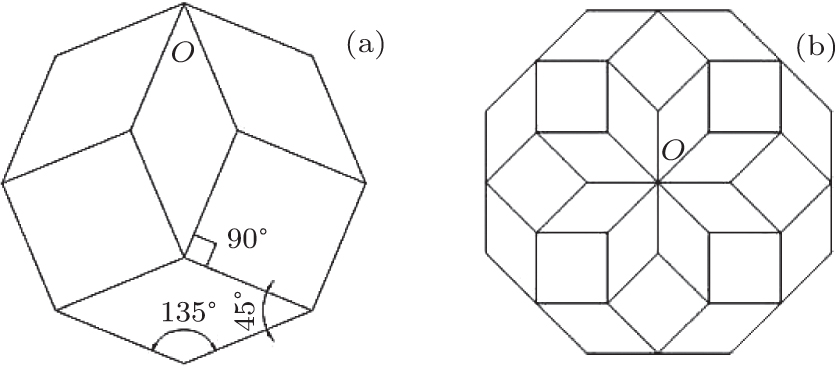 | Fig. 1. Quasicrystal cell (a) and the center pattern of the quasicrystal cell (b) with eight-fold symmetry.[15] |
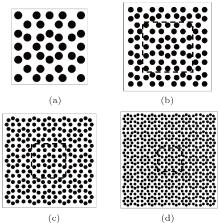
For the 2D eight-fold solid/solid QPNCs, the supercell method is employed to calculate the band structures. The supercell should involve the center pattern of the quasicrystal cell. If the size of the supercell is too small, the long-range order cannot be reflected; but the calculation time will be too long if the size of the supercell is too large. So first we should choose the approprate size of the supercell by selecting different numbers of the scatterers. The different calculated models of the supercells with 37, 97, 249, and 617 scatterers are shown in Figs. 2(a)– 2(d), respectively. For convenience, the above four models of the supercells are named models A, B, C, and D, respectively. The dashed squares in Figs. 2(b)– 2(d) respresent the supercell with 37 scatterers.
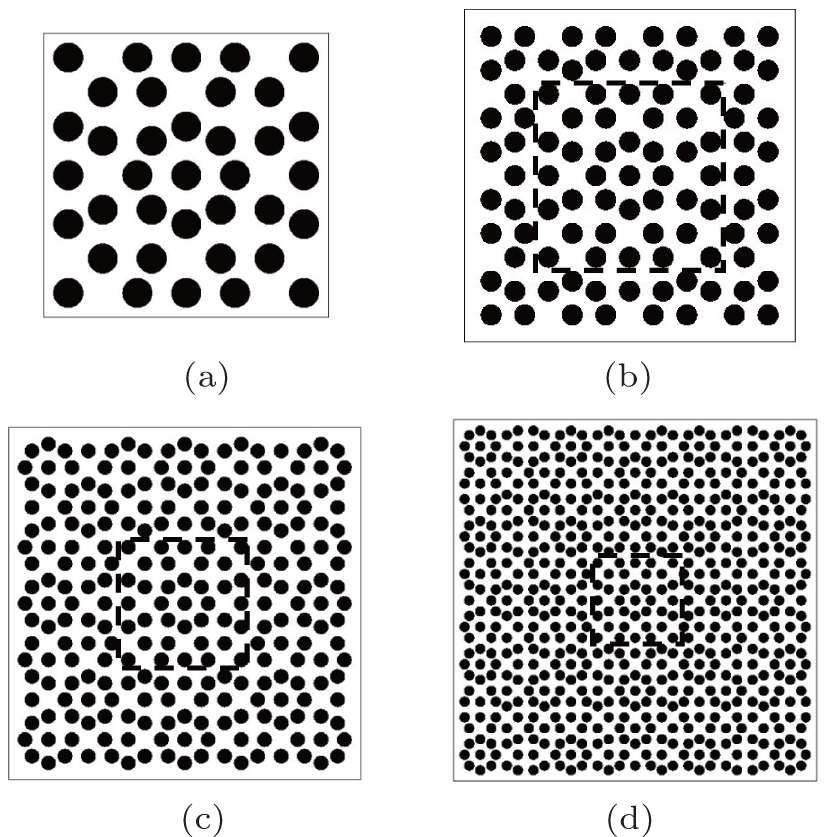 | Fig. 2. Calculated models for supercells with 37 (a), 97 (b), 249 (c), and 617 (d) scatterers. The latter two samples are for calculation of the transmission spectrum. |
Then, COMSOL Multiphysics 3.5a is utilized to calculate the dispersion curves directly. The Acoustic Module operating is applied under the 2D plane strain Application Mode (acpn) for the in-plane mode or the Pressure Acoustic Mode (acpr) for the anti-plane mode. The Bloch boundary condition[23] i.e., Eq. (1), is imposed on the two opposite boundaries of the supercell which is meshed by using the default triangular mesh with Lagrange quadratic elements provided by COMSOL. Eigenfrequency analysis is chosen as the solver mode, and the direct SPOOLES is selected as the linear system solver. Still, we require the Hermitian transpose of a constraint matrix, and in symmetry detection in the advanced solver parameter settings. The Bloch boundary condition is expressed as

where U is the displacement of the node; r is the position vector of the node on the boundary; ã is the base vector of the supercell, which is different from those of the periodic PNCs.
It should be noticed that for the anti-plane mode the “ eigenvalue linearization point” should be set to zero. Finally all the dispersion curves can be obtained by inputting the wave vector k swept the edges of the first reduced Brillouin zone.[23] For more details, readers can refer to Ref. [24]. If we prescribe that the displacement with the amplitude 1.0 is on the left boundary of the finite structure, the transmitted signals can be received on the right boundary. Then the tranmission spectrum can be obtained by sweeping the frequency.
In this section the dispersion curves of the anti-plane and in-plane modes for the 2D eight-fold solid/solid QPNCs are calculated by using the above calculation models. The QPNCs are made of Pb scatterers and epoxy matrix. Without special statement, the radius of the Pb cylinder is r = 3 mm. The material parameters of the scatterer Pb and the matrix epoxy are ρ Pb = 11600kg/m3, EPb = 4.08 GPa, ν Pb = 0.369, ρ epoxy = 1180 kg/m3, Eepoxy = 4.35 GPa, and ν epoxy = 0.368, respectively. The size of the unit cell of the PAS for the eight-fold QPNC is 

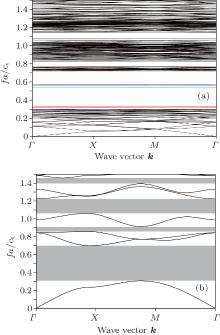
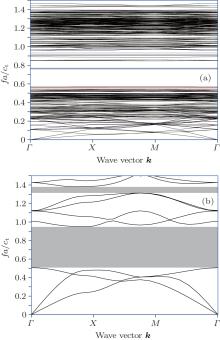
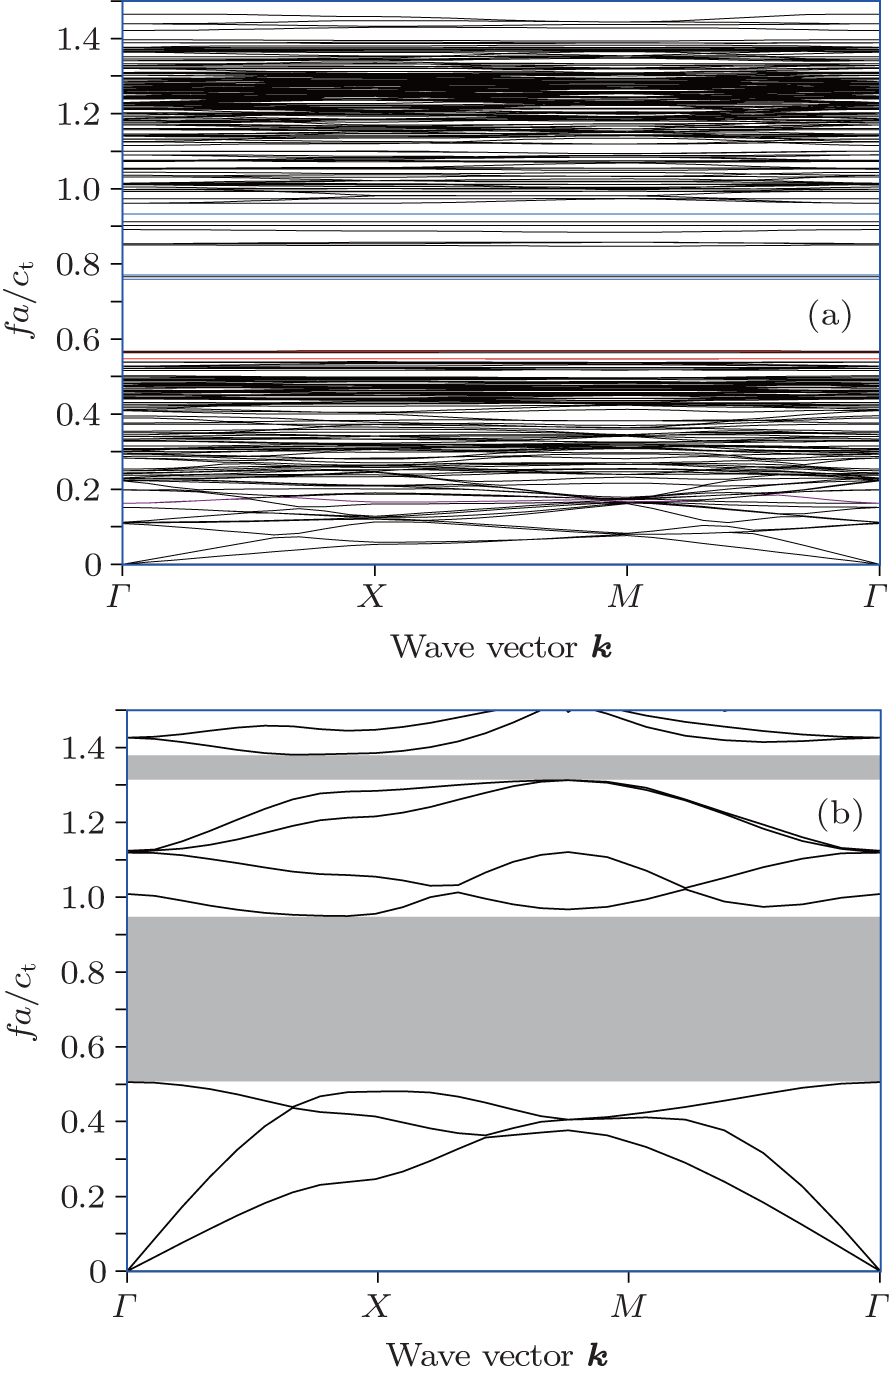
Figure 3(a) shows the dispersion curves of the anti-plane wave propagating in the eight-fold QPNC, which are calculated by using the smaller supercell with 37 scatterers, i.e., model A. The band structures of the PAS of the eight-fold QPNC, obtained by using the plane wave expension method, are presented in Fig. 3(b) in which the gray zones are band gaps. Comparing Fig. 3(a) with Fig. 3(b), it can be seen that the frequency intervel of the first band gap for the QPNC, (0.308, 0.701), is in good agreement with that of its PAS. However, there are many flat bands in the first band gap of the QPNC. The frequency interval of the second band gap, (0.771, 0.827), for the QPNC corresponds to a pass band in Fig. 3(b). And the frequency intervel of the third band gap for the QPNC is a little narrower than that of its PAS. It can be seen that the band gap of the eight-fold QPNC with low frequencies, i.e., the most important band gap can be well presented by its PAS.
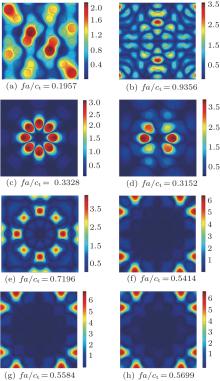
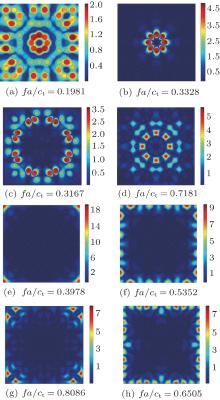
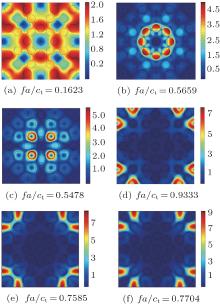
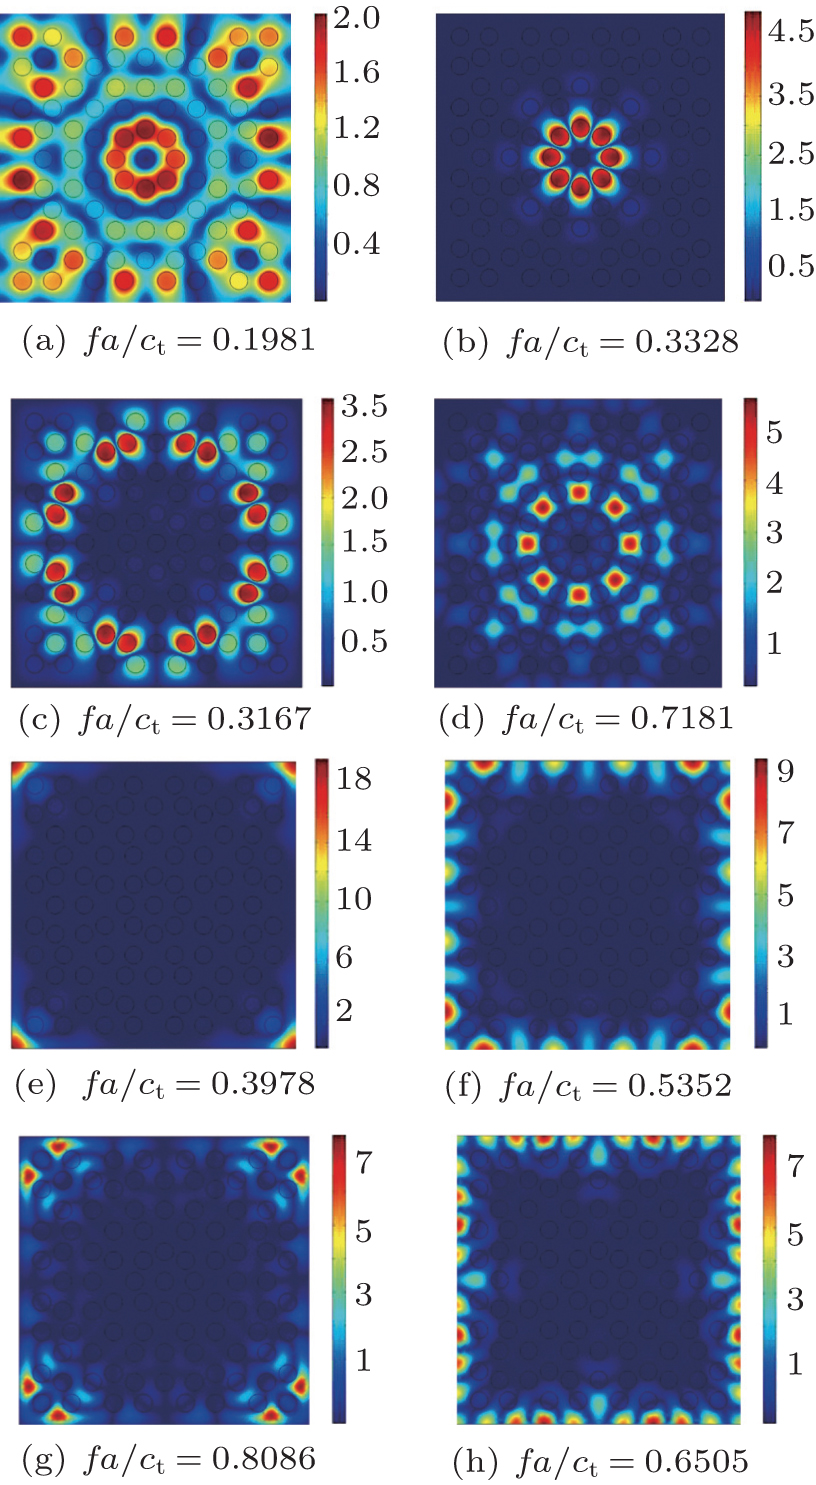
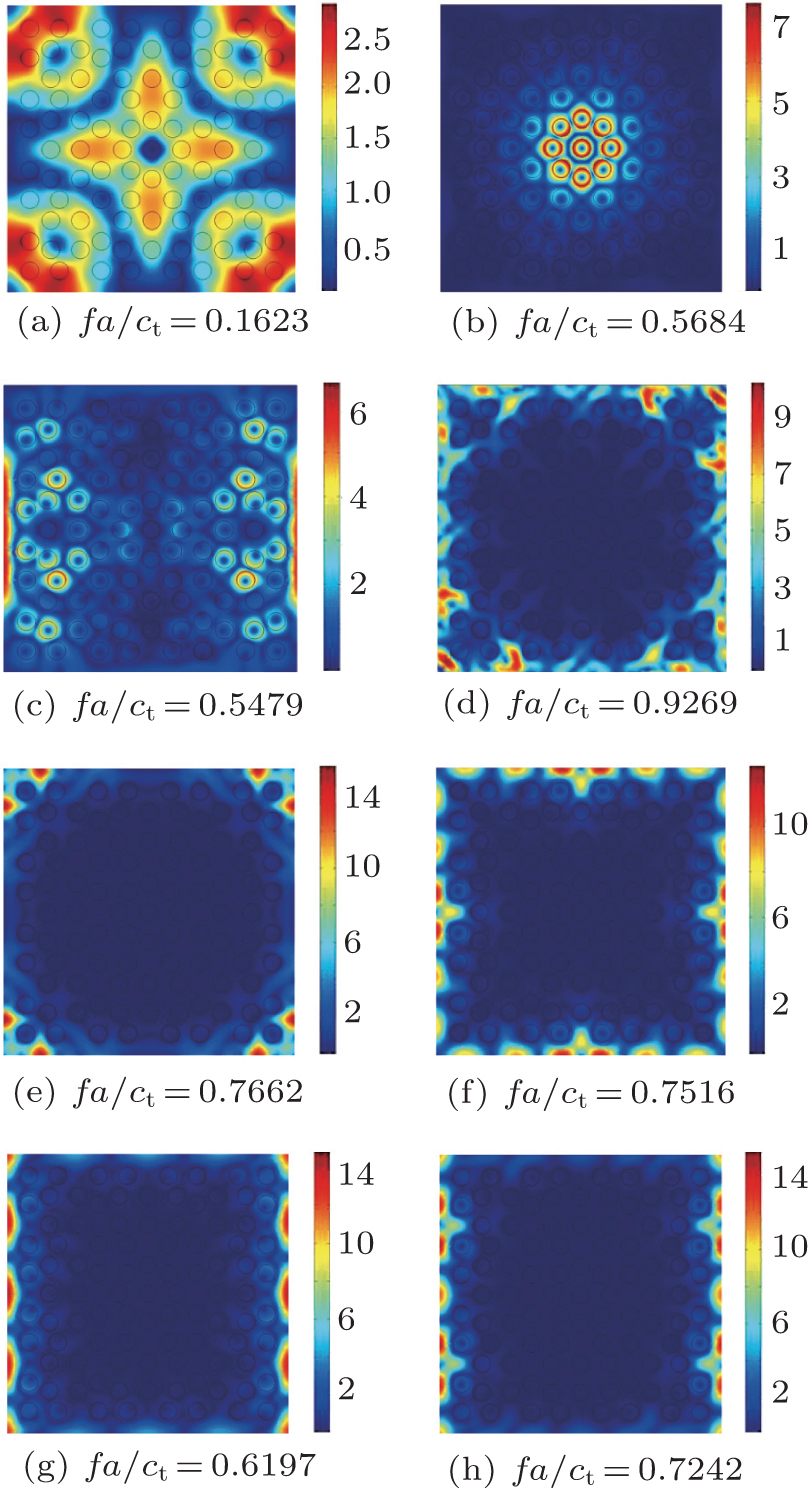
The modal distributions for the Γ point with different frequencies on the flat bands appearing in Fig. 3(a) are shown in Fig. 4 for further studies. Figures 4(a) and 4(b) show the modal distributions for Γ points in the pass bands with non-dimensional frequency being 0.1957 and 0.9356. It can be seen that there are obvious displacements in the whole system, meaning the elastic wave propagating in the structure. Figures 4(c) and 4(d) show the modal distributions for Γ points on the two red first band gaps as shown in Fig. 3(a). It can be seen that the larger displacement amplitudes (the red zones) are centered on the inner cylinder, which means that the wave localization phenomenon appears. In Fig. 4(e) corresponding to the Γ point on the flat band nearby the upper boundary of the first band gap the wave localization phenomenon also exists, but the localization appears in the matrix which is different from those in Figs. 4(c) and 4(d). Modal distributions for Γ points on the three blue flat bands near 0.55 are shown in Figs. 4(f)– 4(h), respectively. As shown in these three figures, there is no obvious displacement inside the system, but there is a localization phenomenon that appears outside and the localization degree is higher than those shown in Figs. 4(c)– 4(e). We argue that the localization phenomenon as described in Figs. 4(f)– 4(h) is not the property in itself for the quasi-periodic system and is probably related to the introduction of the supercell which breaks the quasi-periodicity and leads to misarrangements near the boundaries. In order to testify this conjecture, a larger model, i.e., model B (Fig. 2(b)), will be used to calculate the dispersion curve of the eight-fold QPNC.
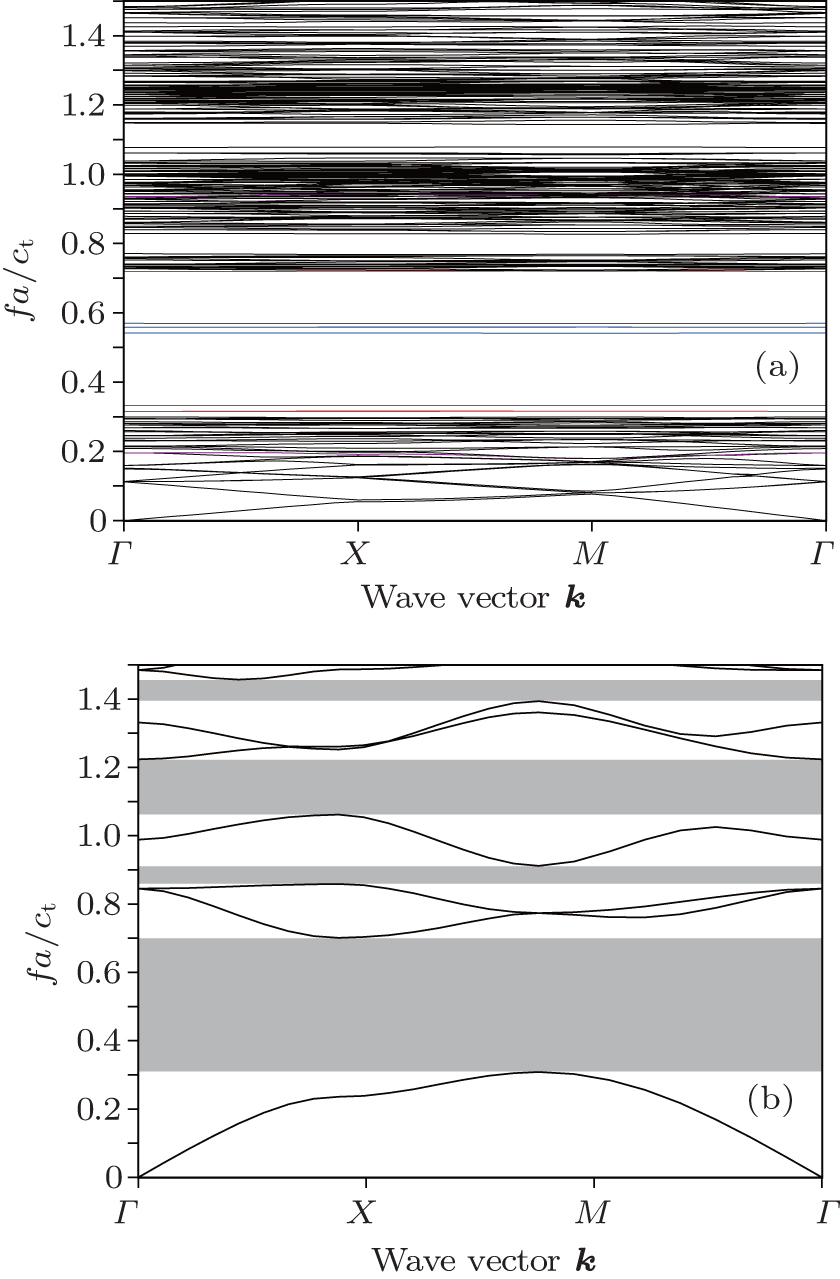 | Fig. 3. Band structures for the anti-plane mode of the eight-fold QPNC calculated by using model A (a) and its PAS (b). |
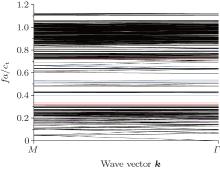
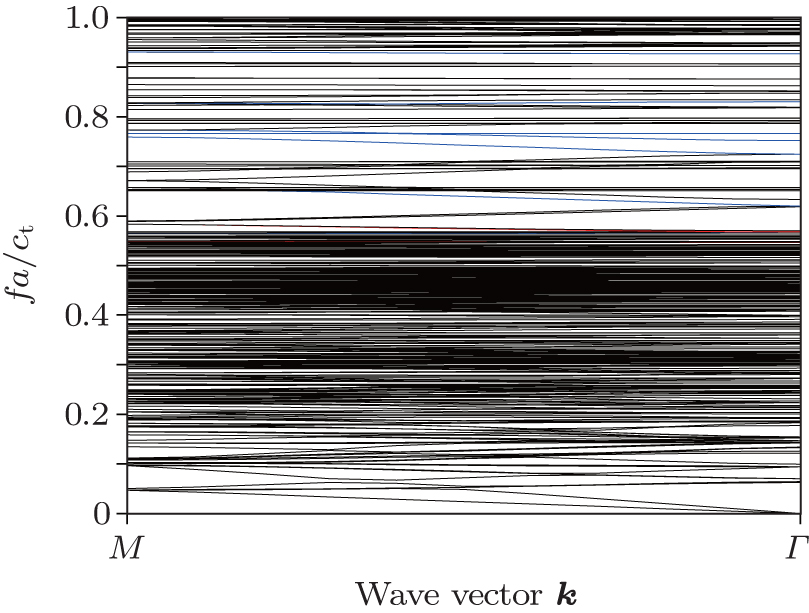
The dispersion curves for the anti-plane mode, calculated by using model B, are given in Fig. 5. It can be seen that more bands appear in the band structures than in Fig. 3(a). However, the flat bands near 0.55 as shown in Fig. 3(a) do not appear in Fig. 5, which testifies the above conjecture. For further discussion on the newly-minted bands in the band structures, calculated by using model B, the modal distributions for the Γ point with different frequencies are shown in Fig. 6. Figure 6(a) is still for the response to the pass band. The three red flat bands appearing nearby the lower and upper edges of the first band gap still exist in Fig. 5, and the modal distributions for the Γ points are plotted in Figs. 6(b)– 6(d), respectively. The localization forms accord with those in Figs. 4(c)– 4(e). From this point, it can be concluded that these three flat bands are caused by the disorder property of the quasi-periodic system itself and the localization modals exist actually, which is independent of the size of the supercell. Figures 6(e)– 6(h) are the model distributions for the Γ points on the three blue flat bands and one blue oblique band, from which it can be seen that the wave is localized mainly on the boundary of the model. According to the analyses of Figs. 3(a) and 4, we know that these localization forms have some relation with the size of the supercell and the corresponding bands are named unphysical bands. By checking all the model distributions for the Γ points of the bands appearing within the first band gaps in Fig. 5, we find that these bands are all unphysical bands.
 | Fig. 4. Modal distributions for Γ points at different frequencies. |
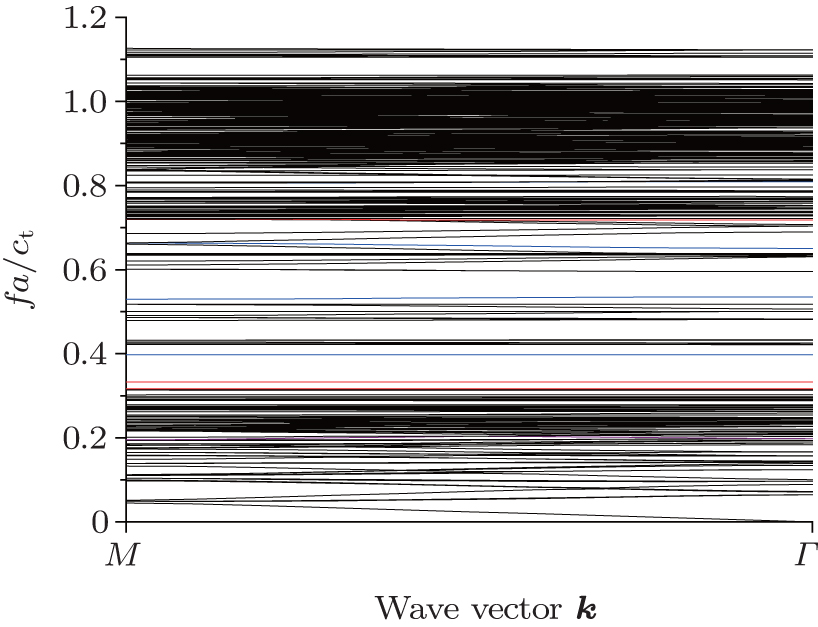 | Fig. 5. Band structures for the anti-plane of the eight-fold QPNC calculated by using model B. |
 | Fig. 6. Modal distributions for the Γ points with different frequencies. |
From the above discussion it can be concluded that the flat bands appearing near the upper and lower edges of the first band gap are physical ones that are caused by the short-range disorder of the quasi-periodic system itself, and the elastic waves with the corresponding frequencies will be localized in the system. The flat or oblique bands appearing in the first band gap are unphysical bands caused by the use of the supercell. It can be seen that if these unphysical bands are ignored, the results, especially the first band gaps, calculated by using models A and B will agree with each other and are consistent with those of its PAS.
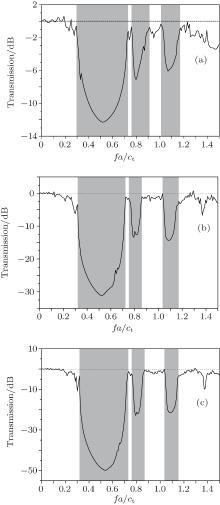
To verify the above conclusion, we calculate transmission spectra throught two larger systems: models C and D as shown in Figs. 2(c) and 2(d). The results for normal incidence are plotted in Figs. 7(b) and 7(c), respectively. For comparison, the transmission spectrum of model A is also calculated and shown in Fig. 7(a). The gray regions represent the intervals of band gaps in Fig. 7. It can be seen that the larger the model, the clearer the band gaps are. However, the basic variation trends of three curves and those of the non-dimensional frequency intervals of three band gaps shown in Fig. 7 are in substantial agreement. That is to say, the band gap property for the anti-plane mode of the eight-fold QPNC can be well studied by only using its center pattern, i.e. model A, as a supercell.
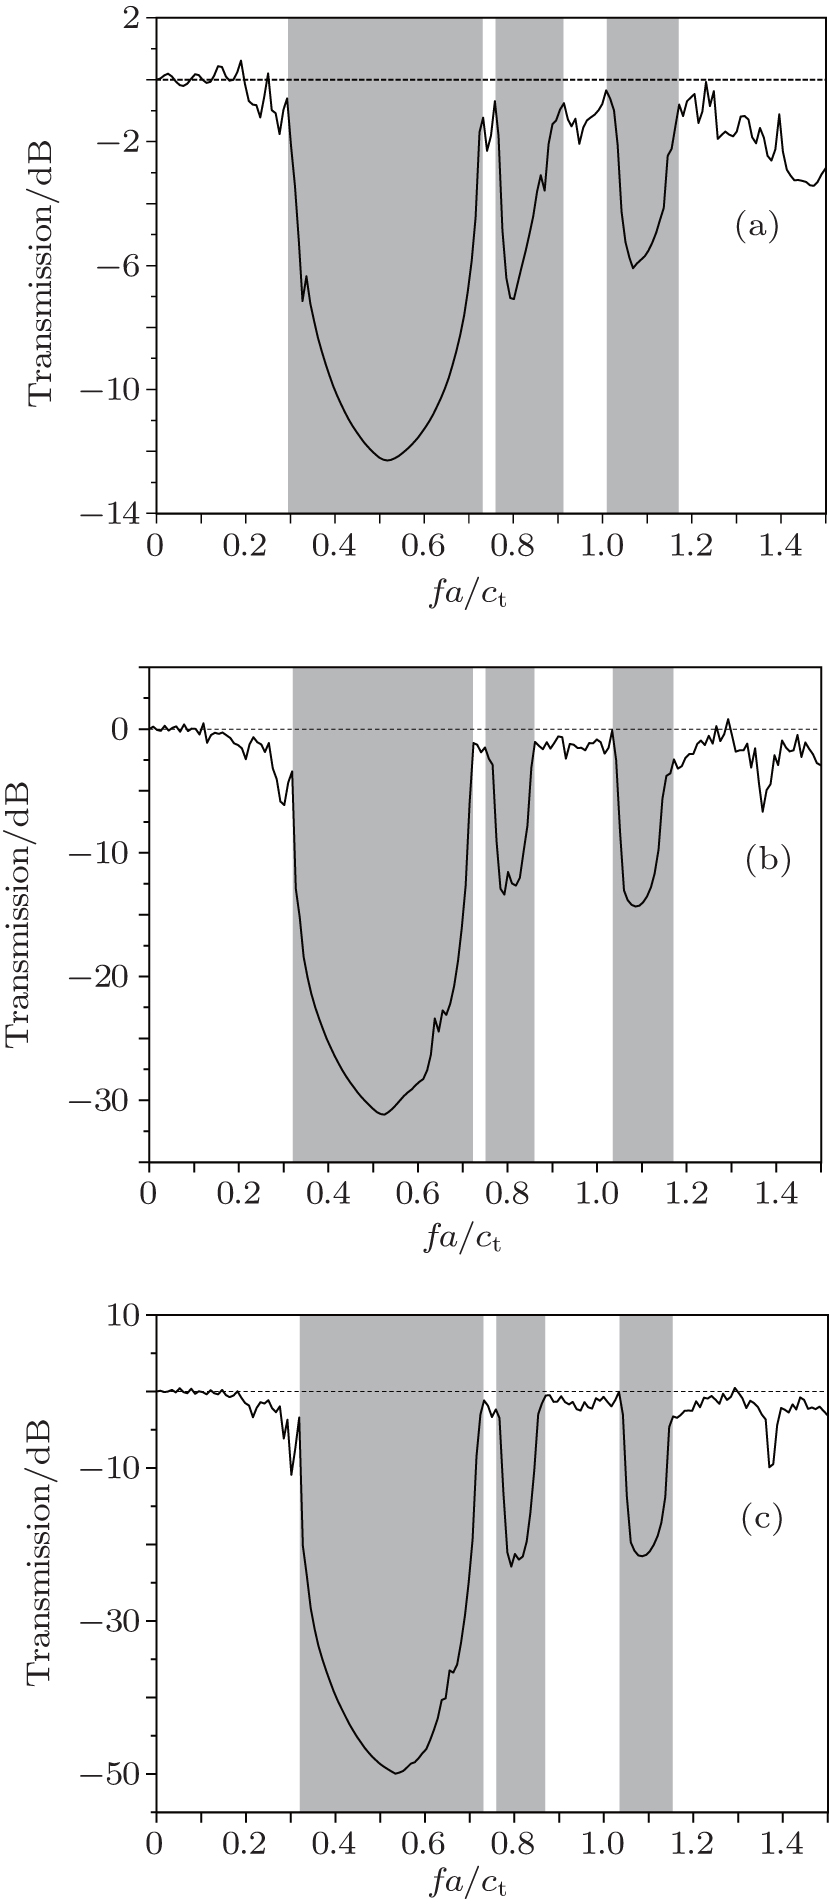 | Fig. 7. Transmission spectra of the eight-fold QPNC for the anti-plane waves propagating in models A (a), C (b), and D (c), respectively. |
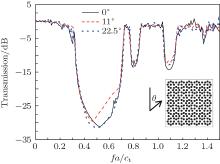
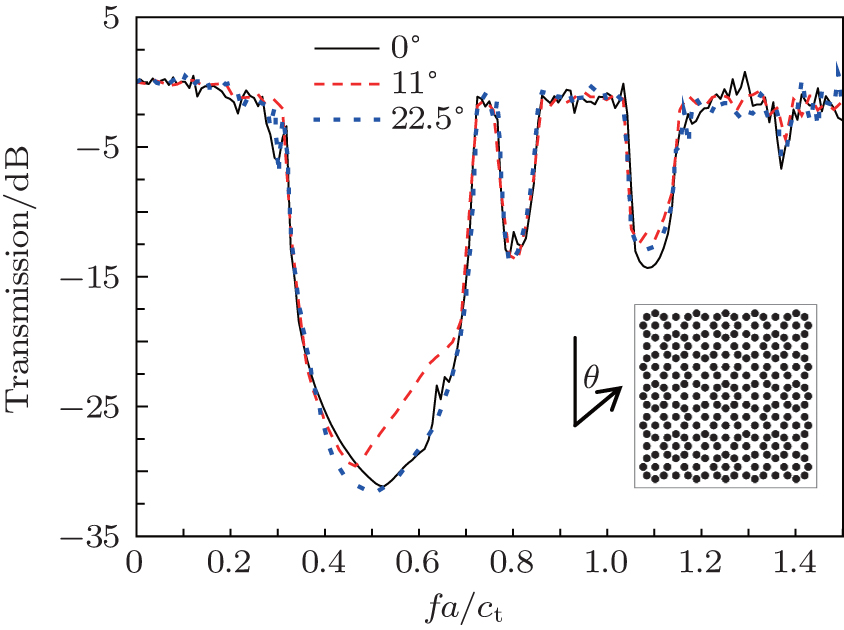 | Fig. 8. Transmission spectra of the eight-fold QPNC for anti-plane waves with different incident angles. |
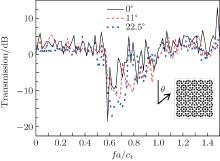
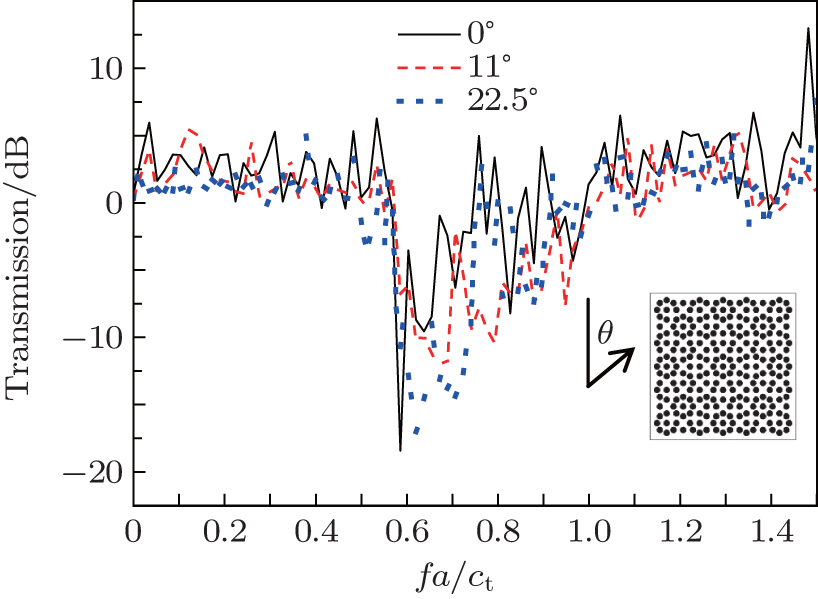
Finally, the transmission spectra of the anti-plane waves with different incident angles propagating through model C are calculated. As we know, an eight-fold QPNC has the eight-fold rotational and mirror symmetries, so the wave properties in all directions can be revealed with the incident angle changing from 0° to 22.5° . The transmission spectrum with the incident angles of 0° , 11° , and 22.5° are plotted in Fig. 8. It can be seen that the three curves almost have the same variation trend, and that the band gaps described by the curves are identical. This means that the band gaps of the eight-fold QPNC are independent of the incident angle.
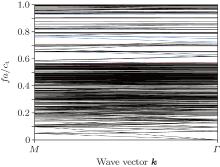
In this section the band structures of the in-plane wave propagating in the eight-fold QPNC will be analyzed. First, the influences of the supercell on the band structures are discussed as we did for the anti-plane mode. The band structures of the QPNC calculated by using model A are presented in Fig. 9(a), and figure 9(b) shows the dispersion curves for the PAS of the QPNC obtained by using the plane wave expension method in which the gray zones are the complete band gaps. It can be seen that the frequency intervals of the first band gap are in good agreement with each other. Compared with the anti-plane mode, many flat bands are in the first band gap.
 | Fig. 9. Band structures for the in-plane mode of the eight-fold QPNC, calculated by using model A (a) and its PAS (b). |
The modal distributions for Γ points with the non-dimensional frequencies of 0.5659, 0.5478, 0.9333, 0.7585, and 0.7704 are plotted in Figs. 10(b)– 10(f), respectivly. More specifically, figures 10(b) and 10(c) and figures 10(d)– 10(f) are for Γ points of the two red and three blue flat bands (as shown in Fig. 9(a)), respectively. For comparison, the modal distribution for the Γ point of one pass band (the purple line as shown in Fig. 9(a)) is also given as shown in Fig. 10(a) in which obvious displacements exist, meaning that the elastic wave can propagate in the whole system. For the flat bands near the lower edge of the first band gap, the wave localization phenomenon appears as shown in Figs. 10(b) and 10(c). While for the flat bands near the upper edge (Fig. 10(d)) and in the middle (Figs. 10(e) and 10(f)) of the first band gap, the waves are localized at the edges of the supercell. According to the discussion about the anti-plane mode, we know that this localization phenomenon is caused by the introduction of the supercell and these bands are unphysical ones.
 | Fig. 10. Modal distributions for Γ points with different frequencies. |
Next, as we did for the anti-plane mode, a larger model, i.e., model B will be used to testify the above conjecture. The dispersion curves calculated by using model B and the modal distributions for Γ points of some bands are presented in Figs. 11 and 12, respectively.
In Fig. 11 more flat and oblique bands appear in the band gap and the flat bands round the non-dimensional frequency 0.7585 shown in Fig. 9(a) are substituted by oblique bands. By combining with the modal distributions, i.e., Fig. 12, it can be seen that only the flat bands near the lower edge of the first band gap are physical bands (as shown in Figs. 12(b) and 12(c)). Neither the flat nor oblique bands appearing in the middle or near the upper edge of the first band gap are unphysical bands (as shown in Figs. 12(e)– 12(h)), which are different from those of the anti-plane mode.
 | Fig. 11. Band structures for the in-plane mode of the eight-fold QPNC, calculated by using model B. |
 | Fig. 12. Modal distributions for Γ points with different frequencies. |
At the same time the transmission spectra for the in-plane waves propagating in model A and model C are calculated and the results are shown in Figs. 13(a) and 13(b), respectively. The solid and dashed lines are for the P and SV waves, respectively. It can be seen that no matter whether the waves are P or SV waves, the basic variation trends of the transmission curves and those of the non-dimensional frequency intervals of the band gap are in substantial agreement. However, the larger the model is, the clearer the band gap is. From the above discussions it can be conclude that the band structures of in-plane waves propagating in the eight-fold QPNCs can be well revealed by choosing model A as the supercell.
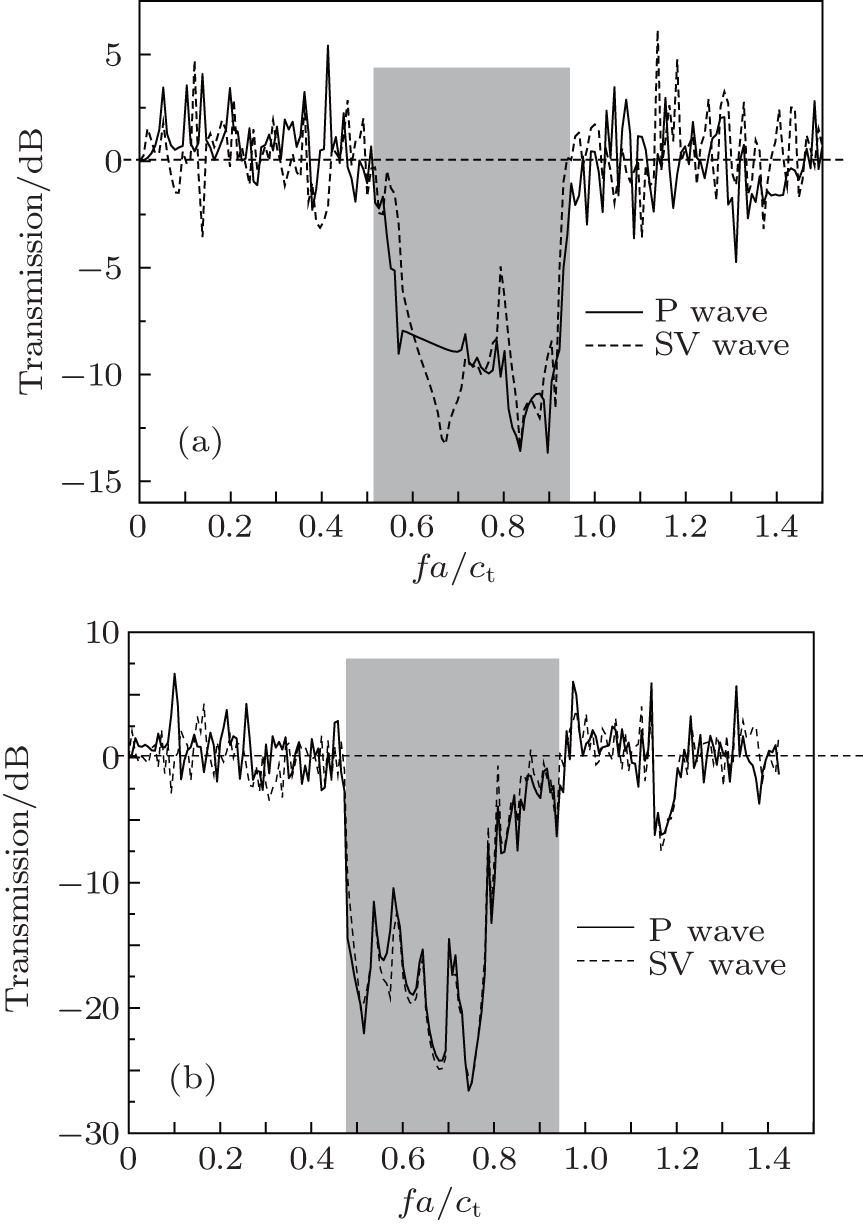 | Fig. 13. Transmission spectra of the eight-fold QPNC for the in-plane waves propagating in model A (a) and model C (b), respectively. |
 | Fig. 14. Transmission spectra of the eight-fold QPNC for in-plane waves with differernt incident angles. |
Finally, the transmission spectra for in-plane waves with incident angles of 0° , 11° , and 22.5° , propagating in model C are calculated and the results are plotted in Fig. 14. It can be seen that the band gap for the in-plane mode of the eight-fold QPNC is also independent of incident angle. So the band gaps of the eight-fold QPNC are isotropic in some degree.
In this paper, the finite element method combining with the supercell method is used to directly calculate the dispersion curves of the 2D eight-fold QPNCs. Four models with different numbers of the scatters are used. The influences of the supercells on band structures and wave localization phenomenon are discussed by combining with the modal distributions. The influences of incident angles on the transmission spectra are also discussed. From the above discussion, the following conclusions can be obtained.
(i) The band gap properties for both anti-plane and in-plane modes of the eight-fold QPNC can be well revealed by only taking its center pattern which contains 37 scatterers as a supercell. The frequency zone of the first band gap of the eight-fold QPNC can be well shown up by those of their periodic average structures.
(ii) For the anti-plane mode, the flat bands appearing near the upper and lower edges of the first band gap are physical bands which are caused by the disorder of the quasi-periodicity of the system and lead to the wave localization phenomenon. The bands appearing in the middle of the first band gap are all unphysical bands caused by the introduction of the supercell. The larger the supercell, the more the unphysical bands will be.
(iii) For the in-plane mode, only the flat bands appearing near the lower edge of the first band gap are physical bands. The bands appearing near the upper edge and in the middle of the first band gap are all unphysical bands.
(iv) The incident angles of elastic wave have little influence on the band gap of the eight-fold QPNC.
| 1 |
|
| 2 |
|
| 3 |
|
| 4 |
|
| 5 |
|
| 6 |
|
| 7 |
|
| 8 |
|
| 9 |
|
| 10 |
|
| 11 |
|
| 12 |
|
| 13 |
|
| 14 |
|
| 15 |
|
| 16 |
|
| 17 |
|
| 18 |
|
| 19 |
|
| 20 |
|
| 21 |
|
| 22 |
|
| 23 |
|
| 24 |
|