†Corresponding author. E-mail: xuxuemei999@126.com
*Project supported by the National Natural Science Foundation of China (Grant Nos. 61172047 and 61071025).
Identifying state transition and determining the critical value of the Duffing oscillator are crucial to indicating external signal existence and have a great influence on detection accuracy in weak signal detection. A circular zone counting (CZC) method is proposed in this paper, by combining the Duffing oscillator’s phase trajectory feature and numerical calculation for quickly and accurately identifying state transition and determining the critical value, to realize a high-efficiency weak signal detection. Detailed model analysis and method construction of the CZC method are introduced. Numerical experiments into the reliability of the proposed CZC method compared with the maximum Lyapunov exponent (MLE) method are carried out. The CZC method is demonstrated to have better detecting ability than the MLE method, and furthermore it is simpler and clearer in calculation to extend to engineering application.
The research of weak signal detection[1] has attracted much attention due to their extensive applications in radar, communication, sonar, earthquake, and industrial measurement. The traditional time-domain and frequency-domain approaches[2] to the weak signal detection require complex and expensive devices but their signal-to-noise rates (SNRs) are poor. Recently, with the fast development of chaotic theory, the applications of chaotic characteristics to weak signal detection[3– 6] have been a hotspot and developed into a branch of weak signal detection. The chaotic oscillator holds the characteristic that the non-equilibrium state transition is extremely sensitive to a certain signal and immune to noise.[7] A very low threshold of SNR can be achieved when this peculiar characteristic is used to realize the weak signal detection. Identifying state transition and determining the critical value of the chaotic oscillator driven by the external signal, both of which act as an important clue for weak signal detection, can be regarded as indispensable tasks in detecting.[8] Two typical methods are used to identify state transition of the chaotic oscillator: visual analysis[9– 11] and analytical method.[12– 14] Visual analysis such as phase figure, time series analysis, and Poincare section is rather subjective and imprecise, because for the chaotic oscillator in the visual analysis the state transition is identified and the critical value is determined through observation, comparison, analysis, and synthesis. The analytical method such as fractal dimensions, Kolmogorov entropy, and the maximum Lyapunov exponent is extraordinarily complex in calculation and is time-consuming, because for the chaotic oscillator this method uses special chaotic characteristic values to identify state transition and determine critical value.
In this paper, a circular zone counting (CZC) method based on the Holmes Duffing oscillator is proposed to solve the problem of identifying the chaotic oscillator’ s state transition and determining the critical value. Our method uses two circular zones to partition the phase plane of the Duffing oscillator, then counts the number of point pairs (x(t), y(t)) inside each circular zone in the phase plane. Meanwhile the absolute value of difference in the number of point pairs (x(t), y(t)) between the two selected circular zones is calculated to indicate whether the state transition occurs and to determine critical value. Our method skillfully uses the circular zone partition and counting ideas to keep the merits of the typical visual analysis and analytical method, and at the same time overcome their shortcomings. Thus it is able to detect the weak signal precisely at smaller computing cost than the typical methods such as phase analysis and the MLE.[13– 15]
We choose the common Holmes Duffing oscillator model that has been extensively studied:[16, 17]

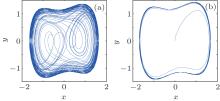
where k is the damping ratio, − x + x3 is the nonlinear restoring force, and f cos(wt) is the internal sinusoidal driving force. In our paper, we fix k = 0.5, w = 1, and as the force amplitude f varies from small to big, the system state varies from chaotic motion to the great periodic motion as shown in Fig. 1.
Then the Holmes Duffing model is modified into a weak signal detecting model as shown in Eq. (2) and rewritten as Eq. (3)


In the modified Eqs. (2) and (3), we add an external to-be-detected signal acos(t) with negative coefficient and Gaussian white noise n(t). When fixing f = f0 (f0 refers to the critical value), the system enters into a critical state (the great periodic motion, which is just transformed from the chaos motion). After adding the external to-be-detected signal as a perturbation to the internal sinusoidal driving force, the system goes back to chaos motion. Then f is increased step by step, resulting in (f– a) greater than f0 to induce the state transition. Meanwhile, the great periodic motion will pull out the to-be-detected signal that is buried in the noise environment.
In this paper, the state transition from chaos motion (Fig. 1(a)) to great periodic motion (Fig. 1(b)) is used to detect whether there is any signal buried in the noise environment.
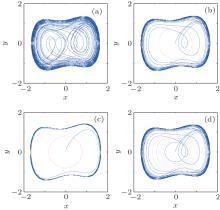
As seen in Fig. 1, the phase diagrams of chaos motion and the great periodic motion are quite different in feature. Therefore, the image feature of Duffing oscillator’ s phase trajectory is taken into consideration in our weak signal detection. To begin with, a proper circular region within but not across the orbicular track of the Duffing oscillator is set in the phase plane (Figs. 2(a)– 2(c)). The phase plane of the Duffing oscillator is then partitioned into two regions by the circular zone: outside the circular zone and inside the circular zone. As shown from Fig. 2(a) to Fig. 2(c), with f increasing, the phase trajectory of the Duffing oscillator changes from disorder to order, and the number of point pairs (x(t), y(t)) inside the circular zone declines gradually. Clearly, the number of point pairs (x(t), y(t)) inside the circular zone is related to the force amplitude f. Thus the number of point pairs (x(t), y(t)) inside the circular zone can be used to indicate the chaotic oscillator’ s state transition. Numpp is used to represent the number of point pairs (x(t), y(t)) inside the circular zone in the following part of the paper.
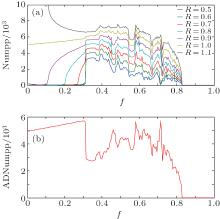
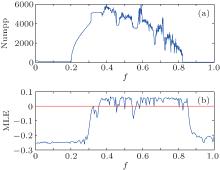 | Fig. 3. Comparision between variations of Numpp and MLE with f (0, 1). (a) Numpp varying with f, radius of the circular zone is R = 0.8. (b) MLE varying with f. |
Set f (0, 1) as a varying parameter, and solve Eq. (3) (herein the to-be-detected signal and Gaussian white noise are not taken into consideration) to obtain Numpp for each single f. Figure 3(a) shows the variation of Numpp with force amplitude in a range of f (0, 1), and figure 3(b) describes the variation of MLE with f in the range (0, 1). It is well known that the MLE changes from greater than zero to less than zero when the chaotic oscillator’ s state changes from chaotic motion to great periodic motion. Therefore comparing Fig. 3(a) with Fig. 3(b), we come up with a speculation that the fluctuating line in Fig. 3(a) signifies that the Duffing oscillator is in chaos motion and the flat line indicates that the Duffing oscillator is in great periodic motion. This speculation is understandable when considering the fact that the phase trajectory of the Duffing oscillator is disorderly and variable in chaos motion while it is ordered and remains relatively unchanged in great periodic motion.
To verify our speculation, a series of circular zones with the values of R = 0.5, 0.6, 0.7, 0.8, 0.9, 1.0, 1.1 are set in the phase plane as shown in Fig. 2(d). Figure 4(a) illustrates the variations of Numpp with different radii with f. According to Fig. 4(a), the 7 Numpps with different radii have similar changing trends and all rapidly turn to flat line almost at the same point, which is exactly the critical point we need for identifying state transition. However, the relatively large segment flat lines before f = 0.3 and the small segment flat lines between f = 0.3 and f = 0.8 in Fig. 4(a) may lead to the wrong judgment of the critical point. To eliminate the effect of those flat lines, 2 circular zones with radii of R1 = 0.5 and R2 = 1.0 are chosen to set in the phase plane, and then the absolute value of difference between the number of point pairs in the circular zone of R1 and that in the circular zone of R2 is calculated to determine the critical point (ADNumpp represents the absolute value of difference between the number of point pairs in the circular zone of R1 and that in the circular zone of R2 in the following part of this paper). Figure 4(b) features ADNumpp varying with f (0, 1). Apparently, the point that ADNumpp finally remains relatively unchanged is just the critical point that induces state transition. The judgment of the remaining relatively unchanged parts is made by comparing with a threshold TD, which is related to noise added to the system and will be discussed later.
Based on the above studies, a CZC method is proposed to determine the critical value and identify state transition. The specific implementation to identify state transition by the CZC method can be described below.
(i) Initializing the parameters: start force amplitude f = fstart; radii of the two circular zones R1 = 0.5 and R2 = 1.0.
(ii) Solving Eq. (3) with force amplitude f. Calculate the value of x(t)2 + y(t)2 using data from the Duffing oscillator’ s output solved in Eq. (3) with force amplitude f. For each point pair 

(iii) Then the absolute value of difference between the number of point pairs in the circular zone of R1 and that in the circular zone R2 is calculated, and let

Compare the ADNumpp with the threshold TD. If ADNumpp> TD, the Duffing system is in chaos motion, otherwise it is in great periodic motion.
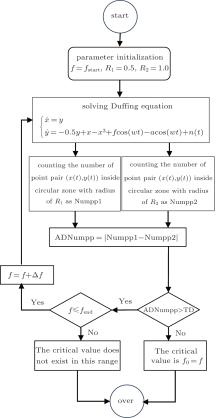
The specific implementation to determine the critical value by the CZC method, while f is varying in [fstart, fend] with the varying step of Δ f can be described as follows. Figure 5 shows the flow chart of determining the critical value by the CZC method.
i) Initializing parameters: start force amplitude f = fstart; radii of the two circular zones R1 = 0.5 and R2 = 1.0.
ii) Solving Eq. (3) with force amplitude f. Count the number of point pairs (x(t), y(t)) inside the circular zones with radii of R1 and R2, and denote them as Numpp1 and Numpp2, respectively.
iii) Then the absolute value of difference between the number of point pairs in the circular zone of R1 and that in the circular zone of R2 is calculated, and let

Compare the ADNumpp with the threshold TD. If ADNumpp> TD, turn to procedure vi); otherwise the critical value is the current force amplitude f0 = f, and the program is over.
vi) If f ≤ fend, reset f = f + Δ f and repeat procedures ii)– iv); otherwise the critical value does not exist in this range of [fstart, fend], and the program is over.
The basic principle of the weak signal detecting method based on the Duffing oscillator is as follows. Firstly, setting the internal sinusoidal driving force at the critical value; then, when the external to-be-detected signal is added to the system, state transition occurs to indicate the existence of the to-be-detected signal. However, the external to-be-detected signal is always buried under background noise, so the background noise is added to the Duffing oscillator detecting system with the to-be-detected signal simultaneously. This method requires that background noise is not able to induce state transition but the to-be-detected signal can. Therefore, whether background noise could lead to state transition determines the reliability of the Duffing oscillator detecting method. Currently, the theoretical foundation about the influence of noise on chaotic system has been analyzed in depth.[18– 20] The Duffing oscillator weak signal detecting system has immunity to noise, [21– 23] which means that adding a relatively intense noise does not affect the state transition when the system is in chaos motion or in great periodic motion, rather than the case that noise has no effect on the system. While the power of noise is small, it could not affect the state transition of the system and only makes the local trajectory on the phase plane diagram look rough. But when the power of noise increases to a certain intensity, the critical point at which state transition happens will shift with the increase of noise intensity.
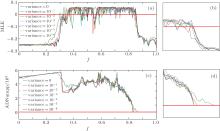
The CZC method we proposed here combines the Duffing oscillator’ s phase trajectory feature and numerical calculation together to quickly determine the critical value and identify the state transition. To explain the reliability of the CZC method, a numerical experiment is carried out between the CZC method and the MLE method. Gaussian white noise with variances of 0, 10− 1, 10− 2, 10− 3, 10− 4, 10− 5, 10− 6, are added to the detecting system, respectively, to study the effect of noise on determining the critical value by the MLE method (Fig. 6(a)) and the CZC method (Fig. 6(c)). Figures 6(b) and 6(d) are the partial enlargements of Figs. 6(a) and 6(c) around the critical point. Figure 6(b) shows that Gaussian white noises with different variances all have effect on the shift of the critical point by the MLE method. When the variance is small the shift is small, and when the variance is large the shift is large. Figure 6(d) uncovers that Gaussian white noises with variances of 10− 3, 10− 4, 10− 5, 10− 6 almost have no influence on determining the critical value by the CZC method, and those with variances of 10− 1, 10− 2 lead to a large shift of the critical point compared with the case of no noise. The numerical experiment shows that noise has less effect on the CZC method than on the MLE method. Therefore, compared with the MLE method, the CZC method performs better in anti-noise capability and it is more reliable. Besides, the CZC method needs four multiplications, two summations, and two comparison operations in total for each Duffing oscillator output, and an extra operation of subtraction, absolute value, and comparison for each f, whose computational complexity is much less than that of the MLE method.
| Table 1. The 15 groups of ADNumpp data around the critical point of the CZC method under Gaussian white noise with different variances. |
The accuracy of the critical value determined by the CZC method depends on the selection of threshold TD under different noises. Listed in Table 1 are 15 groups of ADNumpp data around the critical point obtained by the CZC method under Gaussian white noise with variances of 0, 10− 1, 10− 2, 10− 3, 10− 4, 10− 5, 10− 6. As Table 1 shows, ADNumpp data with variances of 10− 3, 10− 4, 10− 5, and 10− 6 all turn to 10 and are nearly invariable in group number 7 which is the same as the situation of without noise, and ADNumpp data with variance of 10− 2 become nearly invariable in group number 8, while those ADNumpp data with variance of 10− 1 become nearly invariable in group number 14. From Table 1 we learn that the threshold TD should be set according to the power of background noise accompanied with the to-be-detected signal. When the variance of noise is small, the threshold TD is low, and when the variance of noise is large, the threshold TD should be set to be high. Obviously, if the threshold TD in procedure iii) is set to be 100, the critical point will not shift even under Gaussian white noise with the variance of 10− 3, and the threshold TD should be set to be about 500 for the variance of 10− 2. So, the reasonable setting of threshold TD is significant for achieving the best detecting performance in engineering application.
In this paper, by combining the Duffing oscillator’ s phase trajectory feature and numerical calculation, the CZC method successfully transforms information about the to-be-detected signal hidden in the two-dimensional phase plane into the one-dimensional signal to simplify the computational mode of the Duffing oscillator weak signal detection system. Studies are conducted to prove that the CZC method is able to automatically identify state transition and determine the critical value of the Duffing oscillator at smaller computing cost and with better effect than the most commonly used MLE method. Therefore the CZC method has a good real-time performance in realizing a high-efficiency weak signal detecting system, which has a broad prospect of application in engineering.
| 1 |
|
| 2 |
|
| 3 |
|
| 4 |
|
| 5 |
|
| 6 |
|
| 7 |
|
| 8 |
|
| 9 |
|
| 10 |
|
| 11 |
|
| 12 |
|
| 13 |
|
| 14 |
|
| 15 |
|
| 16 |
|
| 17 |
|
| 18 |
|
| 19 |
|
| 20 |
|
| 21 |
|
| 22 |
|
| 23 |
|


