Reweighted ensemble dynamics simulations: Theory, improvement, and application
Gong Lin-Chena) , Zhou Xinb)†  , Ouyang Zhong-Can
a), c)
, Ouyang Zhong-Can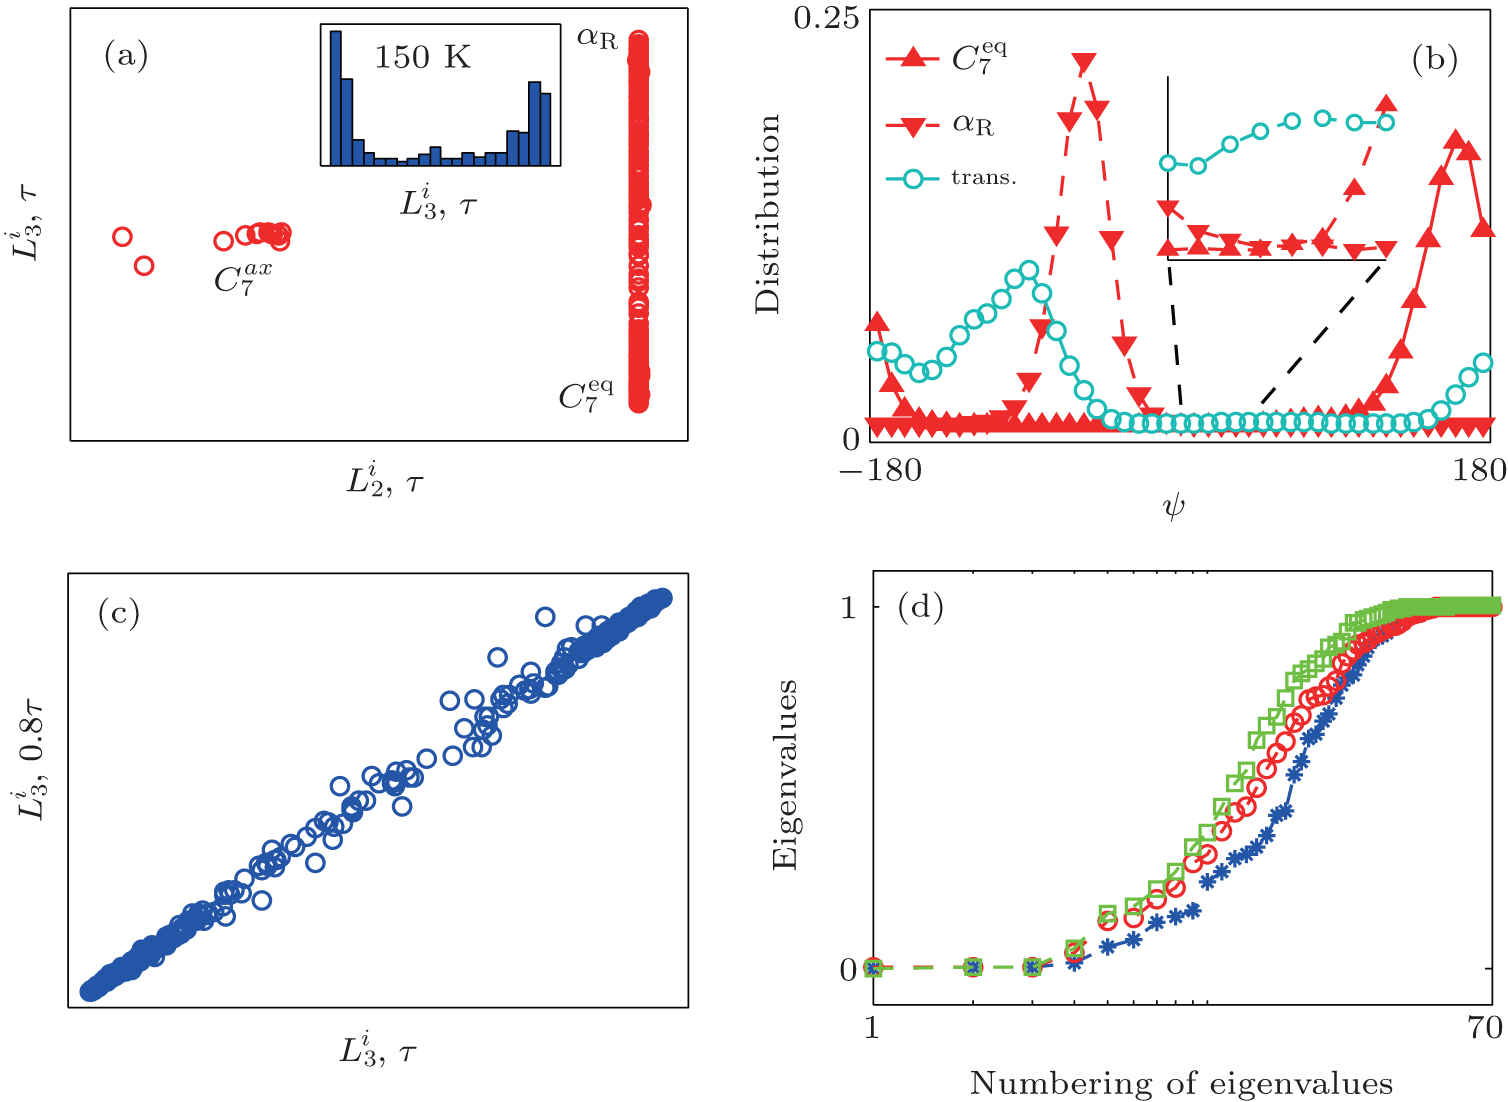
Reweighted ensemble dynamics simulations: Theory, improvement, and application |
|
Gong Lin-Chen
, Ouyang Zhong-Can |
| Results for the low-temperature simulation of alanine dipeptide. (a) The projection of trajectories into the space of and . The inset is the histogram of values. The different states, into which the trajectories are roughly classified, are labeled. (b) The distributions along the ψ angle in the groups are shown in panel (a). Shown are the distributions for the trajectories in the leftmost two bins (downward triangles), the rightmost two bins (upward triangles) and the other trajectories (circles). (c) The values calculated with truncated trajectories (80 percent length) versus the ones calculated with full trajectories. (d) The first 70 eigenvalues of H calculated with normal data set (blue stars), multiple trajectory data set (one-fifth initial configurations and five trajectories for each initial configuration) with the standard RED (red circles), multiple trajectory data set with SI2 method (green squares) are shown. |
| |