Reweighted ensemble dynamics simulations: Theory, improvement, and application
Gong Lin-Chena) , Zhou Xinb)†  , Ouyang Zhong-Can
a), c)
, Ouyang Zhong-Can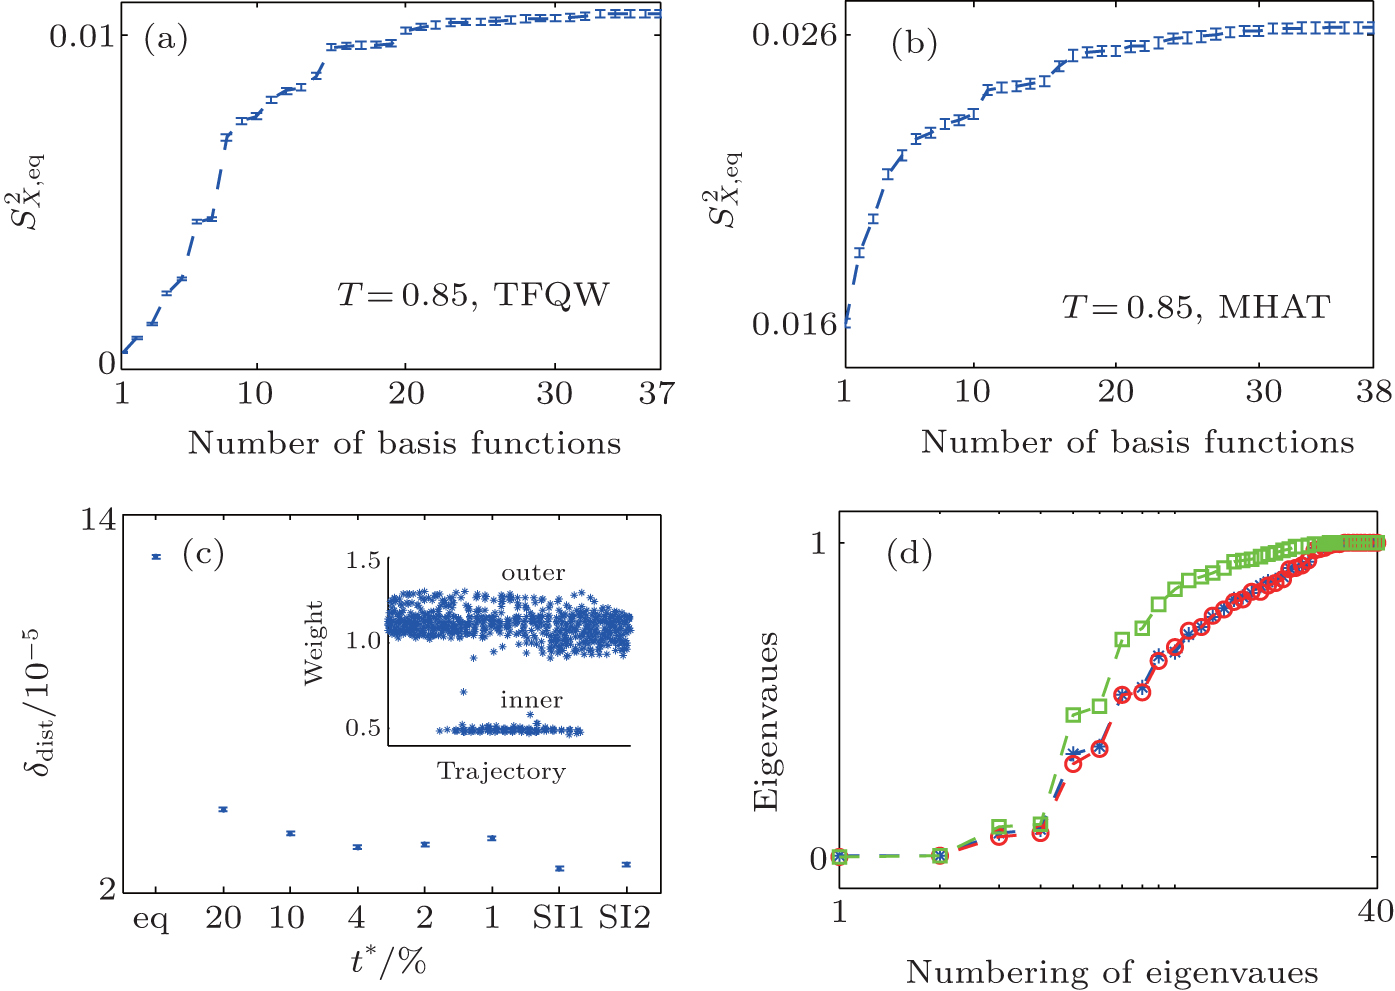
Reweighted ensemble dynamics simulations: Theory, improvement, and application |
|
Gong Lin-Chen
, Ouyang Zhong-Can |
| The S 2 curve, effect of t̃ , and illustration of statistics improvement. The behavior of S 2 with increasing number of basis functions are shown in panel (a) (TDQW) and panel (b) (MHAT). (c) The difference between the reconstructed equilibrium distribution and the theoretical distribution are shown for MHAT potential at T = 0.85. The horizontal axis denotes the method for reproducing the equilibrium distribution. ‘eq’ means the results without reweighting (i.e., w i = 1), numbers mean the selected ‘SI1’ and ‘SI2’ label the two methods for statistics improvement, respectively. The trajectory weights calculated with equal to 0.01 are plotted as the inset. In panels (a), (b), and (c), the statistical errors are also shown as error bars. (d) The first 40 eigenvalues of H for MHAT potential at T = 0.05. The ones calculated with normal data set (stars), multiple trajectory data set (one-fifth initial configurations and five trajectories for each initial configuration) with the standard RED (circles), multiple trajectory data set with the SI2 (squares) are shown. |
| |