†Corresponding author. E-mail: qiweihua1028@126.com
*Project supported by the National Natural Science Foundation of China (Grant No. NSF-11174069), the Natural Science Foundation of Hebei Province, China (Grant No. E2011205083), the Key Item Science Foundation of Hebei Province, China (Grant No. 10965125D), the Key Item Science Foundation of the Education Department of Hebei Province, China (Grant No. ZD2010129), and the Young Scholar Science Foundation of the Education Department of Hebei Province, China (Grant No. QN20131008).
Ag-doped manganite powder samples, La0.7Sr0.1Ag xMnO3− δ ( x = 0.00, 0.025, 0.05, 0.075, and 0.10) were synthesized using the sol–gel method. X-ray diffraction patterns indicated that the samples had two phases with the
As electronic systems with strong correlations, perovskite manganese oxides with an ABO3 structure have rich physical and chemical properties, [1– 8] and have been the subject of extensive attention, both experimentally and theoretically. Starting with the manganese oxide LaMnO3, bivalent alkaline earth metal or univalent alkali metal ions can substitute for the trivalent La ions. Typical examples have the general formula La1− xMxMnO3 (M = Ca, Ba, Sr, Pb, etc). The valence state and ionic radius of the doping ions at the A-sites affect the valence of the Mn ions at the B sites, and cause lattice distortion.
These compounds exhibit a number of interesting physical phenomena, including ferromagnetism, colossal magneto-resistance, and spin glass states. It has also been found that the Curie temperatures and the content of Mn4+ cations in La0.7− xSrxMnO3 (0.1 ≤ x ≤ 0.3) samples increase with increasing x.[1] In order to explain these phenomena, Zener[9] proposed the double exchange mechanism controlled by the displacement of eg electrons from Mn3+ to Mn4+ sites mediated by an O2− ion.
For the self-doped manganites, such as La1− xMnO3, a number of researchers have assumed that there were vacancies at the A sites and that the number of vacancies was related to the self-doping level.[10– 15] However, the available volume of the B sites was smaller than that of the A sites in the ABO3 perovskite structure. Therefore, based on the thermal equilibrium theory of crystal defects, our group[16] proposed that, in fact, there should be no cation vacancies at the A sites related to the self-doping level. A part of Mn2+ cations existed in A site of this kind of materials, [8, 16] which were proved using experimental method.[17, 18] Abou-Ras et al.[17] prepared self-doped perovskite manganite powder samples of composition Pr0.7Sr0.3− xMnO3− δ (x ≤ 0.2), and found, using the 55Mn nuclear magnetic resonance technique, that the Mn2+ content increased as the self-doping level x increasing. Ulyanov et al.[18] prepared Ti-doped, A-site deficient La0.6Sr0.4− xTixMnO3− δ (x ≤ 0.15) manganites, and using x-ray absorption finite structure studies, found that the Ti ions entered the B sites, instead of the A sites, while there were Mn2+ ions at the A sites.
There have been several reports in the literature concerning Ag-doping perovskite manganites.[19– 22] However, there are distinctly different views between these reports concerning whether Ag cations can dope into the perovskite phase. Tao et al.[19] synthesized a series of Ag-doped samples of La1− xAgxMnO3 by solid-state reaction method. Using x-ray diffraction spectra, they concluded that only the perovskite phase was present in the samples with x ≤ 0.25, and that there was a nonmagnetic metal Ag phase in addition to the perovskite phase in the samples with x > 0.25. However, other researchers[20, 21] have considered that Ag ions could not be doped into the A sites of the perovskite structure. In particular, Xu et al.[22] performed EELS (electron-energy-loss spectroscopy) studies for samples prepared by Tao et al. They found that the perovskite phase included only La, Mn, and O in the EELS spectrum. Since Ag particles were observed in SEM photos, they concluded that Ag could not be doped into the perovskite phase.
Our group reported the structures and the magnetic property of self-doped manganites La0.7− xSr0.3Mn1O3, [23] La0.8− xSr0.2MnO3, [24] La0.6− xSr0.4MnO3, [25] and La0.7Sr0.3− xMnO3.[26] We explained why there were Mn3O4 second phase in those samples when self-doping level was higher than a certain level.[23] In this work, in order to determine whether silver can dope into the A sites of the perovskite structure, we doped Ag in the self-doped manganites La0.7Sr0.1MnO3 contained the Mn3O4 second phase, prepared samples with the nominal composition La0.7Sr0.1AgxMnO3− δ using the sol– gel method. The crystal structure, the elemental content, the ion distribution, and the magnetic property of the samples have been investigated. All the experimental results indicate that the silver cations have been successfully doped into the A sites.
Powder samples with the nominal composition La0.7Sr0.1AgxMnO3− δ (0.00 ≤ x ≤ 0.10) were synthesized using the sol– gel method.[27, 28] Stoichiometric amounts of the high purity chemicals La2O3, Sr(NO3)2, AgNO3, and Mn(NO3)2 were dissolved in dilute HNO3 solution with PH = 3. Citric acid and ethylene glycol were then added to the solution as complexing agents for the metal ions. The molar ratios of citric acid to ethylene glycol and to the sample were 5.3:5.3:1.0. This solution was placed in a water bath at 363 K and slowly evaporated until a gel formed. This gel was heated at 473 K for 24 h until completely dry. After grinding, the powders were subjected to further heat treatment. The protocol for increasing the temperature was altered from the usual heat treatment in which the temperature is increased directly from 473 K to 773 K. In our procedure, the temperature was increased in steps of 50 K, from 473 K to 773 K, with 30 min spent at each step. The powders were then thermally treated at 773 K for 6 h, and were gradually cooled during furnace cooling. This improved procedure which results in slow decomposition of the organic precursor, may be a key improvement for doping Ag into the perovskite phase. After grinding, the powder was again thermally treated at 873 K for 5 h. Subsequently, the samples were calcined in air at 1073 K for 10 h and gradually cooled during furnace cooling. According to Ref. [28], the highest calcined temperature TCal = 1073 K is the best heat treatment condition, at which condition the content ratio A:B:O is very close to 1:1:3.
The crystal structures of the samples were identified through x-ray diffraction (XRD) using an X’ pert Pro x-ray diffractometer with Cu Kα (λ = 1.5406 Å ) radiation at room temperature. The data were collected in the 2θ range of 20° – 120° with a step size of 0.01671° . The composition of the samples was analyzed by x-ray energy-dispersive spectra (EDS) at room temperature, using an INCA PentaFETx3 system, with an accelerating voltage of 20 kV. The magnetic field and temperature dependence of the specific magnetization, σ (H) and σ (T), of the powder samples were measured using a physical properties measurements system (PPMS, Quantum Design Corporation, USA). We defined the temperature at which the dσ /dT reached its minimum value as the Curie temperature (TC). The Curie temperatures of the samples were measured under an applied magnetic field 0.05 T.
Figure 1(a) shows the x-ray diffraction patterns for the La0.7Sr0.1AgxMnO3− δ samples, which are similar to those of self-doped manganites reported by our group, [23– 26] indicate that the samples have two phases with the rhombohedral perovskite, 
Using the X’ Pert HighScore Plus software, we calculated the volume averaged crystallite diameters, D, of the samples using the Scherrer equation, and found the diameters of 39, 78, 77, 53, and 54 nm, corresponding to x = 0.00, 0.025, 0.05, 0.075, and 0.10, respectively.
Table 1 shows the phase analysis data for the La0.7Sr0.1AgxMnO3− δ samples, obtained by fitting the XRD spectra. In this way, we obtained the zeroth-order approximation of the cell volume VC of the perovskite phase in the samples.
| Table 1. The XRD main peak areas (AP and AM) of the perovskite phase and Mn3O4 phase in the samples with the nominal composition La0.7Sr0.1AgxMnO3− δ ; the molar content y of Mn in Mn3O4 phase, calculated from the XRD main peak area ratios AM/AP; cell volume VC, parameter cM. |
Quantitative analyses of the two phases were performed using the main diffraction peak area ratios (see Table 1) obtained using the X’ Pert HighScore Plus software.[23– 26] We use the symbol “ u” to designate the mass ratio of the Mn3O4 phase to the perovskite phase. According to XRD theory we then have

where WM and WP denote the masses of the Mn3O4 phase and the perovskite phase; AM and AP are the main diffraction peak areas of the Mn3O4 phase and perovskite phase; KM and KP are the RIR values of the Mn3O4 phase and the perovskite phase La0.7Sr0.3MnO3. The RIR values are taken from the ICDD (International Centre for Diffraction Data) standard cards 01-080-0382 and 01-089-4461. In other words, they each represent the ratio of the main diffraction peak area of the compound in question to that of α -Al2O3 when the mass ratio is 1:1. Consequently, the values of KM and KP are 2.79 and 5.44 respectively. Because the composition and density of the perovskite phase in our samples are different from those of pure La0.7Sr0.3MnO3, the value of KP used in this expression should be taken as inversely proportional to the density of the samples. Equation (1) can then be rewritten as

where mp is the molar mass of the perovskite phase, and VC is the zeroth-order approximation to the cell volume of the perovskite phase, expressed in units of grams (g) and Å 3, respectively. d0 = 6.447 is the density of La0.7Sr0.3MnO3. Z gives the number of ABO3 formula units in each cell in the perovskite phase. Because our samples have rhombohedral structure, Z = 6. Setting

and then, from Eqs. (2) and (3), we have

According to the thermal equilibrium theory of crystal defects, [16, 23– 26] for the perovskite phase, because the available volume of the B site is smaller than that of the A site, the ions should first occupy the A sites during heat treatment, i.e. if there are vacancies in the perovskite phase, vacancies should be at the B sites. In these self-doped manganites, the sum of the numbers of La and Sr ions is less than that for Mn, and the ratio of the number of lattice points at the A, B, and O sites in the normal perovskite structure is 1:1:3, resulting in a part of the Mn ions being required to enter into A sites of the perovskite phase in the form of Mn2+ ions, while another portion of the Mn ions escaped from the perovskite phase and formed a second Mn3O4 phase. The reason for this phenomenon may be that the effective radius of Mn2+ ion is far smaller than the average effective radius of both La3+ and Sr2+ ions. In the case of the A sites of the ABO3 structure with coordination number 12, the effective radius of the Mn2+ ion is 0.113 nm. La3+ and Sr2+ ions, on the other hand, have radii of 0.136 nm and 0.144 nm, respectively.[23]
We designate the molar number of Mn cations by y in the Mn3O4 phase per mole of sample. Then 1 − y moles of Mn enter into the perovskite phase. We set MI to be the total number of moles of Mn ions in the perovskite phase per mole of sample with the nominal composition La0.7Sr0.1AgxMnO3− δ . Then we have

The molar content of the perovskite phase is then (0.7 + 0.1 + x + MI)/2 = (0.8 + x + MI)/2, and the molar content of the oxygen is 3(0.8 + x + MI)/2. The masses of the Mn3O4 and the perovskite phases per mole of sample are 228.82y/3 and (0.8 + x + MI)mp/2, respectively. We then have

Substituting Eq. (6) into Eq. (4), we have

Substituting Eq. (5) into Eq. (7), we have

We note that the second ionization energy (21.49 eV) of Ag is close to the third ionization energy of La (19.18 eV). Therefore, we consider that Ag ions in the A sites of the perovskite phase are in the form of Ag2+ ions.
For our powder samples sintered at 1073 K, we assume on the basis of the thermal equilibrium theory of crystal defects, [23– 26] that there were no vacancies in the A sites of the perovskite phase of the samples and that the missing cations at the A sites were filled by Mn2+ ions. Assuming that the perovskite phase in all the samples had the standard ABO3 structure, we can calculate the ion content ratios at the A, B, and O sites in the perovskite phase. Accordingly, we assume that there are La3+ , Sr2+ , Ag2+ , and Mn2+ ions at the A sites of the perovskite phase and that there are Mn3+ and Mn4+ ions at the B sites.
For notational convenience, we represent the molar amounts of La3+ , Sr2+ , Ag2+ , Mn2+ , Mn3+ , Mn4+ , and O2− in the perovskite phase by L, S, A2, M2, M3, M4, and O2, respectively. Thus we have

Since the molar fraction of the lattice points at the A sites is equal to that of the B sites,

Furthermore, the number of O2− ions is three times the number of cations at the A sites, giving

Upon balancing valences


Substituting Eq. (13) into Eqs. (10) and (11), we have


Substituting Eqs. (13) and (14) into Eq. (12)

Finally, from Eqs. (15) and (16), we have


Therefore, for the perovskite phase and Mn3O4 phase in our samples, the system can be written as 
The contents of the various ions were calculated using L = 0.7 and S = 0.1, as shown in Table 2. In Table 2, RM4 representing the Mn4+ ion content ratio at the B sites of the ABO3 structure, is defined by

For convenience of interpretation, we also show, in Table 3, the same ion contents normalized so that the O2− content is 3, which is appropriate for the standard ABO3 structure. Consequently, the standard ABO3 structure can be written as (La0.7Sr0.1AgxMn1− y)2/(1.8+ x− y)O3. We can see that, as shown in Table 3, the content of Mn4+ ions increases with increasing doping level x.
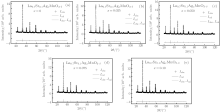
Using directly the contents of the various ions as given in Table 3, the XRD diffraction data were fitted using the Rietveld powder diffraction profile fitting technique. The results are shown in Fig. 2 and Table 4. In Fig. 2, “ + ” represents the experimental data. Solid lines depict the fitted data. The bottom lines show the difference between the experimental and fitted data.
It may be seen from Table 4 that the final fitting parameters, goodness of fit indicator s, profile factor Rp and weighted profile factor Rwp are satisfactory, indicating that the contents of the various ions calculated by the above method are reasonable.
From Table 4, it may be seen that the lattice parameters a and c, the cell volume V, the Mn– O bond length, d, and the Mn– O– Mn bond angle, θ , do not change in any significant way.
From the fitted results, we can also obtain the percentages of the Mn3O4 phase (W2 (%)) and the perovskite phase (W1 (%)). Note that the content of the Mn3O4 phase decreases with increasing doping level x (except for x = 0.025).
| Table 2. The molar contents L, S, A2, M2, M3, M4, and O2 of La3+ , Sr2+ , Ag2+ , Mn2+ , Mn3+ , Mn4+ , and O2− ions in the perovskite phase per mole of sample, and the Mn4+ ion content ratio, RM4, at the B sites. |
| Table 3. The molar contents L, S, A2, M2, M3, M4, and O2 of La3+ , Sr2+ , Ag2+ , Mn2+ , Mn3+ , Mn4+ , and O2− ions, and molar mass mP of the perovskite phase when the contents of the O2− ions are normalized to 3. |
| Table 4. Rietveld fitted results of the XRD diffraction patterns for the samples, where Rp, Rwp, and s are the profile factor, weighted profile factor, and goodness of fit indicator, respectively; a and c are the lattice parameters; V, d, and θ are the cell volume, Mn– O bond length and the Mn– O– Mn bond angle of the perovskite phase, respectively. The atomic coordinates at A, B, and O sites are (0, 0, 0.25), (0, 0, 0), and (xO, 0, 0.25), respectively. |
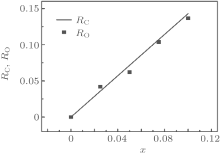
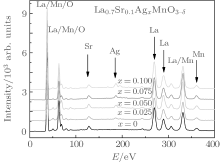
X-ray energy-dispersive spectra (EDS) were used to study the elemental content ratios of the La0.7Sr0.1AgxMnO3− δ samples. The element Ag was detected clearly in the EDS patterns, as shown in Fig. 3 and Table 5. Here, RO and RC are the atomic concentration ratios of Ag to La, obtained using EDS and calculated using the nominal composition, respectively. Figure 4 shows the dependences of the RO and RC on the Ag doping level x. It can be seen from Fig. 4 that RO is very close to RC, which indicates that the Ag ions are doped into the perovskite phase.
 | Fig. 4. Curves of the atomic concentration ratio of Ag to La, obtained using EDS (points) and calculated (line) using the nominal composition. |
| Table 5. Contents of various ions in La0.7Sr0.1AgxMnO3− δ measured using EDS. RO and RC are the measured and calculated atomic concentration ratios of Ag to La. |
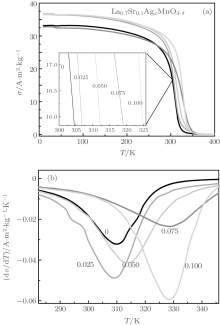
Figure 5 shows the curves for the specific magnetization of the samples versus the applied field, measured at 10 K and 300 K. We can see that the coercivity is very small. The specific saturation magnetizations at 10 K show no significant variations. However, the specific saturation magnetizations at 300 K increase from 32.0 A· m2/kg when x = 0.00 to 46.8 A· m2/kg when x = 0.10. Figure 6(a) shows curves of the specific magnetization, σ , versus temperature, T. Figure 6(b) shows curves of dσ /dT versus T. According to Fig. 6(b), the absolute value of dσ /dT reaches its maximum value when T = TC. We define the temperature TC as the Curie temperature. It can be seen from Fig. 6(b) that the Curie temperature of samples increases from 310 K when x = 0.00 to 328 K when x = 0.10, which is the reason why the specific saturation magnetizations at 300 K increase from 32.0 A· m2/kg when x = 0.00 to 46.8 A· m2/kg when x = 0.10.
 | Fig. 5. Curves of the specific magnetization σ of the samples of La0.7Sr0.1AgxMnO3− δ versus the applied field, measured at 10 K (a) and 300 K (b). |
Combining with Table 3, we can see that the content of La3+ ions at the A sites gradually decreases, the total content of Sr2+ , Mn2+ , and Ag2+ increases, and the content of Mn4+ ions at the B sites also gradually increases, with increasing Ag-doping level x. Therefore the variation of the Curie temperature of the Ag-doped samples versus the Mn4+ ion content is similar to that found in previous studies of La1− xSrxMnO3, which can be explained using the double exchange interaction theory.[1, 29]
 | Fig. 6. Curves of the specific magnetization σ of the samples La0.7Sr0.1AgxMnO3− δ versus temperature at an applied field of 0.05 T (a) and curves of dσ /dT versus temperature (b). |
In particular, it should be noted that the atomic concentration ratios of La, Sr, and Mn in our five samples remained essentially the same while the Ag concentration changed. As a result, if there were no Ag cations in the perovskite phase, there should be no significant variation in the magnetic properties. Therefore, the variations of the specific saturation magnetization at 300 K and the Curie temperature suggest that Ag cations have been doped into the A sites of perovskite phase in our samples.
We have successfully prepared perovskite manganite samples with nominal composition La0.7Sr0.1AgxMnO3− δ (0.00 ≤ x ≤ 0.10) using the sol– gel method. In the thermal treatment process, the method of increasing the temperature was improved by increasing the temperature in steps of 50 K, from 473 K to 773 K, with 30 min spent at each step, rather than directly increasing the temperature in one step. X-ray energy dispersive spectra showed that the observed atomic concentration ratios of Ag and La were very close to the nominal atomic concentration ratios. As increasing Ag-doping level x, there are the increasing tendencies for both of the specific saturation magnetizations at 300 K and the Curie temperature of the samples. Especially, the specific saturation magnetization of the sample with x = 0.10 is distinctly higher than that of the sample with x = 0.00 at 300 K, while the Curie temperature of the sample with x = 0.10 is distinctly higher than that of the sample with x = 0.00.
Because the atomic concentration ratios of La, Sr, and Mn in the five samples were all essentially the same and only the Ag content changed, the variation of the specific saturation magnetizations at 300 K and the Curie temperatures suggest that Ag cations have been doped into the A sites of perovskite phase in our samples.
The authors wish to thank Dr. Norm Davison for helpful discussion.
| 1 |
|
| 2 |
|
| 3 |
|
| 4 |
|
| 5 |
|
| 6 |
|
| 7 |
|
| 8 |
|
| 9 |
|
| 10 |
|
| 11 |
|
| 12 |
|
| 13 |
|
| 14 |
|
| 15 |
|
| 16 |
|
| 17 |
|
| 18 |
|
| 19 |
|
| 20 |
|
| 21 |
|
| 22 |
|
| 23 |
|
| 24 |
|
| 25 |
|
| 26 |
|
| 27 |
|
| 28 |
|
| 29 |
|


