Spin excitation spectra of spin–orbit coupled bosons in an optical lattice

Spin excitation spectra of spin–orbit coupled bosons in an optical lattice |
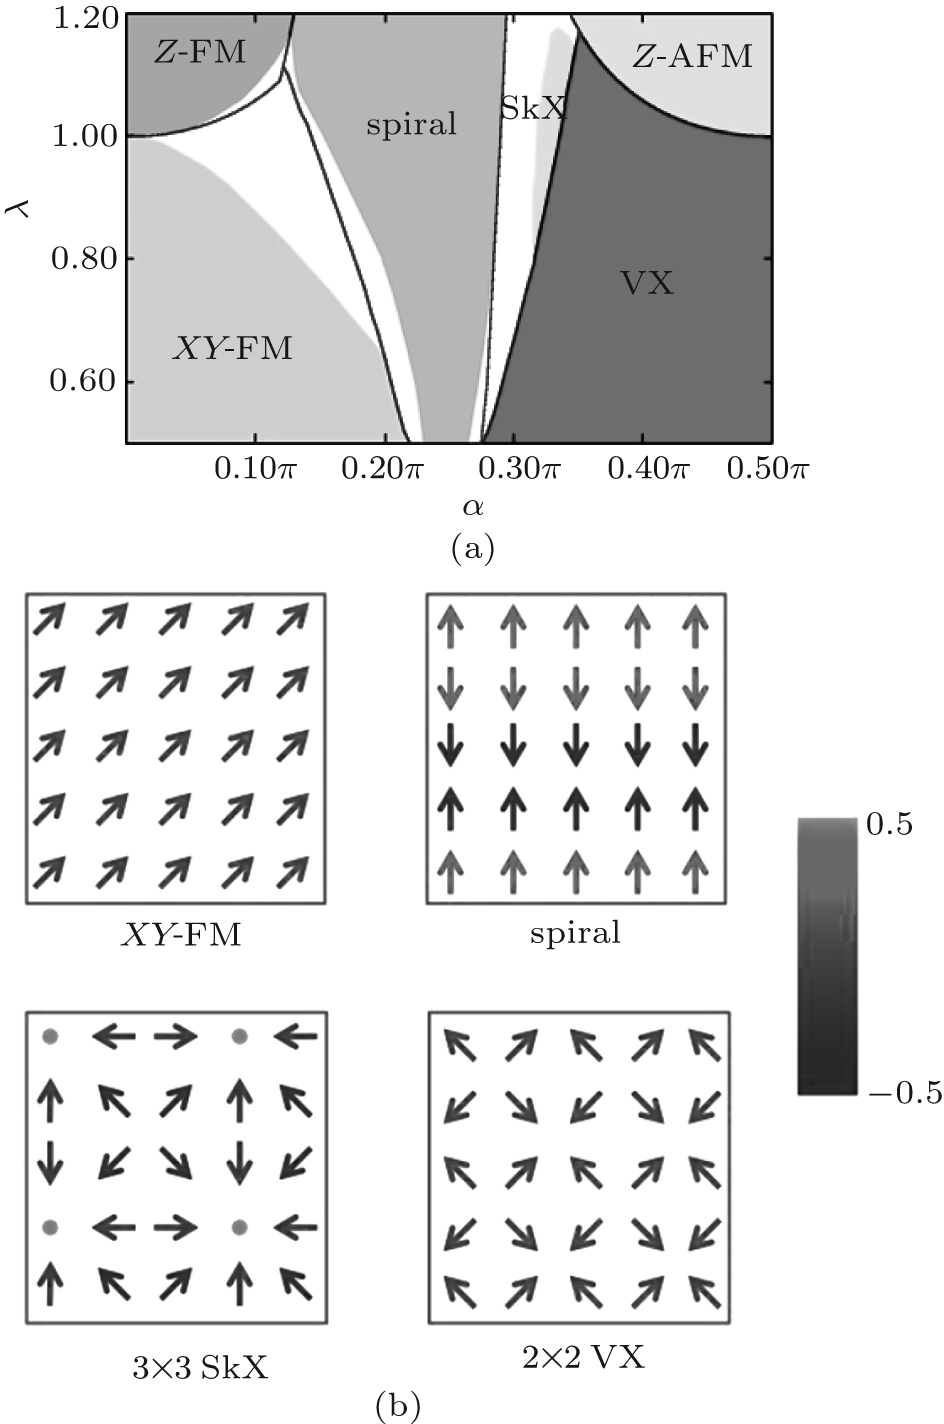
| (a) Phase diagram in the Mott insulating regime. The solid lines are the mean-field results. The filled areas with colors are the stable regions, while the white areas are the unstable ones under the spin-wave fluctuations. (b) Spin configurations of the XY -FM, commensurate 4×1 spiral spin, 3×3 SkX, and 2×2 VX phases. |
 |