Structure and chemical valence study of Sr n+1Ru nO3 n+1 ( n = 1, 2, ∞) series

Structure and chemical valence study of Sr n+1Ru nO3 n+1 ( n = 1, 2, ∞) series |
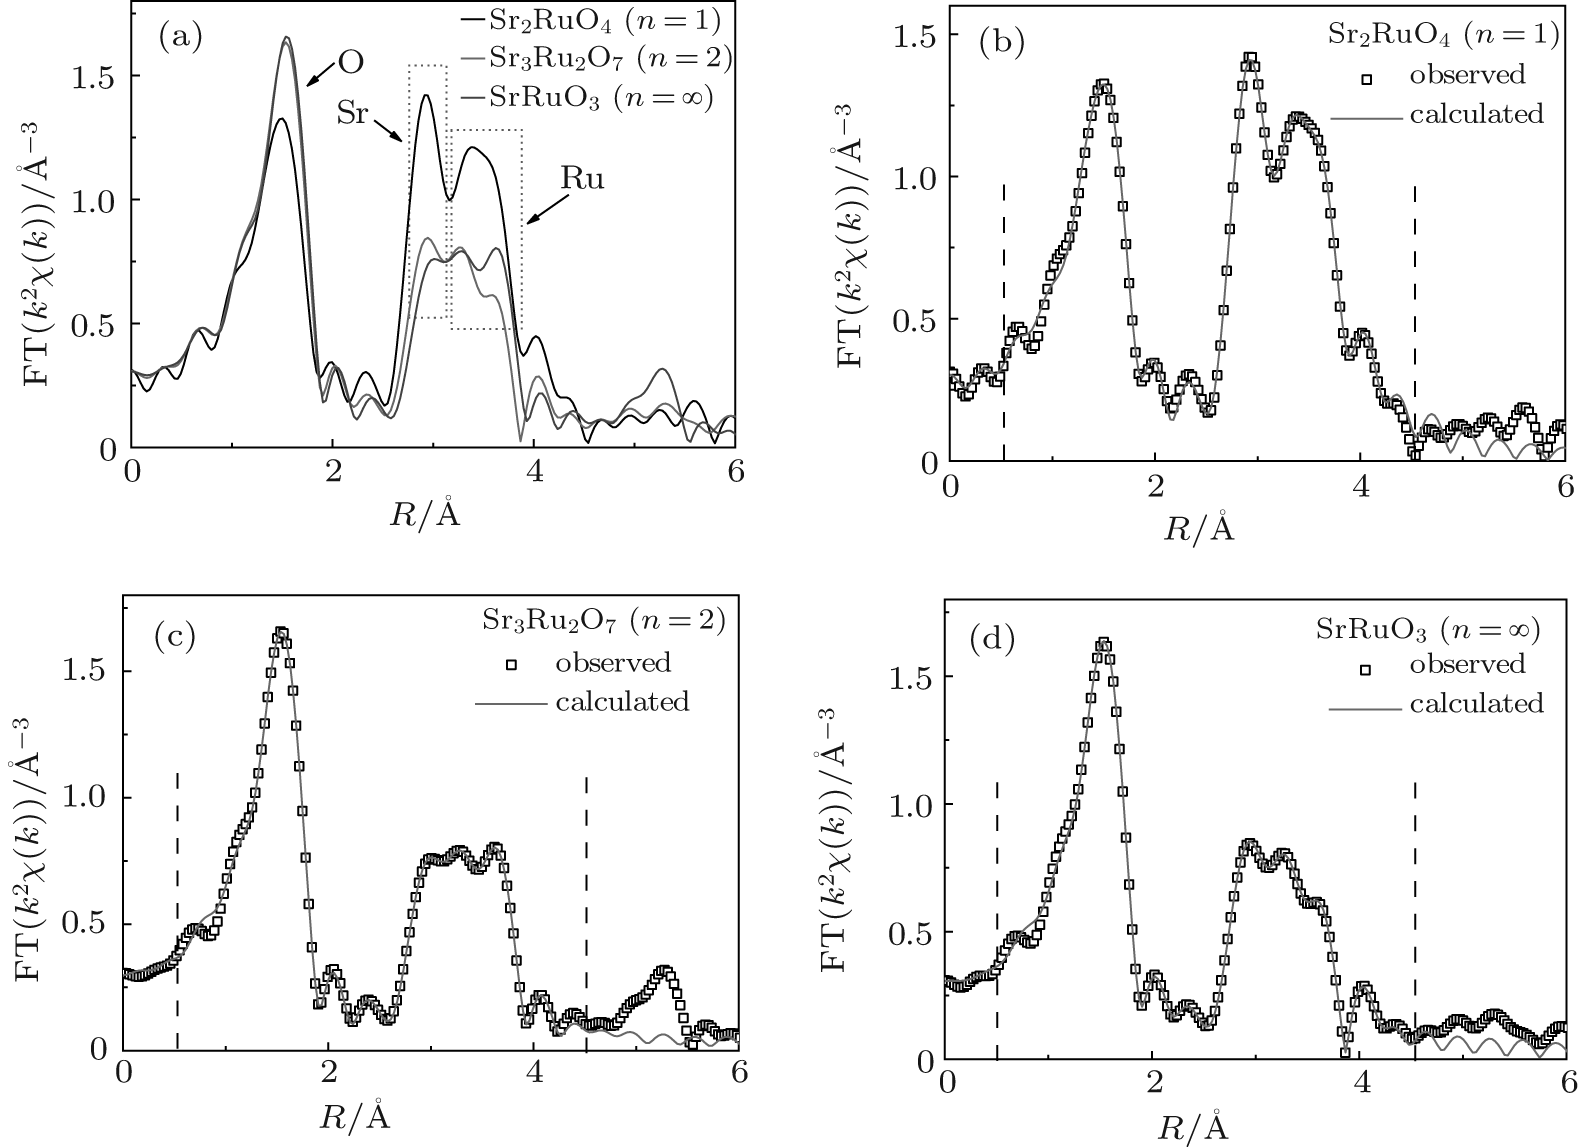
| (a) Fourier transformed spectra from EXAFS data of Sr n +1Ru n O3 n +1 ( n = 1, 2, ∞) at the Ru K-edge. Insert shows the detailed difference of samples. Atoms corresponding to each peak are marked. (b)–(d) Comparison between the Fourier transformed EXAFS spectra and the fitted curves. The ranges between the two vertical dash lines are the fitting ranges. |
 |