Comparison of performance between rescaled range analysis and rescaled variance analysis in detecting abrupt dynamic change
He Wen-Pinga)†  , Liu Qun-Qun
b) , Jiang Yun-Dia) , Lu Yingc)
, Liu Qun-Qun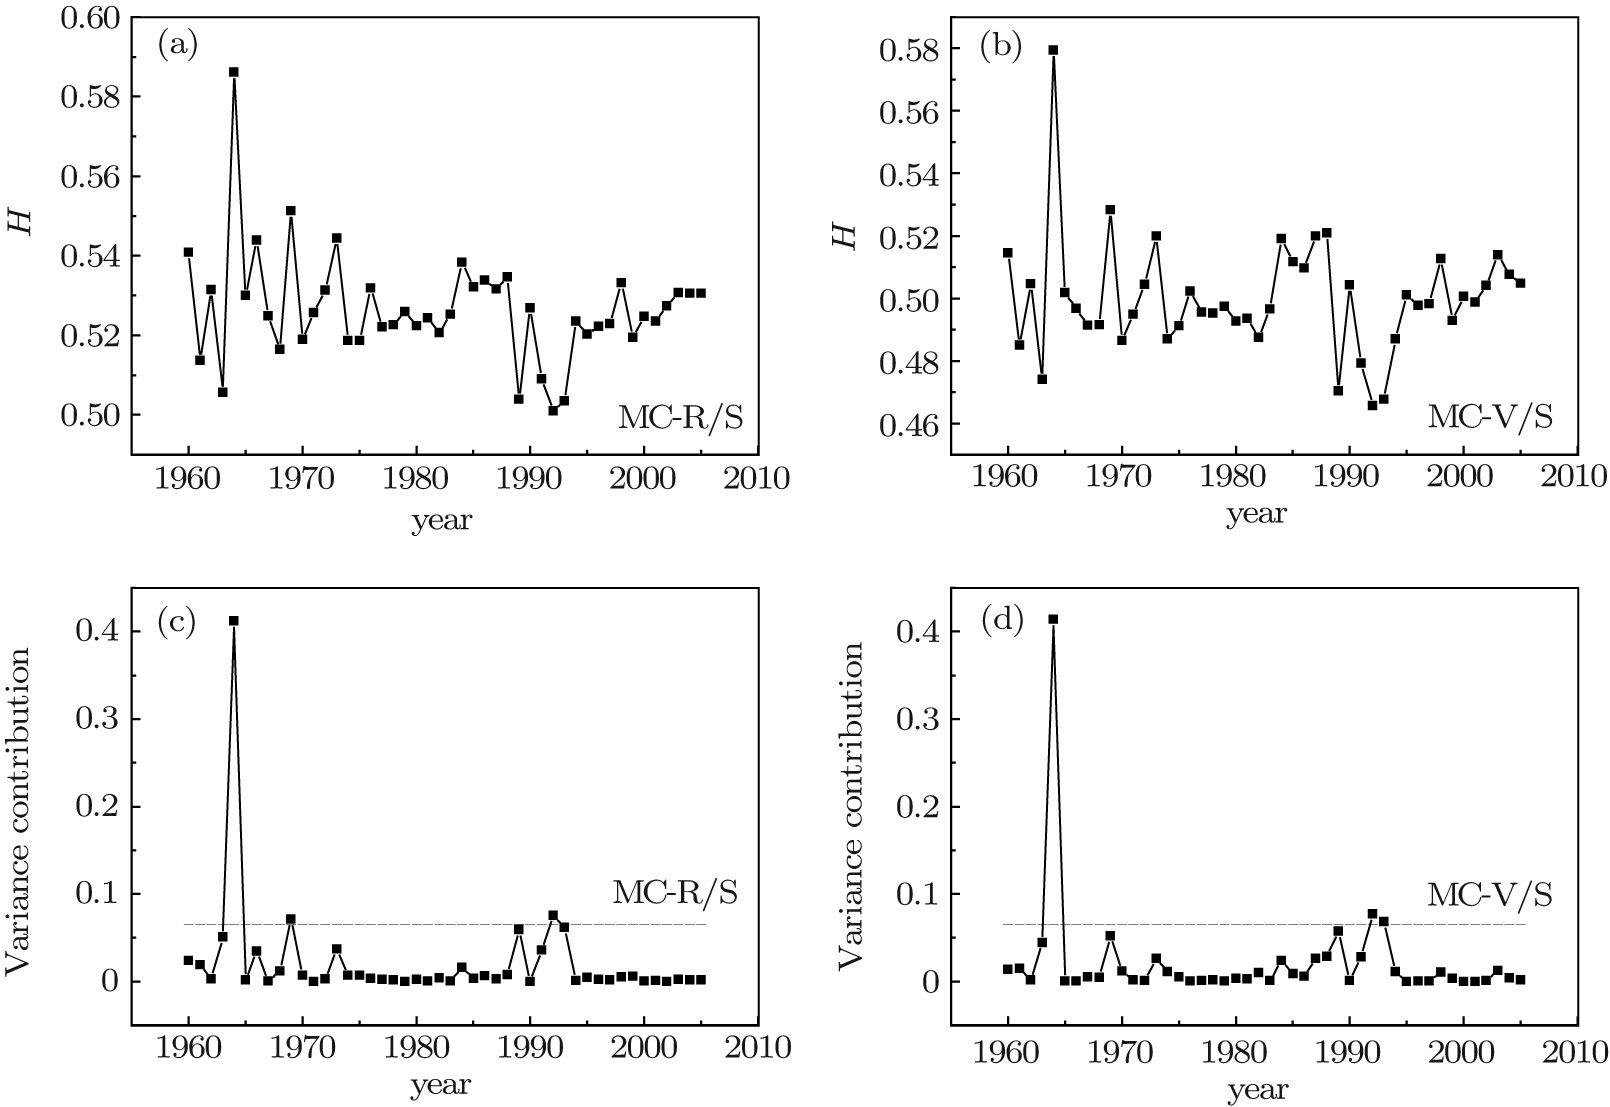
Comparison of performance between rescaled range analysis and rescaled variance analysis in detecting abrupt dynamic change |
|
He Wen-Ping
, Liu Qun-Qun |
| The MC-R/S and MC-V/S results of Hurst exponents for daily surface air pressure records for the period from January 1, 1960 to December 31, 2006 at the Huma meteorological station in China, and the variance contribution analysis of the Hurst exponents with a one-year subseries length. Panel (a) shows the MC-R/S results, panel (b) the MC-V/S results, panel (c) the variance contribution analysis of the MC-R/S results, and panel (d) is the same as panel (c) but for the MC-V/S results. The dashed line represents the tripled average variance contribution of the Hurst exponent series. |
| |