Comparison of performance between rescaled range analysis and rescaled variance analysis in detecting abrupt dynamic change

Comparison of performance between rescaled range analysis and rescaled variance analysis in detecting abrupt dynamic change |
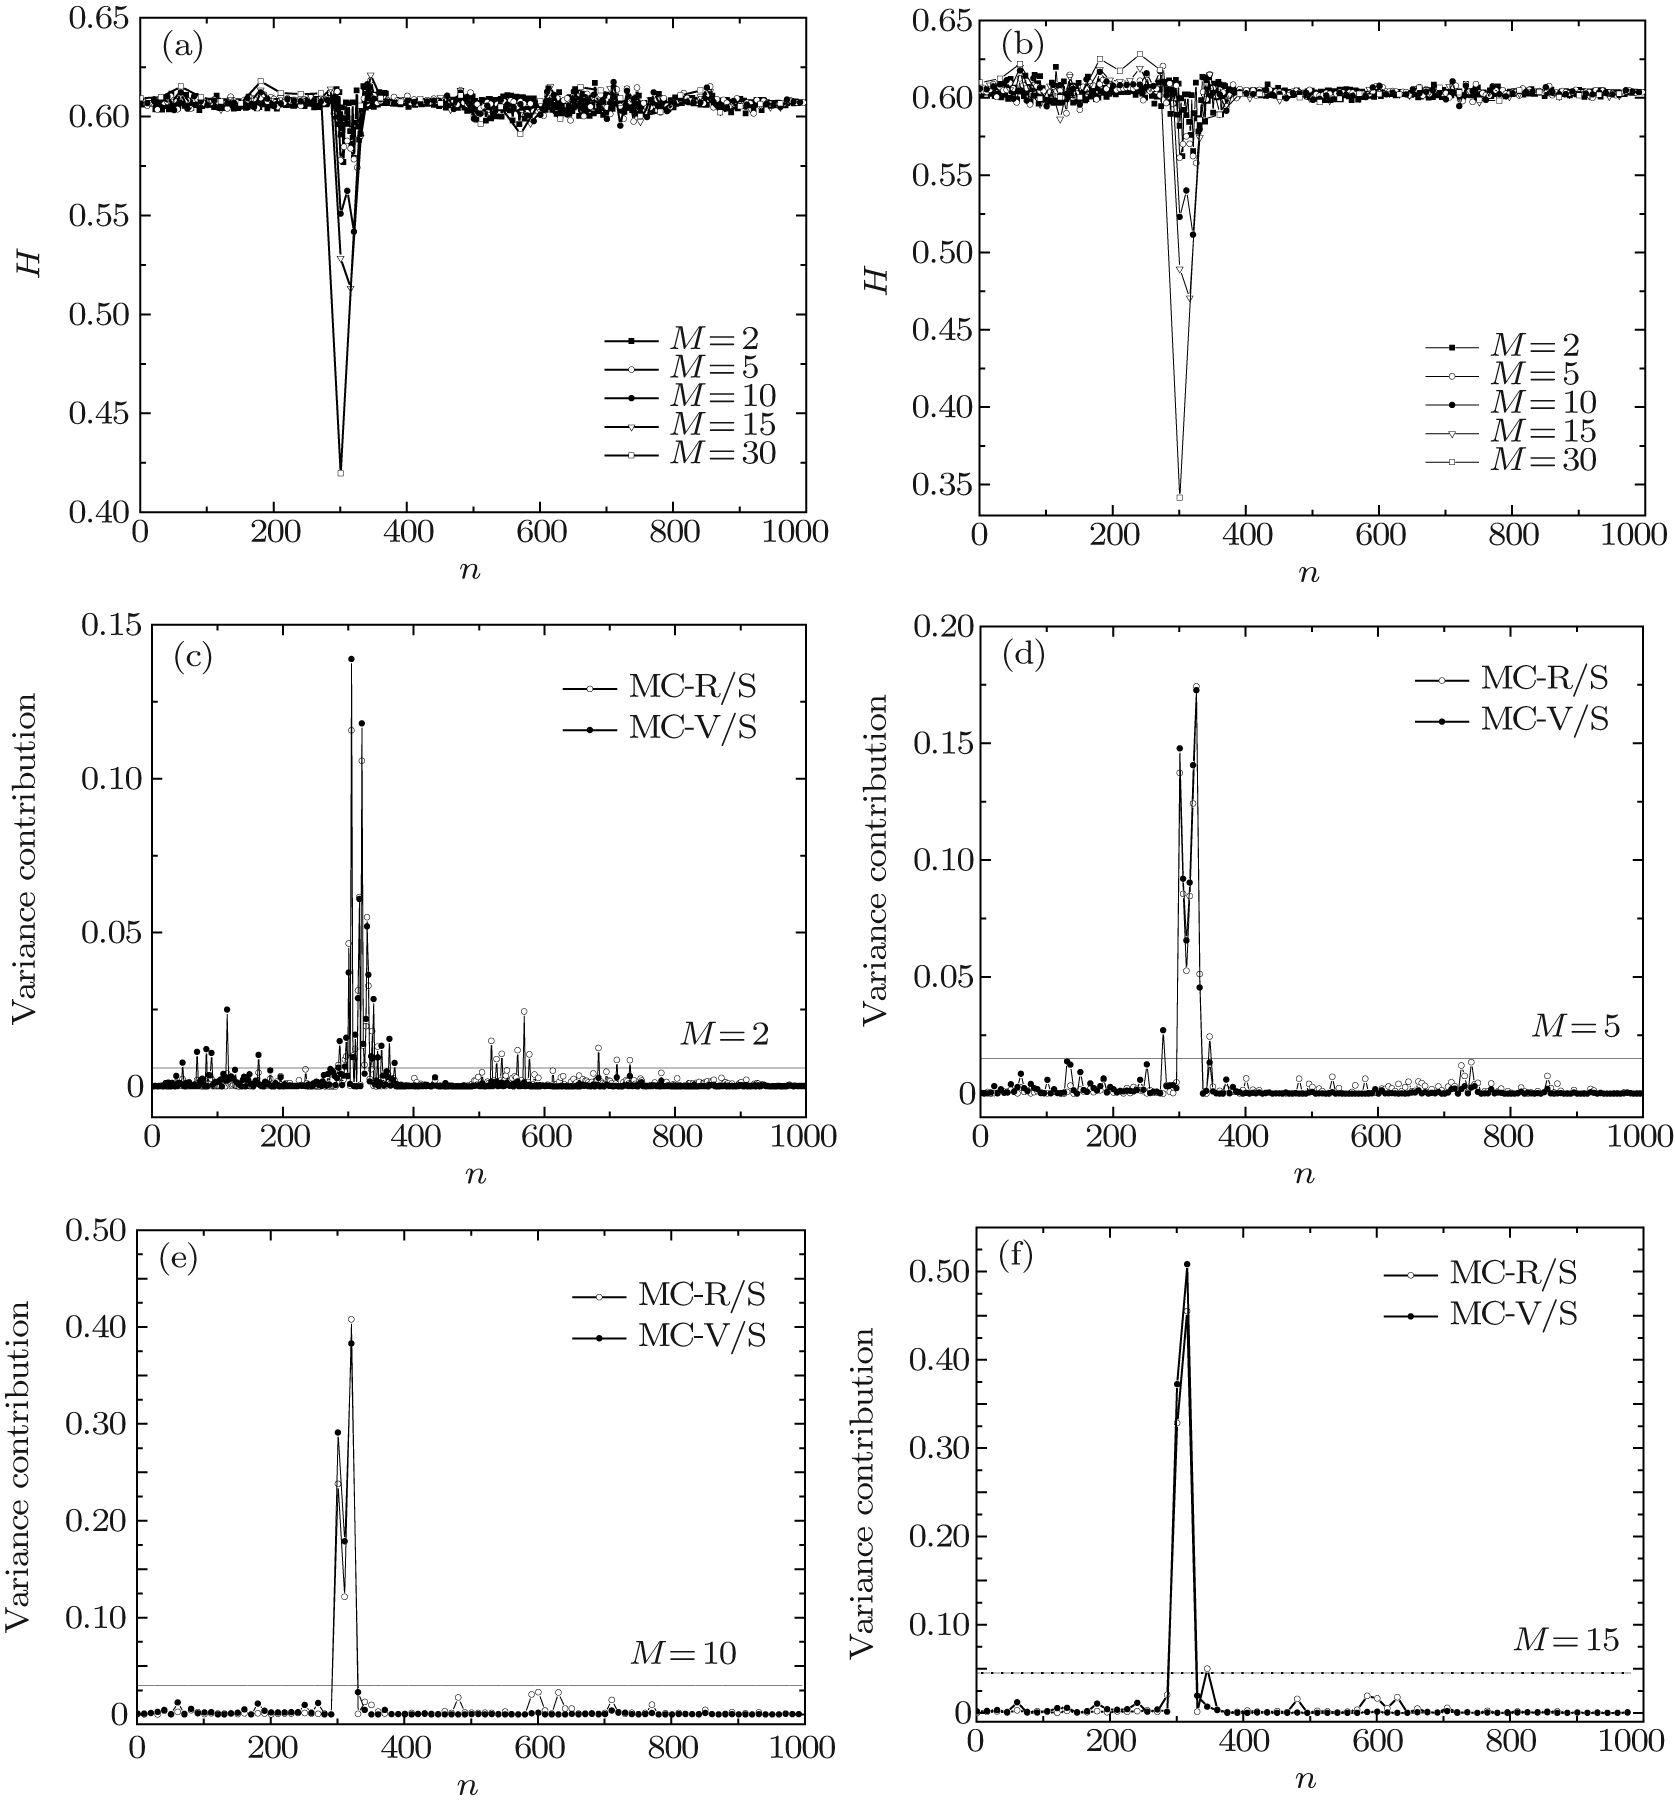
| MC-R/S and MC-V/S results for artificial time series and variance contributions of Hurst exponents. The results of (a) MC-R/S and (b) MC-V/S under different window scales, including M = 2, 5, 10, 15, and 30; variance contributions for detection results using MC-R/S (denoted by empty circles) and MC-V/S (denoted by solid circles), with window sizes M = 2 (c), 5 (d), 10 (e), and 15 (f). The dashed line represents the tripled average variance contribution of the Hurst exponent series. |
 |