†Corresponding author. E-mail: lin.ma.wf@gmail.com
A high-sensitivity curvature sensor based on an up-taper-core-offset structure is proposed and demonstrated in this paper. Here two specially designed cascaded up-tapers with maximum diameters of 247 μm and 251 μm, respectively, are used as a cladding mode exciting component. The excited cladding modes will propagate in the cladding and re-couplers with the core mode at the core-offset jointing point. When the curvature is changed, the dip wavelength of the sensor will shift to a blue wavelength and an average curvature sensitivity of more than –12.5 nm/m‒1 is achieved within the measured curvature intervals.
Curvature is an important parameter and should be carefully monitored in real-time in some areas, such as smart structures, weighing treatment, and other precise instruments. All-fiber sensors have aroused tremendous research interest because of their high sensitivity, easy fabrication, low cost, immunity to electromagnetism, and capability to measure various parameters.[1– 11] There have been many fiber curvature sensors reported in recent years. Gong et al. fabricated an all-fiber curvature sensor based on multimode interference.[1] The structure of this sensor is very simple. However, the curvature sensitivity is not very high: only – 0.91 nm/m– 1 in the range of small curvature and – 10.38 nm/m– 1 in the range of large curvature. In addition, its curvature response is not linear, which restricts the application of this kind of sensor. Gouveia et al. reported a fiber Bragg grating (FBG)– based temperature-independent curvature sensor.[6] With this sensor the curvature change is observed by monitoring the ratio between the recoupled cladding mode power and the reflected core mode power. The sensitivity of this sensor is not high either. Gong et al. proposed a curvature sensor based on hollow-core photonic crystal fiber Sagnac interferometer.[12] This kind of sensor is very interesting. However, the fabrication is very complex and needs a special fiber. What is more, the sensitivity is very low: only 0.232 nm/m– 1 as reported. There are some other curvature sensors based on an FBG and single-mode– multi-mode– single-mode (SMS) structure.[1, 13– 15] However, these kinds of sensors are only suitable for relatively large curvature measurement.
In this paper, we propose and demonstrate a new type of fiber curvature sensor based on modal interference (MI). The MI effect can be used to fabricate refractive index sensor, pressure senor, and curvature sensor.[16, 17] However, the reported curvature sensitivity is very low: only about 0.6 nm/m− 1. In this paper, the MI is formed by using two cascaded up-tapers and a core-offset jointing point, which can be called an up-taper-core-offset structure. Here the two cascaded up-tapers are used as a cladding mode exciting component and the core-offset jointing point inserted in the sensor is used as a re-coupling component. The spatial frequency spectrum analysis shows that only one high-order cladding mode is strongly excited and interfered with the fundamental mode. Experimental results show that this kind of fiber sensor is very sensitive to curvature change. The transmission dips exhibit a linear blue wavelength shift with the increasing bending curvature, and the measured curvature sensitivity is more than − 12.5 nm/m– 1 within the measured curvature range.
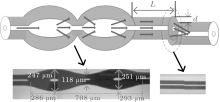
Figure 1 shows a schematic diagram of the up-taper-core-offset structure sensor. It can be seen from Fig. 1 that the sensor contains two cascaded up-tapers, a core-offset jointing point, and an optical fiber between the up-tapers and the core-offset jointing point. All of the fibers used in this experiment are standard telecommunication single-mode optical fibers (SMF-28, Corning, Inc.) with a core/cladding diameter of 8.3/125 μ m. The up-taper is fabricated by using a fiber fusion splicer with altered “ SMF splicing program” . The parameter “ overlap” in the original program is changed to a maximum value of 49.9 μ m. However, the overlap value is not enough to fabricate the up-taper, so we need to splice the SMF many times until a satisfactory up-taper is achieved. An image of the up-taper that we fabricated is shown in Fig. 1. The maximum diameters of the two cascaded up-tapers are 247 μ m and 251 μ m, respectively. Here the up-tapers are used to excite the cladding modes and make the light propagate in the cladding. In order to make the light couple back into the core, a core-offset jointing point is fabricated behind the cascaded up-tapers. The core-offset distance of the jointing point is 8 μ m and the fiber length L between the up-taper and core-offset jointing point is 101.3 mm.
As shown by the arrows in Fig. 1, the light launches into the sensor from the left hand, and transmits through the cascaded up-tapers and the core-offset jointing point. When the light in the core propagates into the cascaded up-tapers, part of the light will couple into the cladding and excite some cladding modes, which will propagate in the cladding. After both the light in the core mode and the cladding modes propagate through a certain length of fiber to the core-offset jointing point, the light in the cladding modes will re-couple back to the core and interfere with the light in the core mode. There will be transmission peaks and dips in the output spectrum due to the accumulated phase difference between the core mode and cladding modes. Here we should point out that the two cascaded up-tapers are used to excite the cladding mode instead of a single up-taper. This happens mainly because the cascaded up-tapers are more effective for exciting the cladding modes than single up-taper. By taking the fast Fourier transformation (FFT), we find that only the low-order cladding mode of the cascaded up-tapers is excited and mainly interferes with the core-mode. The output power of the sensor can be calculated by the following equation:[4, 18]

where Icore and 


Here δ i is the optical path difference, 


Here λ is the wavelength of the transmission dip, and k is a positive integer. When the bending curvature of the sensor is changed, there will be a change in the effective refractive indices of the core mode and cladding modes. As a result, the transmission dip wavelength of the sensor will also shift according to the effective refractive index change. The wavelength shift can be expressed as

Here 
A schematic diagram of the experiment setup is shown in Fig. 2. The up-taper-core-offset sensor is fixed in an adjusting frame by two fiber holders (FHs), as shown in Fig. 2.
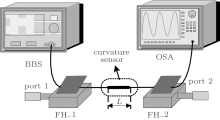 | Fig. 2. Experimental setup used to measure the curvature change. BBS: broad-band light source, OSA: optical spectrum analyzer, FH: fiber holder. |
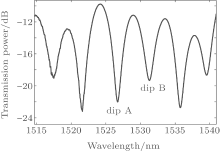
Here we used a broad-band light source (BBS) as an input signal. The input light is launched into the sensor from port 1, and the output spectrum is monitored by an optical spectrum analyzer (OSA), as shown in Fig. 2. Cladding modes are excited in the up-taper and interfere with the core mode at the core-offset jointing point. Figure 3 shows the output spectrum of the sensor without bending. Here we can see from Fig. 3 that there are transmission peaks and dips due to the phase difference between the core mode and cladding modes.
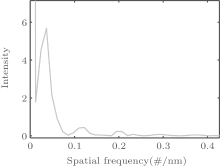
In order to analyze the number and power distribution of the interference mode, the transmission spectrum of the sensor is Fourier-transformed to obtain the spatial frequency spectrum.[18, 19] The result is shown in Fig. 4. Here the dominant intensity peak at zero relates to the core mode, and the multiple minor peaks at the other positions correspond to the cladding modes. There is only one prominent minor peak in Fig. 4 which means that there is only one cladding mode that is strongly excited and interferes with the core mode. In addition, there are some feeble peaks in the spatial frequency spectrum, which relate to other high-order cladding modes. These high-order cladding modes also interfere with the core mode and modify the envelope of the transmission spectrum slightly.
In order to study the curvature response of the sensor, we adjust the left fiber holder (FH_1) towards the right in the experiment. The curvature of the sensor will be increased with the moving of FH_1. The initial distance between the two fiber holders is 215 mm and the left FH_1 is adjusted for every 20 μ m with the total displacement of 460 μ m. The transmission spectra of the sensor under different bending curvatures are shown in Fig. 5. Here figures 5(a) and 5(c) show the dip wavelength shift tendencies of dip A and dip B. We can see from these two figures that the transmission dips of the sensor shift to a blue wavelength with the increasing curvature. The shift tendency is pointed out by the arrows marked in the figures. In addition, there is an obvious decrease in light intensity with the increasing curvature. This happens mainly because some cladding mode will become a radiation mode when there is a bending in the sensor, and the insertion loss will become larger as a result.
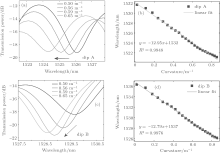 | Fig. 5. (a) and (c) Transmission spectra of dip A and dip B under different curvatures, and (b) and (d) the relationships between the wavelength shift and the curvature for dip A and dip B. |
The relationships between the wavelength shift and the curvature of dip A and dip B are shown in Figs. 5(b) and 5(d), respectively. The total displacement of the fiber holder is 460 μ m, with the curvature ranging from 0 m− 1 to 0.85 m− 1. Here we can see from Figs. 5(b) and 5(d) that there is a linear relationship between the wavelength shift and the bending curvature of the sensor. The transmission dip wavelength shifts from 1531.7 nm to 1521.15 nm for dip A and shifts from 1536.3 nm to 1526.15 nm for dip B. The calculated wavelength shifts are 10.55 nm and 10.15 nm, respectively. The solid squares in Figs. 5(b) and 5(d) are the measured value, and the solid lines are the linear fitting lines. The regression equations of the fitting lines are indicated in these two figures. The slopes of the fitting line show the values of average curvature sensitivity of the sensor to be − 12.95 nm/m− 1 and − 12.79 nm/m− 1 for dip A and dip B, respectively. Here we can see that there is only a little difference in curvature sensitivity between dip A and dip B. This occurs mainly because the wavelengths of dip A and dip B are similar and the values of k (see in Eq. (6)) for dip A and dip B are also similar, which leads to similar sensitivities. In addition, the dip wavelength shift also shows a linear response under tiny curvature, which means that this kind of sensor is suited for tiny curvature change measurement.
Here the transmission spectrum is shifted towards short wavelengths. This occurs mainly because of the changes in the effective refractive index of the core mode and cladding modes. The effective refractive index in the place close to the inner side of fiber axis will decrease and the effective refractive index in the place close to the outer side will increase due to elasto-optical effect when the fiber is bent. As a result, the difference in refractive index between core mode and cladding modes 
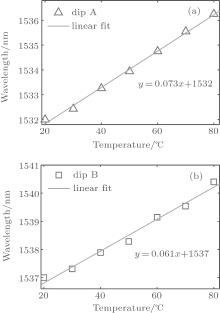
In addition, the temperature change will also influence the transmission spectrum of the sensor. In order to study the temperature effect, we place the sensor in a temperature control box to change its surrounding temperature. The temperature changes from 20 ° C to 80 ° C, and the temperature responses for dip A and dip B are shown in Fig. 6. Here we can see from Fig. 6 that the temperature response is only 0.073 nm/° C for dip A and it is 0.061 nm/° C for dip B, which is much smaller than the curvature response. So the temperature influence can be ignored in this experiment.
A new type of fiber curvature sensor based on an up-taper and a core-offset jointing point is proposed and experimentally demonstrated in this paper. Here two special designing cascaded up-tapers are used to excite the high order cladding modes and a core-offset jointing point with a core-offset distance of 8 μ m is inserted in the sensor to act as the interfere component. The experimental result shows that the proposed curvature sensor is very sensitive to curvature change and the measuring curvature sensitivity is more than − 12.5 nm/m− 1 for the selected transmission dips. In addition, the curvature sensor based on this novel structure is also suited to measure the curvature change under a tiny curvature, which makes it more practical for many applications.
| 1 |
|
| 2 |
|
| 3 |
|
| 4 |
|
| 5 |
|
| 6 |
|
| 7 |
|
| 8 |
|
| 9 |
|
| 10 |
|
| 11 |
|
| 12 |
|
| 13 |
|
| 14 |
|
| 15 |
|
| 16 |
|
| 17 |
|
| 18 |
|
| 19 |
|


