Investigation of electron localization in harmonic emission from asymmetric molecular ion*
[Zhang Cai-Ping, Miao Xiang-Yang† ]
]
]
|
|


†Corresponding author. E-mail: sxxymiao@126.com
*Project supported by the National Natural Science Foundation of China (Grant No. 11404204), the Key Project of Chinese Ministry of Education (Grant No. 211025), the Research Fund for the Doctoral Program of Higher Education of China (Grant No. 20111404120004), the Natural Science Foundation for Young Scientists of Shanxi Province, China (Grant No. 2009021005), and the Innovation Project for Postgraduates of Shanxi Province, China (Grant No. 20133081).
We theoretically investigate the electron localization around two nuclei in harmonic emission from asymmetric molecular ion. The results show that the ionization process of electron localized around one nucleus competes with its transfer process to the other nucleus. By increasing the initial vibrational level, more electrons localized around the nucleus D+ tend to transfer to the nucleus He2+ so that the ionizations of electrons localized around the nucleus He2+ increase. In this case, the difference in harmonic efficiency between HeH2+ and HeD2+ decreases while the difference in harmonic spectral structure increases. The evident minimum can be observed in the harmonic spectrum of HeH2+ compared with that in the spectral structure of HeD2+, which is due to the strong interference of multiple recombination channels originating from two nuclei. Time-dependent nuclear probability density, electron-nuclear probability density, double-well model, and time-frequency maps are presented to explain the underlying mechanisms.
The dynamics of a molecule in a strong field has been a popular topic in recent years.[1] Many interesting phenomena, such as above-threshold dissociation and below-threshold dissociation, [2– 4] bond hardening and bond softening, [5, 6] high-order harmonic generation (HHG), [7– 9] and Coulomb explosion[10, 11] have been investigated. The HHG is the most attractive effect to be used to generate isolated attosecond pulses.[12] Its physical process can be well understood through the semiclassical three-step model:[13] tunneling, acceleration, and recombination. Due to its additional degrees of freedom and its more complicated structure, the HHG process of a molecule is different from that of an atom. With two nuclei, the ionized electrons can recombine with either the parent ion or the neighbor ion. In recent years, more attention has been paid to the HHG from a symmetric molecular ion. Yu et al.[14] have shown that the electron transfer in the two potential wells of 


Based on the numerous investigations about the molecular HHG from symmetric molecules, increasing attention has been paid to asymmetric molecules.[20– 22] As the simplest asymmetric molecule, HeH2+ has now been widely studied. Bian and Bandrauk[23– 25] have proposed that the laser-induced electron transfer plays an important role in harmonic emission from HeH2+ . Feng and Chu[26] have further shown that the excited effect is a general character of asymmetric molecules. Chen and Zhang[27] have revealed that the role of excited states of HeH2+ can be detected via the harmonic emission times. Lu et al.[28] have studied the electron localization of HeH2+ to isolate and enhance the molecular plateau by adjusting carrier-envelope phase. Moreover, with a longer mean lifetime of the first excited state for HeH2+ , [29] electrons can transit from the first excited state to the ground state (i.e., from the nucleus H+ to the nucleus He2+ in an intense laser field. Hence, the electrons can be ionized from and recombine into either the nucleus H+ or the nucleus He2+ . In other words, multiple recombination channels will contribute to the HHG from HeH2+ , and the detailed distinguishing of these channels has been presented in our previous study.[30] Additionally, the ionizations from different nuclei depend on the electron distribution. In this paper, we will research the electron localization in an harmonic emission by comparing the HHG from HeH2+ with that from HeD2+ at different vibrational states. The results show that ionization process at the lowest vibrational state mainly originates from electrons localized around the nucleus H+ (D+ ), and the harmonic intensity of HeH2+ is 1.3 orders of magnitude stronger than that of HeD2+ in a high-order harmonic region. However, with the increase of the initial vibrational level, the electron transfer from the nucleus D+ to the nucleus He2+ is prominently enhanced. For HeD2+ , considerable numbers of electrons localized around the nucleus He2+ can be ionized so that the difference in harmonic efficiency decreases at a higher vibrational state. Nevertheless, the difference in harmonic spectral structure increases. Due to the more intense interference of multiple recombination channels, an evident minimum can be observed in the HHG spectrum of HeH2+ .
The one-dimensional numerical simulation for asymmetric diatomic molecules HeH2+ and HeD2+ in a strong laser field has been performed by solving the non-Born– Oppenheimer time-dependent Schrö dinger equation (TDSE) via parallel computer code LZH-DICP.[30– 33] The initial state is prepared in a 2pσ state. Atomic units (a.u.) are used throughout this paper. The linear laser field is along with the molecular axis, and in the dipole approximation and the length gauge, the TDSE reads


where R and z are internuclear distance and electronic coordinate, respectively; μ n and μ e are the reduced mass of nuclei He2+ and H+ (D+ ), MHe and MH(D), respectively; CHe and CH(D) are the electric charges of the nuclei He2+ and H+ (D+ , respectively; zHe and zH(D) are the positions of the nuclei He2+ and H+ (D+ ); Vc and V(t) are the Coulomb potential and the interaction potential of HeH2+ with the laser pulse; and, E(t) is the electric field that is a seven-optical-cycle (o.c.) trapezoidal field with two cycles ramp on, three cycles constant and two cycles ramp off. In addition, 1 o.c. = 5.34 fs corresponds to the wavelength (1600 nm) of the laser pulse. To solve the TDSE above mentioned, we use the standard second-order split-operator method.[34– 36] To guarantee the calculation convergence, the grid ranges from 0 a.u. to 30 a.u. in the R direction and from − 100 a.u. to 100 a.u. in the z direction, with 299 and 999 points, respectively. The time step is set to be 0.1 a.u.
The HHG spectrum (PA(ω ) is obtained by the Fourier transform of the time-dependent dipole acceleration a(t),

The time-frequency distribution is displayed to provide more information about the harmonic emission from an asymmetric molecular ion[37]

where W (ω 0(t′ − t)) is the Morlet wavelet, which is expressed as

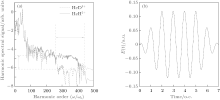
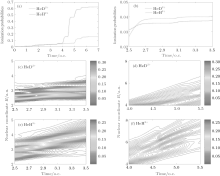
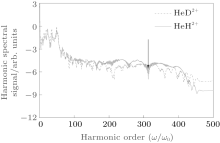
Figure 1(a) shows the harmonic spectra of HeH2+ (red solid line) and HeD2+ (blue dashed line) at the lowest vibrational state (v = 0) irradiated by a 1600-nm trapezoidal pulse with a peak intensity of 5 × 10¹⁴ W/cm2, as shown in Fig. 1(b). It can be seen that the HHG spectra share some similar characters: the harmonic intensity rapidly decays for the first few-order harmonics, which is followed by a modulating plateau. However, there is still an obvious difference. In the high-order harmonic region marked by the horizontal arrow, the harmonic efficiency of HeH2+ is nearly 1.3 orders of magnitude stronger than that of HeD2+ . It is known that the harmonic efficiency is sensitive to the ionization probability. To explain the enhancement phenomena above mentioned, the relevant time-dependent total ionization probabilities of HeH2+ (red solid line) and HeD2+ (blue dashed line) at ν = 0 presented in Fig. 2(a) are calculated by a flux operator and the “ virtual director” method.[38] The relevant time-dependent total ionization probability is expressed as

where jz is the flux operator, zs = 25 a.u. is the position for flux analysis, and Rs = 25 a.u. is the absorbing position in the present work. Clearly, the ionization probability of HeH2+ (62%) is much higher than that of HeD2+ (16%) at the end of laser pulse. However, the former is lower than the latter in a time range from t = 2.5 o.c. to t = 3.5 o.c. as shown in Fig. 2(b). To understand the difference in the ionization process between HeH2+ and HeD2+ , we investigate the relevant nuclear probability density distributions in different time ranges. As depicted in Figs. 2(c) and 2(e), the wave packets are almost localized in a smaller region (i.e., less than 4 a.u.) from t = 2.5 o.c. to t = 3.5 o.c. In this case, the electrons are difficult to ionize and nuclear wave packet probability density is a key factor in the ionization process. Since the nuclear probability density distribution of HeD2+ in Fig. 2(c) is much stronger than that of HeH2+ in Fig. 2(e), more electrons can be ionized from HeD2+ . As a result, the ionization probability of the former is higher than that of the latter. However, the nuclear wave packet probability density of HeH2+ in Fig. 2(f) is close to that of HeD2+ in Fig. 2(d) in a time range from t = 4.0 o.c. to t = 5.5 o.c. Moreover, the wave packets of HeH2+ can extend to a far larger internuclear distance. Taking these two factors into account, the ionization process of HeH2+ will be enhanced predominantly from t = 4.0 o.c. to t = 5.5 o.c. In short, the difference in harmonic efficiency between two ions at ν = 0 is probably ascribed to the intense ionization process in a time range from t = 4.0 o.c. to t = 5.5 o.c. With a longer lifetime of the first excited state for asymmetric molecular ion, the electron localization on different nuclei may play an important role in the harmonic emission process.[23– 25] Nevertheless, we cannot estimate the contributions of electrons around either nucleus to harmonic emission directly just according to the nuclear wave packet probability density. More detailed information is still desired.
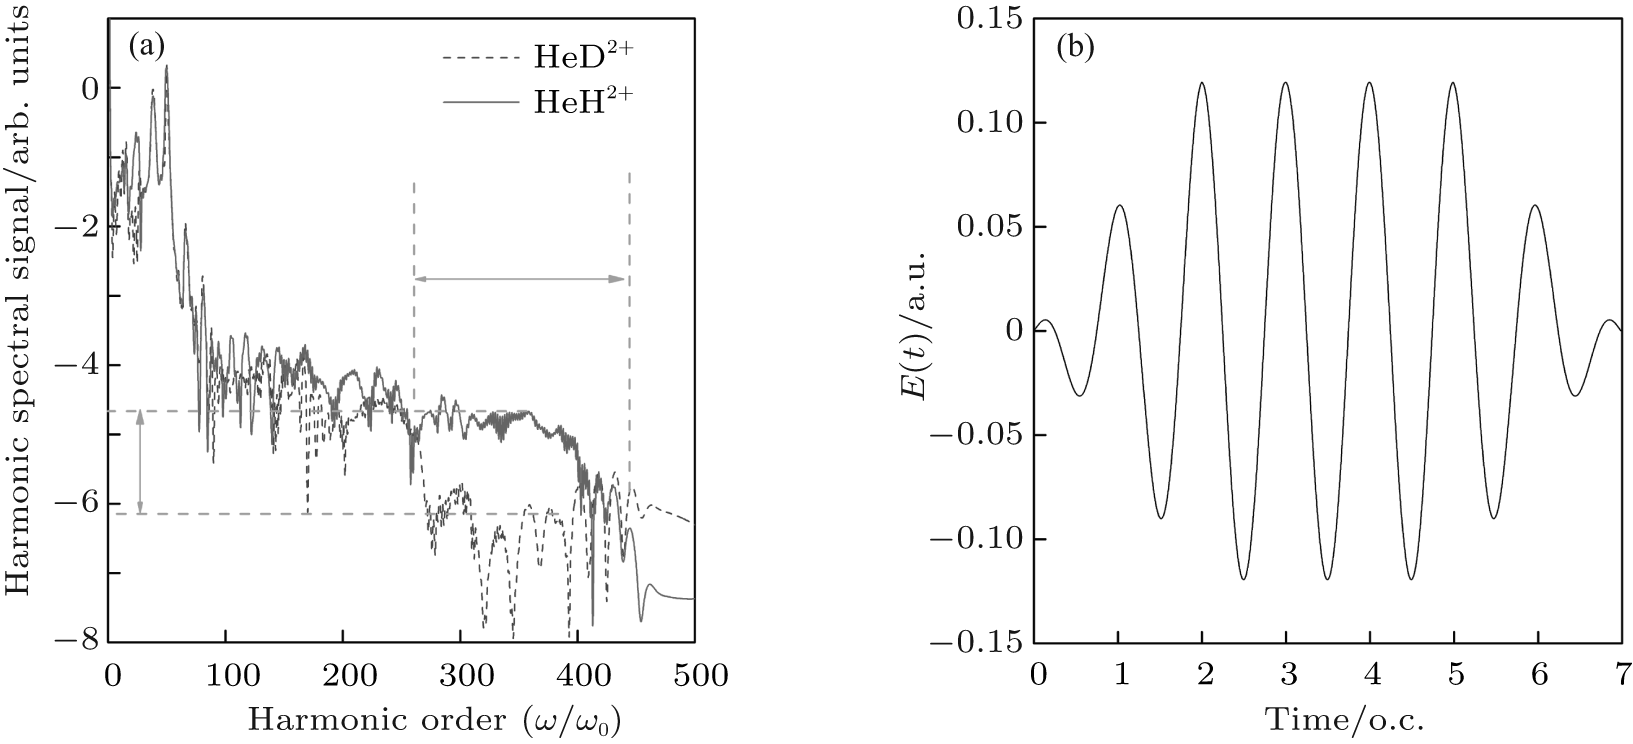 | Fig. 1. (a) High-order harmonic spectra of HeH2+ (red solid line) and HeD2+ (blue dashed line) at v = 0. (b) Sketch of the trapezoidal laser pulse with a wavelength of 1600 nm and a peak intensity of 5 × 10¹⁴ W/cm2. The total pulse lasts for seven optical cycles (o.c.). |
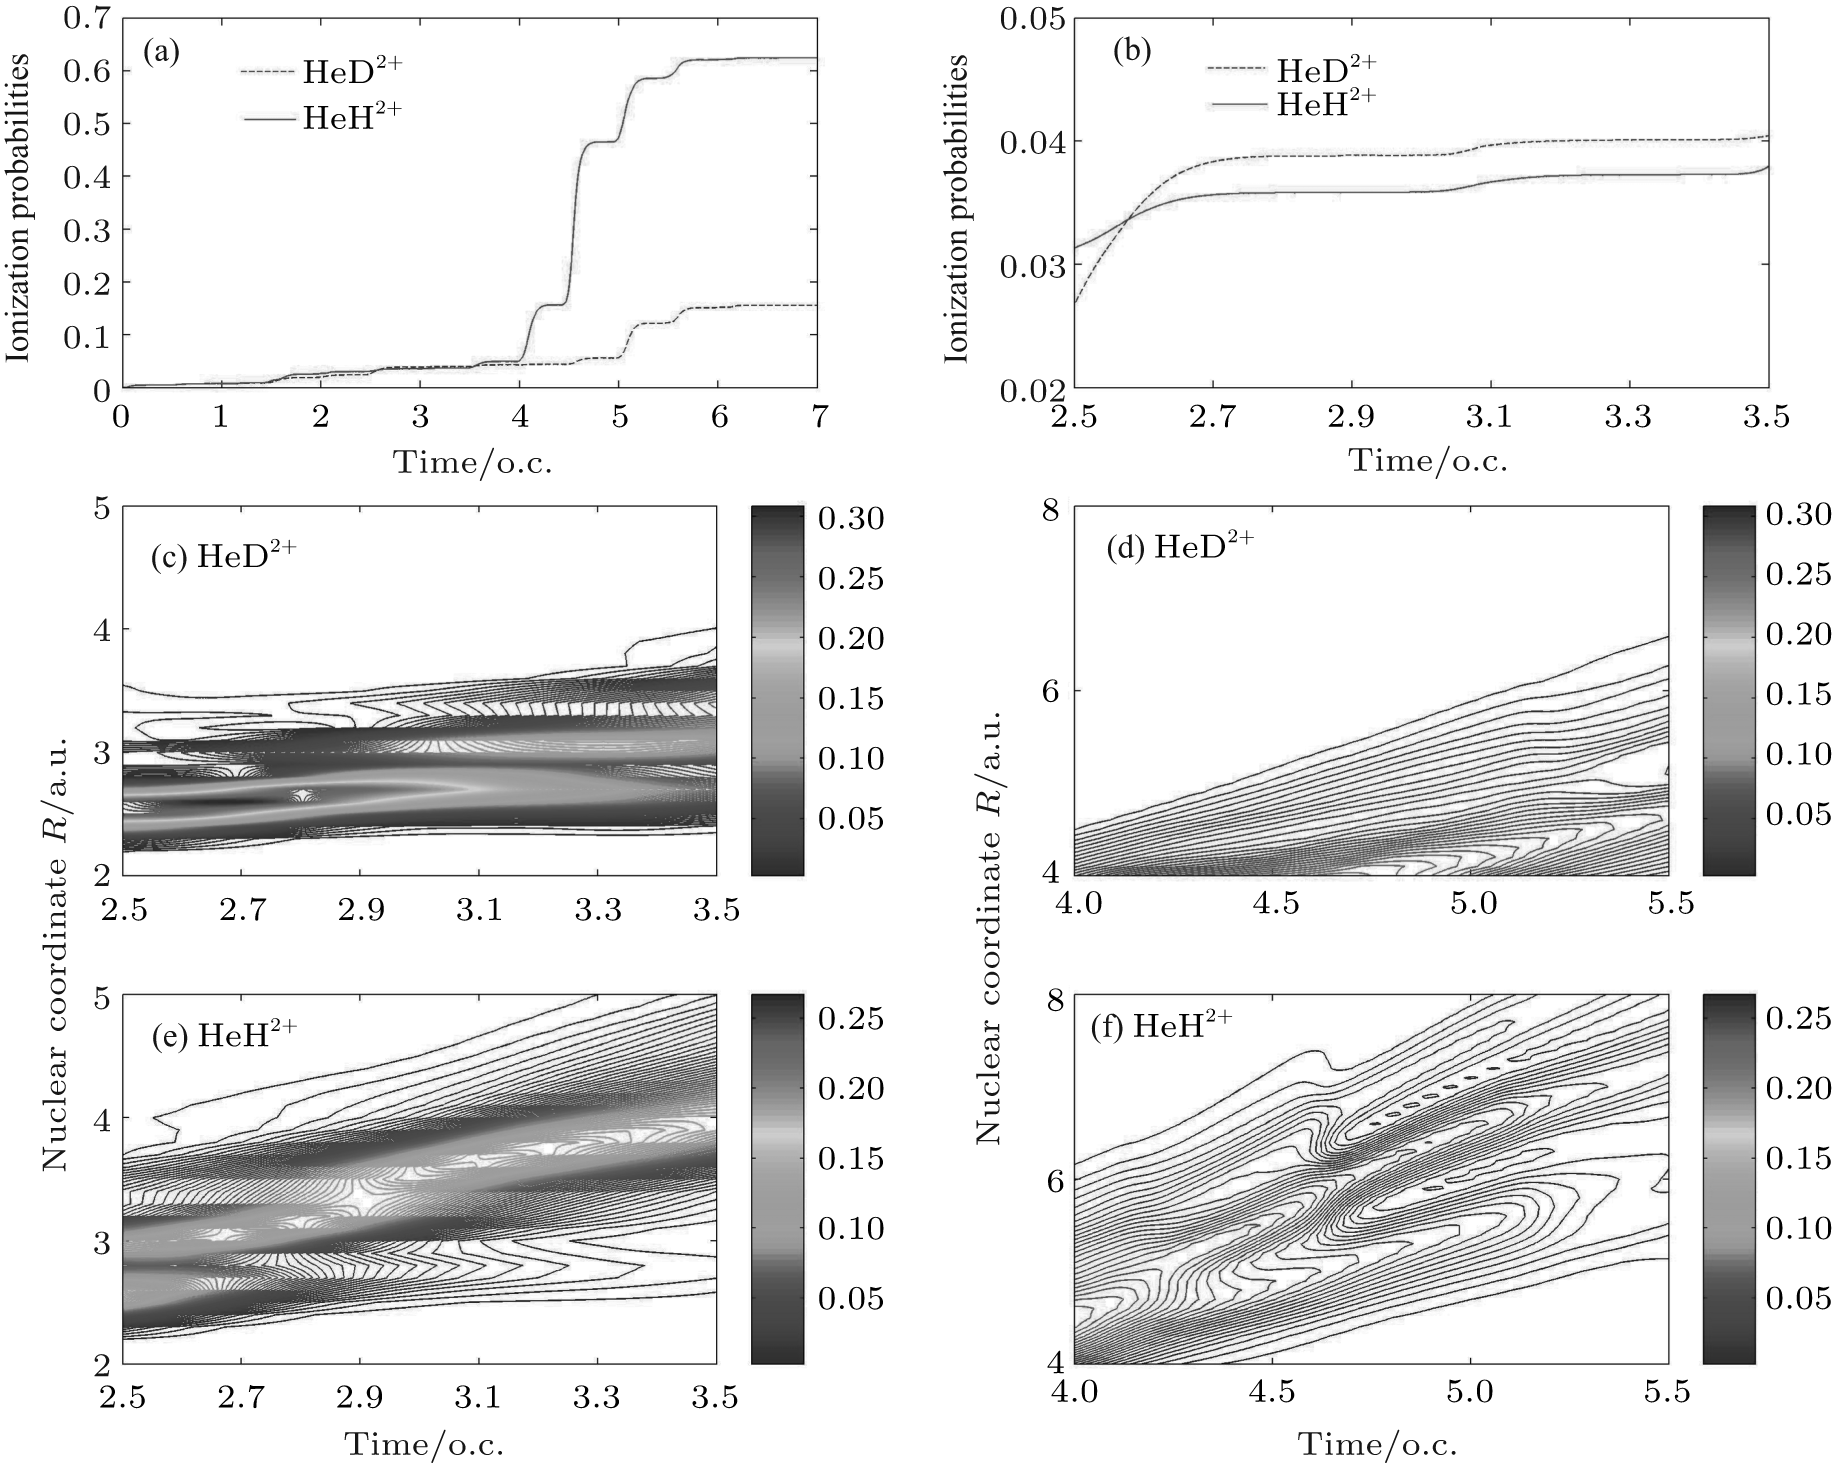 | Fig. 2. With the same laser parameters as those in Fig. 1(a) the ionization probabilities of HeH2+ (red solid line) and HeD2+ (blue dashed line), (b) the enlargement of the ionization probabilities in a time range from t = 2.5 o.c. to t = 3.5 o.c. ((c) and (d)) ((e) and (f)) the time evolutions of nuclear probability densities of HeD2+ (HeH2+ ) in time ranges from t = 2.0 o.c. to t = 3.5 o.c. and from t = 4.0 o.c. to t = 5.5 o.c., respectively. |
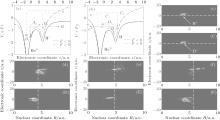
To obtain a clear insight, we first adopt the double-well model to illustrate the electronic motion around either nucleus. The electronic motions around the nucleus H+ in Fig. 3(a) and around the nucleus He2+ in Fig. 3(b) are taken as an example. The x axis shows the electronic coordinate z, and the y axis shows the combined energy of Coulomb potential Vc and static field potential Fz. The electric field amplitude F corresponds to the peak laser intensity. Additionally, the dash– dotted curve and solid curve represent the combined energy for F > 0 and F < 0, respectively. The red (blue)-solid arrow represents the ionization process (electron transfer process). The green (red)-dashed arrow represents the homonuclear (heteronuclear) recombination. The magenta dashed arrow represents the intermolecular recombination. As shown in Fig. 3(a), at field F > 0, the potential well of the nucleus He2+ is dressed down while the potential of the nucleus H+ is dressed up. So some electrons around the nucleus H+ can transit to the nucleus He2+ , as illustrated by the downward blue-solid arrow directing to A. After half an optical cycle (i.e., F < 0), the potential well of the nucleus He2+ is dressed up while the potential of the nucleus H+ is dressed down. These electrons will then directly return back to recombine with the nucleus H+ , as illustrated by the magenta-dashed arrow directing to A1. Other electrons around the nucleus H+ may tunnel the barrier and thus become ionized out, as indicated by the red-solid arrow directing to B. After acceleration in the external field, the ionized-out electrons will recombine with either the homonuclear ion (i.e. H+ ) or the heteronuclear ion (i.e. He2+ , as indicated by the green-dashed arrow directing to B1 and the red-dashed arrow directing to B2, respectively. As illustrated in Fig. 3(b), on the one side, the electrons around the nucleus He2+ can be pumped to the nucleus H+ (blue-solid arrow directing to D). When the laser field changes its direction, some electrons may return back to recombine with the nucleus He2+ due to the resonance (magenta-dashed arrow directing to D1). On the other side, the electrons around the nucleus He2+ can also be ionized (red-solid arrow directing to C), and then accelerate in the laser field. After half an optical cycle, these ionized-out electrons may recombine with either the nucleus He2+ (green-dashed arrow directing to C1) or the nucleus H+ (red-dashed arrow directing to C2). In general, when asymmetric molecular ions are exposed to an intense laser field, multiple recombination channels will contribute to the harmonic emission. Furthermore, strong modulations appear in the harmonic spectra as displayed in Fig. 1(a). Next, according to the detailed description of the electronic motion in HeH2+ , we will qualitatively estimate the contribution of electrons around either nucleus to harmonic emission. The plots of electron– nuclear probability density distribution P(R, z) = |ψ (R, z; t)|2 of HeH2+ and HeD2+ at different moments are displayed in Figs. 3(c)– 3(f) and in Figs. 3(C)– 3(F), respectively. The x axis and y axis represents the nuclear coordinate R and the electronic coordinate z, respectively. Figures 3(c) and 3(C), respectively, illustrate the initial wave packets of HeH2+ and HeD2+ , which are distributed almost in the region of z > 0. For the asymmetric molecular HeH2+ (HeD2+ ), the electrons are localized mainly around the nucleus H+ (D+ ) for 2pσ state while around the nucleus He2+ they are localized for 1sσ state. So the electrons localized in the region of z > 0 and z < 0 can be used to show the electronic distribution around the nucleus H+ (D+ ) and He2+ , respectively. Considering the obvious difference in ionization probability in a time range from t = 4.0 o.c. to t = 5.0 o.c., we provide the corresponding electron– nuclear wave packet probability density distributions of HeH2+ ((d)– (f)) and HeD2+ ((D)– (F)) with a time spacing of 0.5 o.c. The vertical dashed line represents the positions of HeD2+ in R direction at different moments. Evidently, considerable numbers of electrons are periodically distributed in the region of z < 0 (i.e. the nucleus He2+ around t = n o.c. (n = 4 and 5). It is well accordant with the description mentioned above that numbers of electrons can transit from the nucleus H+ (D+ ) to the nucleus He2+ at F > 0 (i.e. t = n o.c.). With a lighter nuclear mass, the nucleus H+ moves faster than the nucleus D+ . The larger the internuclear distance is, the more easily the electrons break the constraint of nuclei. Therefore, the ionization probability from the nucleus H+ is far higher than that from the nucleus D+ . From Fig. 2(a), it can be seen that the difference in ionization probability between HeH2+ and HeD2+ is rapidly enhanced around 4.5 o.c. Moreover, the electrons are almost distributed around the nucleus H+ (D+ ) for HeH2+ (HeD2+ ) shown in Fig. 3(e) (3(E)). Consequently, the difference in harmonic efficiency between HeH2+ and HeD2+ at ν = 0 mainly results from the difference in ionization between electrons localized around nucleus H+ and those around nucleus D+ .
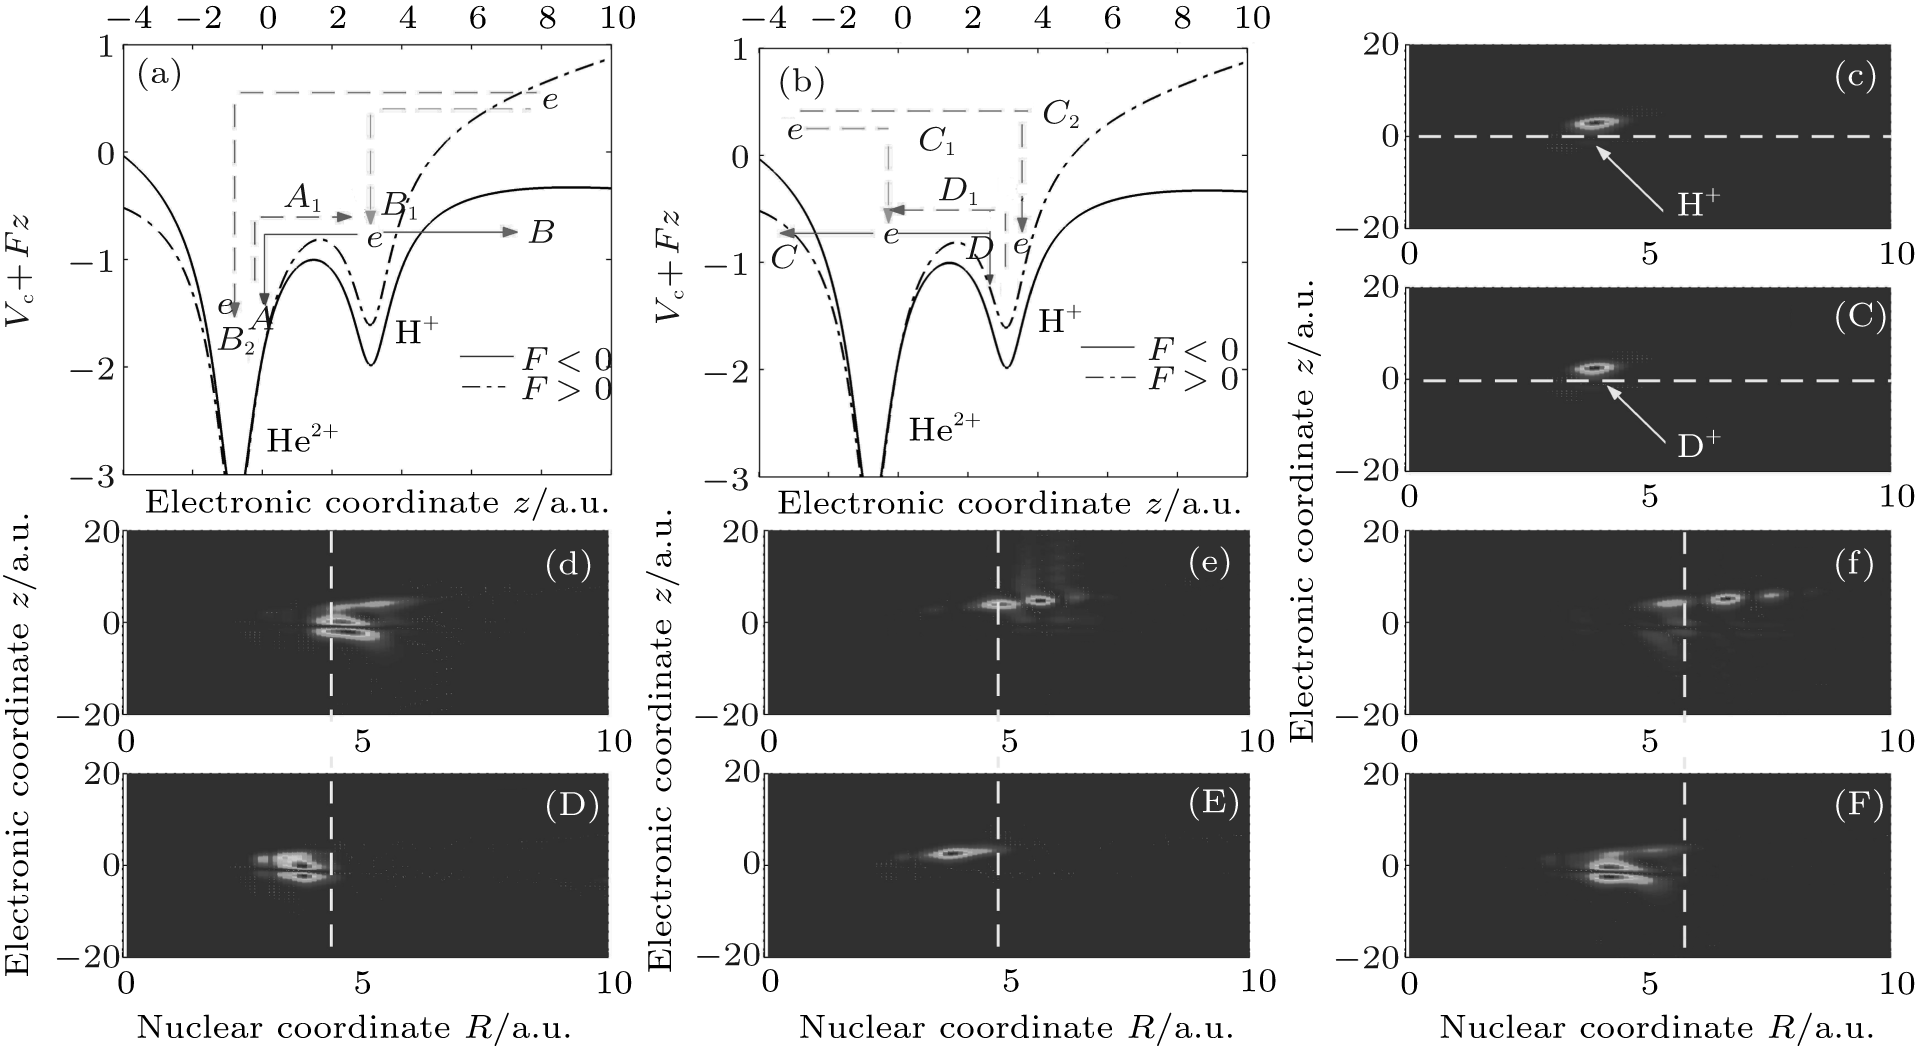 | Fig. 3. (a) and (b) Electron motion around the nucleus H+ and the nucleus He2+ , (c) and (C) the initial electron– nuclear wave packet probability densities of HeH2+ and HeD2+ (d)– (f) ((D)– (F)) the electron– nuclear probability densities of HeH2+ (HeD2+ ) in a time range from t = 4.0 o.c. to t = 5.0 o.c. in time steps of t = 0.5 o.c. |
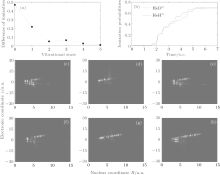
According to the discussion mentioned above, for HeH2+ in a 2pσ state, the electrons around the nucleus He2+ mainly originate from the electron transfer from the nucleus H+ . Moreover, electrons around the nucleus H+ can also directly tunnel the potential barrier and thus become ionized out. This means that the electron transfer process competes with the ionization process for the electrons around the nucleus H+ . It is known that the initial vibrational state greatly affects the ionization process of symmetric molecular ions.[17] For a more complicated structure for an asymmetric molecular ion (HeH2+ ), the initial vibrational level may also influence the ionization of electrons around the nucleus H+ . It may then indirectly affect the electron transfer process from the nucleus H+ to the nucleus He2+ . Next, we try to investigate the variation of electron localization with the increase of the initial vibrational level. According to Eq. (8), the ionization probabilities of HeH2+ and HeD2+ in different vibration states (from ν = 0 to ν = 5) are calculated. Figure 4(a) illustrates the corresponding difference in ionization probability (Dasy) between HeH2+ and HeD2+ . With the increase of vibrational state, the Dasy decreases quickly from 46% for ν = 0 to 0.9% for ν = 5. So the ionization probability of HeD2+ is almost identical with that of HeH2+ at ν = 5. According to the discussion about the ionization difference at ν = 0, we know that the ionizations of the electrons around nucleus H+ (D+ ) play an important role in the ionization process. How do the electron localization and the corresponding ionization change with the increase of the initial vibrational level in harmonic emission? To obtain more information, figure 4(b) provides the time-dependent total ionization probabilities of HeH2+ (red-solid line) and HeD2+ (blue-dashed line) at ν = 5. It can be observed that the ionization probability of HeD2+ from t = 4.0 o.c. to t = 5.0 o.c. increases more quickly than that of HeH2+ , and then the relevant difference in ionization probability decreases at the end of the laser pulse. The corresponding electron– nuclear wave packet probability density distributions of HeD2+ ((c)– (e)) and HeH2+ ((f)– (h)) at ν = 5 are demonstrated. Obviously, the nucleus H+ extends to a larger internuclear distance faster than the nucleus D+ in R direction. Moreover, the corresponding ionization potential is suppressed with the increase of the vibrational state.[17] So considerable numbers of electrons around the nucleus H+ will be ionized quickly, and then the transferred electrons to the nucleus He2+ tend to be fewer. Compared with the electrons around HeH2+ , the electrons around the nucleus D+ are relatively difficult to be ionized out, and thus more electrons are then transferred from the nucleus D+ to the nucleus He2+ . As observed from Figs. 4(c) to 4(h), the probability density around the nucleus He2+ for HeD2+ is larger than that for HeH2+ in a time range from t = 4.0 o.c. to t = 5.0 o.c. In other words, with the increase of the initial vibrational level, more electrons tend to localize around the nucleus He2+ . Additionally, the relevant constraint of nucleus He2+ to electrons tends to be weaker, and then the ionization from the nucleus He2+ will be enhanced prominently. Therefore, it is the dramatic enhancement of ionization from the nucleus He2+ for HeD2+ at ν = 5 that leads to almost the same ionization probability as that for HeH2+ . In the following simulation, we will focus on the relevant variations of the harmonic spectra of HeH2+ and HeD2+ .
 | Fig. 4. (a) Difference in ionization probability between HeH2+ and HeD2+ versus initial vibrational state from v = 0 to v = 5, (b) ionization probabilities of HeH2+ (red-solid line) and HeD2+ (blue-dashed line) for v = 5, (c)– (e) and (f)– (h) the electron– nuclear probability densities of HeD2+ and HeH2+ in time range from t = 4.0 o.c. to t = 5.0 o.c. in time steps of t = 0.5 o.c., respectively. |
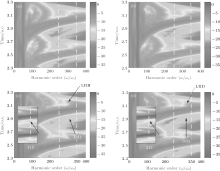
Figure 5 shows the harmonic spectra of HeH2+ (red-solid line) and HeD2+ (blue-dashed line) at ν = 5. With almost identical ionization probabilities, the harmonic efficiencies are nearly the same as each other. Nevertheless, their spectral structures exhibit different characteristics. For instance, there is an additional remarkable minimum indicated by an arrow around the 315th order in harmonic spectrum of HeH2+ , although it is not notable in the spectrum of HeD2+ . Due to the periodical harmonic emission, the time-frequency distributions of HeH2+ and HeD2+ in one optical cycle (from t = 2.3 o.c. to t = 3.3 o.c.) are selected to study the relevant physical mechanisms. Figures 6(a) and 6(c) (Figs. 6(b) and 6(d)) are time-frequency maps of HeH2+ (HeD2+ ) at ν = 0 and ν = 5, respectively. It is obvious that multiple recombination channels contribute to the harmonic emission from asymmetric molecular ions in an intense laser field, and the detailed distinguishing of these recombination channels has been discussed in Ref. [30]. With the increase of vibrational level, the higher ionization probability of HeH2+ may induce stronger intensities of the recombination channels originating from both the nucleus H+ and the nucleus He2+ . What is more, the long trajectory of the recombination channel originating from the nucleus H+ (LRH) and the interference of multiple recombination channels (IM1) are both enhanced greatly. And then the minimum in the spectrum of HeH2+ may be attributed to two factors. One is the interference between the long trajectory and the short one originating from the nucleus H+ (IMT), and the other is the interference of the recombination channels originating from the nucleus H+ and the nucleus He2+ (i.e. IM1). To investigate the original mechanism, we compare the time-frequency map of HeD2+ at ν = 0 with that at ν = 5. It is found that both the long trajectory of the recombination channel originating from the nucleus D+ (LRD) and the interference of multiple recombination channels of HeD2+ (IM2) are also enhanced with the increase of vibrational state. However, there is no noticeable suppression in the harmonic spectrum of HeD2+ around 315th order at ν = 5. Next, the enlargements of the time-frequency distributions of HeH2+ and HeD2+ from 250th order to 350th order are shown in the insets of Figs. 6(c) and 6(d), respectively. It is worth noting that around the 315th order, the intensity of the LRH is nearly the same as that of the LRD while the intensity of the IM1 is much more intense than that of the IM2. As a result, it may be the stronger IM1 rather than the IMT that induces the evident suppression in the harmonic spectrum of HeH2+ at ν = 5.
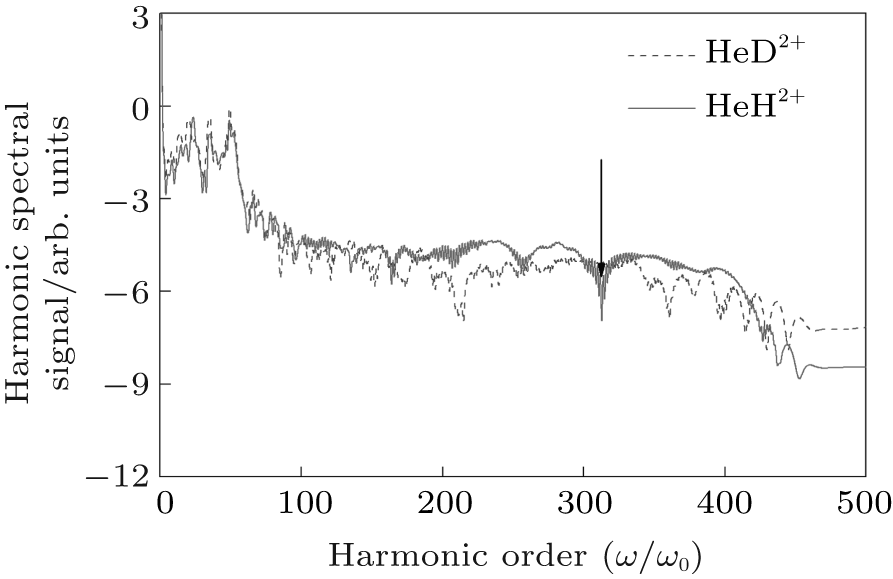 | Fig. 5. High-order harmonic spectra of HeH2+ (red-solid line) and HeD2+ (blue-dashed line) at ν = 5. |
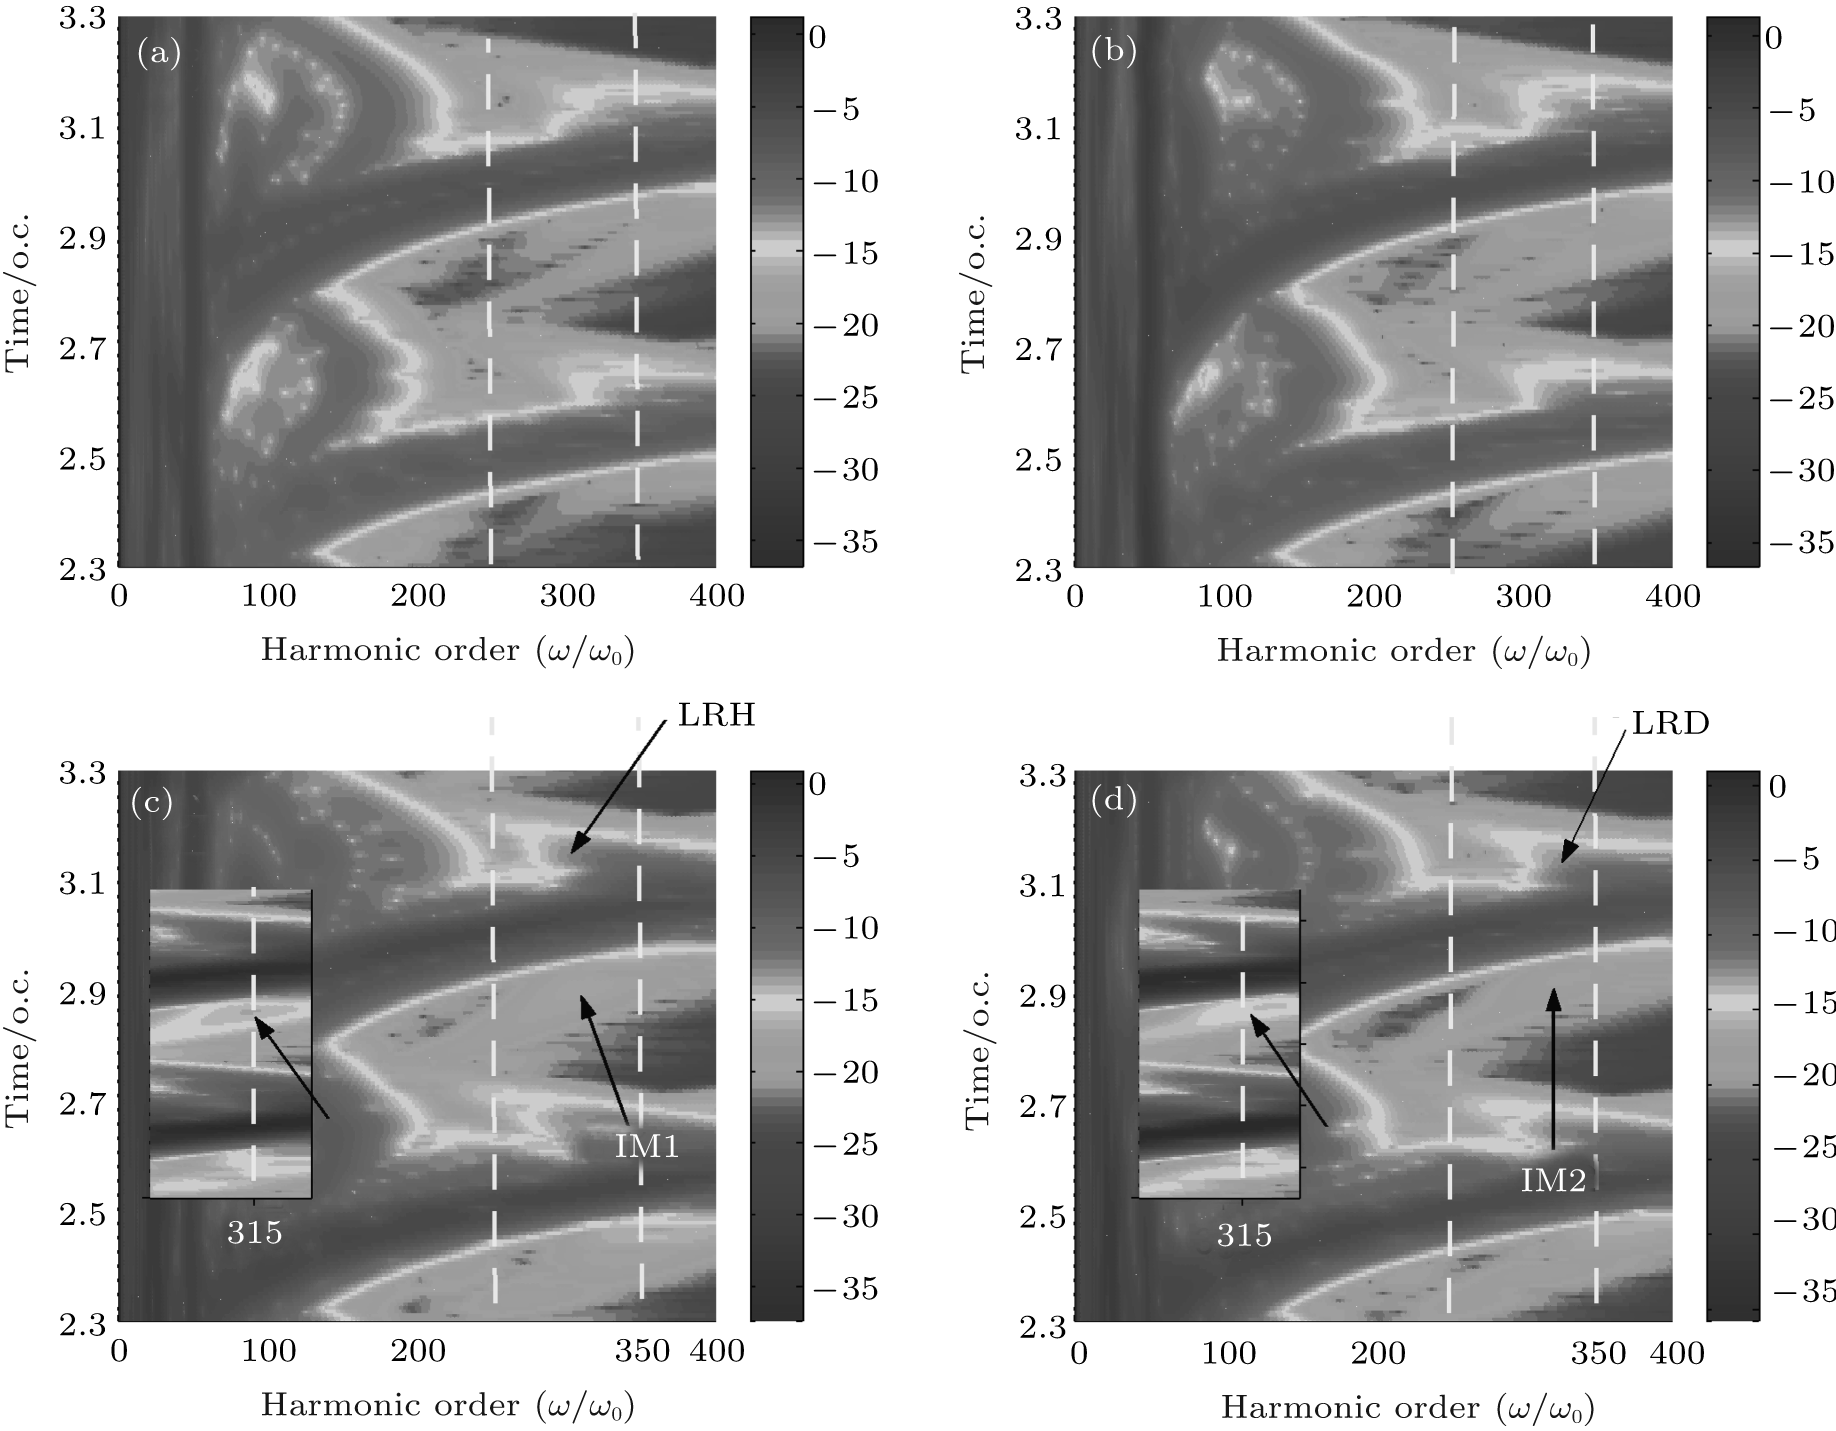 | Fig. 6. (a) and (b) ((c) and (d)) time-frequency distributions for HeH2+ and HeD2+ at ν = 0 (at ν = 5) in a time range from t = 2.3 o.c. to t = 3.3 o.c., respectively. The insert shows the enlargement of time-frequency distributions from 250th order to 350th order. |
In this paper, the electron localization in the harmonic emission is investigated by numerically solving the non-Born– Oppenheimer time-dependent Schrö dinger equation. According to the comparison of harmonic emission of HeH2+ with that of HeD2+ at different vibrational states, we qualitatively estimate the contributions of electrons around two nuclei to the ionization process. At the lowest vibrational state, the ionizations of electrons localized around the nucleus H+ (D+ ) mainly dominate the ionization process in harmonic emission, which leads to an harmonic intensity of HeH2+ that is 1.3 orders of magnitude stronger than that of HeD2+ in a high-order harmonic region. With the increase of the initial vibrational level, the electron transfer from the nucleus D+ to the nucleus He2+ is enhanced and more electrons tend to be localized around the nucleus He2+ . In this case, the ionizations of electrons around the nucleus He2+ are enhanced prominently, and then the harmonic efficiency of HeD2+ is almost the same as that of HeH2+ . However, the spectral structures are different. The stronger interference of multiple recombination channels may lead to an obvious minimum in the HHG spectrum of HeH2+ .
The authors sincerely thank Prof. Han Ke-Li and Dr. Lu Rui-Feng for providing us with the LZH-DICP code.
| 1 |
|
| 2 |
|
| 3 |
|
| 4 |
|
| 5 |
|
| 6 |
|
| 7 |
|
| 8 |
|
| 9 |
|
| 10 |
|
| 11 |
|
| 12 |
|
| 13 |
|
| 14 |
|
| 15 |
|
| 16 |
|
| 17 |
|
| 18 |
|
| 19 |
|
| 20 |
|
| 21 |
|
| 22 |
|
| 23 |
|
| 24 |
|
| 25 |
|
| 26 |
|
| 27 |
|
| 28 |
|
| 29 |
|
| 30 |
|
| 31 |
|
| 32 |
|
| 33 |
|
| 34 |
|
| 35 |
|
| 36 |
|
| 37 |
|
| 38 |
|