Quantum path control using attosecond pulse trains via UV-assisted resonance enhance ionization*
[Li Fang† , Wei Lai, He Zhi-Cong]
, Wei Lai, He Zhi-Cong]
|
|


†Corresponding author. E-mail: lifang_wit@hotmail.com
*Project supported by the National Natural Science Foundation of China (Grant No. 11204222) and the Natural Science Foundation of Hubei Province, China (Grant Nos. 2013CFB316 and 2014CFB793).
We theoretically investigate the quantum path selection in an ultraviolet (UV)-assisted near-infrared field with an UV energy below the ionization threshold. By calculating the ionization probability with different assistant UV frequencies, we find that a resonance-enhanced ionization peak emerges in the region Euv < Ip, where Euv is the photon energy and Ip is the ionization energy. With an attosecond pulse train (APT) centered in the resonance region, we show that the short quantum path can be well selected in the continuum case. By performing the electron trajectory analysis, we have further explained the physical mechanism of the quantum path selection. Moreover, we also demonstrate that in the resonance region, the harmonic emission from the selected paths is more efficient than that with the APT energy above the ionization threshold.
High order harmonic generation (HHG), which is known as a highly nonlinear process in laser– atom interaction, has been a topic of great interest in the past several decades because of its potential applications in the production of coherent extreme ultraviolet (XUV) source, [1– 4] as well as the generation of attosecond pulses.[5– 16] Attosecond pulses can be utilized as a unique tool to probe the ultrafast electronic dynamics inside atoms or molecules[17– 24] and inaugurate a new domain for time-resolved metrology on an attosecond time scale.[25– 27] During the laser– molecular interaction, the generated harmonics have also provided a promising method for the tomographic imaging of a molecular orbital.[28– 32]
The physical mechanism of HHG can be well explained by the three-step model.[33, 34] In detail, the electron first tunnels through the Coulomb-like potential barrier, which is lowered by the laser field. Once free, it oscillates and gains kinetic energy in the continuum in response to the laser field. Finally, the electron can recombine with the parent ions, releasing its kinetic energy (up to 3.17Up, where Up is the ponderomotive energy) in the form of high-order harmonic radiation. During the HHG process, the two most important quantum trajectories contributing to each harmonic are the so-called short and long trajectories, characterized by electron travel times in the continuum of about one-half and about one optical cycle, respectively.[34, 35] For harmonics in the plateau, both trajectories are present. The interference between the two components results in an irregular radiation with at least two bursts within half an optical cycle. However, straightforward attosecond metrology prefers an isolated attosecond pulse or a regular attosecond pulse train, [5, 25] which can be obtained only when one quantum path is well selected. Due to the valuable applications, the selection of the quantum path has attracted a lot of attention.
Up to now, the quantum path selection can be achieved either macroscopically or in single-atom response. Macroscopically, the phase matching conditions are different for the short and long trajectories. By locating the gas medium behind the focus, the short trajectory can be selected due to the compensation between the Gouy phase and the dipole phase during propagation.[36– 40] Another scheme for quantum path selection is removing the long trajectory with a small aperture along the propagation direction.[41] This works because the HHG from the long trajectory has a larger divergence angle than that of the short trajectory. In the single-atom response, the quantum path selection can be realized by using the two-color field.[42– 47] It has been reported that both the short and long quantum paths can be selected separately by adjusting the polarization axes and relative phase between the fundamental and assistant fields.[42] Recently, in combination with the spatial inhomogeneity of the laser field, the selection of the short path has also been realized in inhomogeneous fields.[48– 50] Nowadays, with the development of attosecond science, the attosecond pulse train (APT) has provided another promising way to control the quantum paths due to its special periodicity (half of the optical cycle). Experimentally, an intense attosecond pulse has been produced with a maximum pulse energy of up to 1.3 μ J, [51] which will enable us to perform a nonlinear attosecond optics experiment. By using an APT-assisted near-infrared (NIR) field, Schafer et al.[52] have theoretically demonstrated the selection of a single quantum trajectory by adjusting the time delay between the APT and NIR field. Some relevant works have also been reported in other contexts, such as in Refs. [53] and [54]. In these previous works, the APT energies (defined as the photon energy of the central frequency of the APT) are all above the ionization threshold of the target atom. The electron ionization step is assumed to be entirely controlled by APT. Corresponding ionization proceeds via one-photon absorption. However, once the APT energy is below the ionization threshold, the above assumption will be invalid.
This paper is devoted to investigating the quantum path selection in the APT-assisted near-infrared (NIR) field with an APT energy below the ionization threshold. In our investigations, we first calculate the ionization probability with an ultraviolet (UV) pulse. The result shows an enhanced resonance ionization peak in the region where the UV energy (Euv) is lower than the ionization energy (Ip). With the APT centered in the resonance region, we find that the short trajectory can be selected by adjusting the time delay between the APT and NIR field. The quantum path selection is further explained based on our electron trajectory analysis. In addition, we have also compared the HHG with the APT energy above the ionization threshold, and have found that the harmonic emission is much stronger when the energy of the additional APT lies in the resonance region.
In our present work, we consider the interaction of an atom with a linearly polarized intense laser pulse. The dynamics of an atomic electron is mainly along the polarization direction of the laser field, which allows us to model the HHG process by performing the simulations of the time-dependent Schrö dinger equation (TDSE) in one spatial dimension [atomic units (a.u.) are used throughout this paper unless stated otherwise]
where E(t) is the laser field, and V(x) is the Coulomb potential of the target atom, which can be described by

Here, ε is the soft core parameter. In our simulations, we choose helium atom as the target atom and the corresponding ε equals 0.484. Equation (1) is solved numerically as follows. Initially, the system is in its ground state, which is calculated via the imaginary-time propagation method.[55] Then, the wave function of the system is propagated in real time in the presence of combined Coulomb and laser field potentials. The symmetrically second-order split operator algorithm is used in this work. It can be expressed formally as

In detail, the operator exp(iΔ t∇ 2/4) is firstly applied to Ψ (x, t), which is equivalent to a free particle propagation over a half time increment Δ t/2. This procedure is implemented with the help of the fast Fourier transform algorithm. Then, the wave function gets a phase change from the action of the potential applied over the whole increment Δ t. Finally, the operator (iΔ t∇ 2/4) is applied again as the first step. In this way, the wave function evolves from the initial ground state to the final state at t = ∞ . To prevent the reflection of the wave function from the boundary, the wave function is multiplied by a cos1/8 mask function in each step. According to the Ehrenfest theorem, [56] the time-dependent dipole acceleration a(t) is given by
The harmonic spectrum is then obtained by Fourier-transforming the dipole acceleration a(t):


where T and ω are the duration and frequency of the driving pulse, respectively, and q corresponds to the harmonic order. By superposing several harmonics, an ultrashort pulse is generated and the temporal shape of this pulse is

We first investigate the ionization in a near-infrared (NIR) 800-nm laser pulse combined with an ultraviolet (UV) pulse. The synthesized electric field can be expressed as

where E0 and E1 are the the amplitudes of the NIR and UV fields, and ω 0 and ω uv are the corresponding frequencies of the two pulses. The NIR field envelope, f0(t), is in the form of a sine function with a duration of eight optical cycles, and the UV field envelope, f1(t), is a sin4 function with the same duration as the NIR field. Here, τ is the time delay between the two pulses, and the target atom is chosen to be helium atom, of which the ionization energy (Ip) is 24.6 eV.
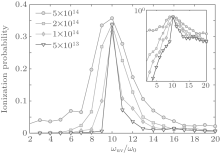
In Fig. 1, we have presented the ionization probability as a function of the UV frequency for four different NIR intensities: 5.0 × 10¹⁴ W/cm2 (blue circles), 2.0 × 10¹⁴ W/cm2 (red diamonds), 1.0 × 10¹⁴ W/cm2 (green squares), and 5.0 × 10¹³ W/cm2 (black nablas). The UV pulse intensity is fixed at 1.0 × 10¹³ W/cm2. One can clearly see that, with the increase of the UV frequency, a remarkable peak structure emerges in the region from 8ω 0 to 12ω 0, while for other frequency regions, the ionization probability becomes relatively small. The electronic ionization is sensitively dependent on the UV frequency and the maximum ionization appears with the UV frequency of 10ω 0. For different NIR intensities, the peak structure still exists and the position as well as the maximum value of the ionization probability are nearly unchanged. These results indicate that the enhanced ionization peak is mainly caused by the presence of the UV pulse. At a specific UV frequency (here is 10ω 0), it induces the resonant enhancement (maximum value) of the ionization. For a clear insight, the same result is also presented in the inset with a logarithmic scale. Note that, in the enhanced ionization region, the energy of UV pulse (Euv) is less than the atomic ionization energy Ip (∼ 16ħ ω 0). Whereas in previous works, [52– 54] the usually used UV (or APT) fields have energies near or above the ionization threshold (≥ 16ħ ω 0), where the corresponding ionization probability is approximately 1 ∼ 2 magnitudes lower than that in the resonance region (see in the inset). In contrast, with the UV frequency in the resonance region, the effect of the enhanced ionization is much more prominent and is more beneficial for the selection of quantum paths with a low UV intensity. This will consequently relax the requirement of the intensity of the UV pulse for intense harmonic generation in the experiment.
 | Fig. 1. The ionization probability as a function of the frequency of UV pulse for different intensities of the fundamental field: 5.0 × 10¹⁴ W/cm2 (blue circles), 2.0 × 10¹⁴ W/cm2 (green squares), 1.0 × 10¹⁴ W/cm2 (red diamonds), and 5.0 × 10¹³ W/cm2 (black nablas). The inset is the same result but with the ordinate in logarithmic scale. Here, the intensity of the UV pulse is fixed at 1.0 × 10¹³ W/cm2. |
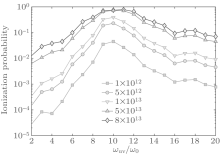
In Fig. 2, we show the calculated results of the dependence of the ionization on the UV frequency for different UV intensities. The NIR intensity here is fixed at 2.0 × 10¹⁴ W/cm2. One can see that the peak structure still exists and the position of the resonant peak can be kept consistent with that in Fig. 1. But the ionization degree shows significant dependence on the UV intensity. At each UV frequency, it shows a growth trend in the ionization as the UV intensity is increased.
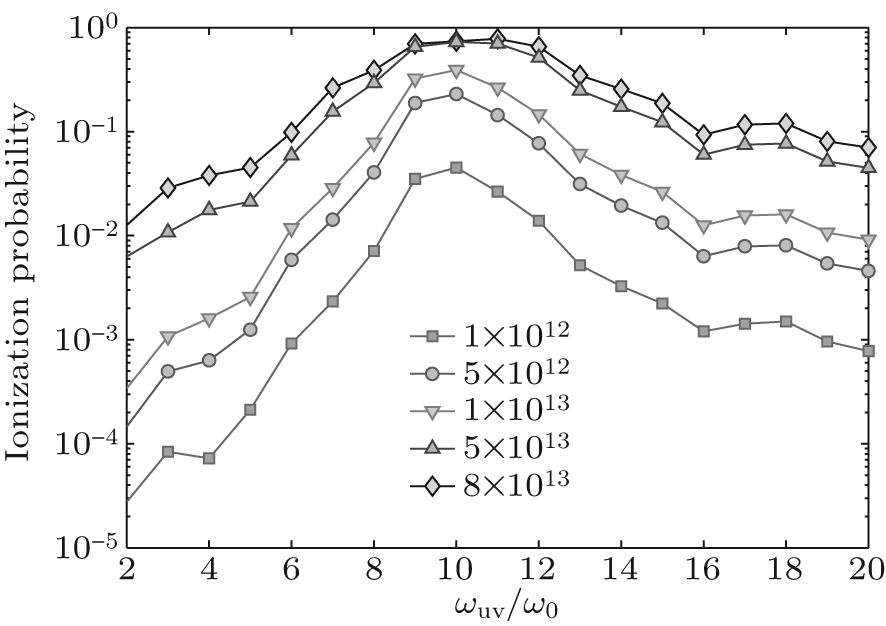 | Fig. 2. The ionization probability as a function of the frequency of UV pulse for different intensities of the UV pulse: 1.0 × 10¹² W/cm2 (red squares), 5.0 × 10¹² W/cm2 (green circles), 1.0 × 10¹³ W/cm2 (yellow nablas), 5.0 × 10¹³ W/cm2 (blue triangles), and 8.0 × 10¹³ W/cm2 (black diamonds). Here, the intensity of the fundamental pulse is fixed at 2.0 × 10¹⁴ W/cm2. |
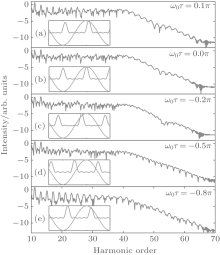
 | Fig. 3. The harmonic spectra generated by a 2.0 × 10¹⁴ W/cm2 fundamental field in combination with a 1.0 × 10¹³ W/cm2 attosecond pulse train for different values of the delay between these two pulses. |
We next investigate the harmonic generation for a helium atom interacting with the NIR 800-nm fundamental field and an APT. Generally, an APT can be obtained by filtering the harmonics in the plateau region. In our calculations, an APT with a central frequency of 9ω 0 (which is in the resonance peak region) is employed, which is given by superposing the odd harmonics from 5th to 13th. The intensities of the NIR and APT fields are 2.0 × 10¹⁴ W/cm2 and 1.0 × 10¹³ W/cm2, respectively. Figure 3 shows the harmonic spectra for different delays between the two pulses. The overlaps between the NIR field and the APT are shown in the insets. One can clearly see that, when ω 0τ = 0.1π , 0.0π , − 0.2π , and − 0.5π [see in Figs. 3(a)– 3(d), respectively], the harmonic spectra are all seriously modulated and it is hard to identify the individual harmonics in these spectra. These irregular structures in the harmonic plateaus mainly result from the interference of several quantum paths. While in the case of ω 0τ = − 0.8π [Fig. 3(e)], the harmonic spectrum is well resolved and one can identify clear signals of the odd harmonics. This clean harmonic spectrum implies that one of the quantum trajectories is well selected under the delay of ω 0τ = − 0.8π . Note that this result depends insensitively on the fluctuation of the delay. Well-resolved spectra will not change when the delay fluctuates from − 0.7π to − 0.9π .
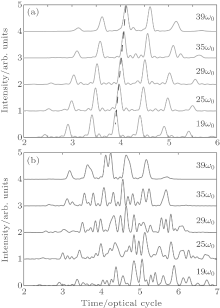
To clarify the quantum trajectory selection at the “ good” delay ω 0τ = − 0.8π , we further investigate the temporal characteristics by applying a square window with a width of 10ω 0 (∼ 15.5 eV) to the harmonic spectrum at different central frequencies. The temporal profiles are shown in Fig. 4 for different central wavelengths. As can be seen in Fig. 4(a), only one pulse is generated within every half optical cycle, which means that one of the short or long quantum paths is effectively selected. Moreover, one can see that the emission time gradually increases with the increase of the central frequency of the high harmonics. In other words, the harmonics exhibit a positive and linear frequency chirp (as marked by the dashed line), which agrees well with the characteristics of harmonic emission from the short trajectory. Then, we can conclude that the entrance of the APT with a delay of ω 0τ = − 0.8π has successfully selected only the short trajectory. For comparison, we have also calculated the temporal profile for different harmonics when ω 0τ = − 0.2π . The results are presented in Fig. 4(b). It is obvious that the temporal profiles become irregular and no longer periodic in time. This is due to the interference between multi-trajectories.
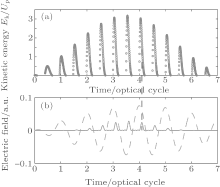
For a clear physical insight of the above quantum trajectory selection, we have analysed the classical electron trajectory in Fig. 5. Figure 5(a) displays the return kinetic energy (Ek) of electrons as a function of the ionization time in the NIR field. Figure 5(b) shows the temporal profiles of the NIR (red dashed line) and the APT (green solid line) fields. It is obvious that, under a delay of ω 0τ = − 0.8π , the individual pulses in the assisted APT correspond to the ionization times of the short trajectories of the electron trajectory (as marked as the black dashed line), which will enhance the ionization of electrons from these short trajectories and thereby lead to intense harmonic emission from these trajectories. By contrast, the ionization of electrons from the long trajectory is weaker and the contribution to HHG becomes negligible. That is why the short progression is well selected in the APT-assisted NIR field with ω 0τ = − 0.8π .
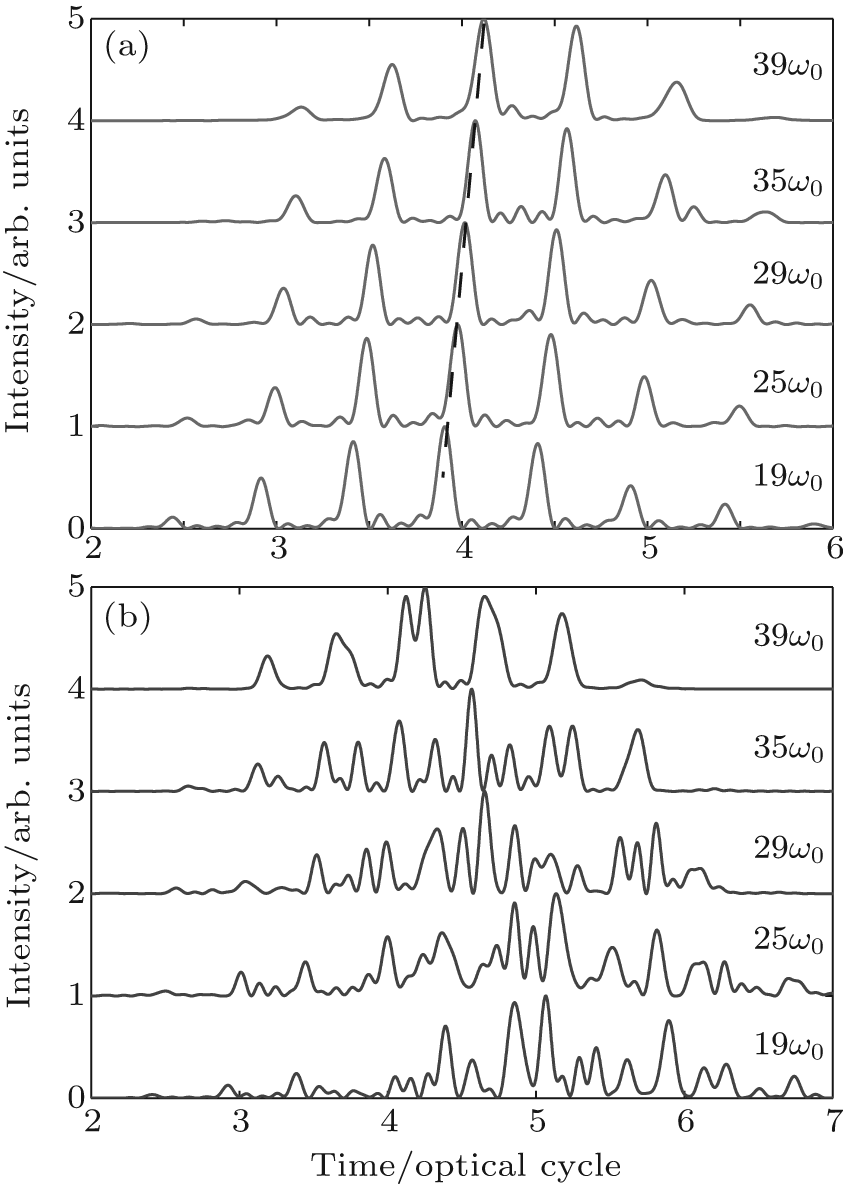 | Fig. 4. (a) Temporal profiles of the attosecond pulses centered at different frequencies by superposing the harmonics generated with ω 0τ = − 0.8π . (b) Same as panel (a), but for the case of ω 0τ = − 0.2π . Other laser parameters are the same as those in Fig. 3. |
 | Fig. 5. (a) Dependence of the electron kinetic energy Ek on the ionization time (blue dots), and (b) the temporal profiles of the NIR field (red dashed line) and the APT (green solid line). The laser parameters are the same as those in Fig. 4. |
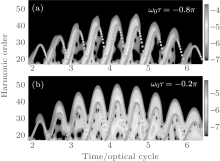
To verify the above classical analysis, we further investigate the emission times of the harmonics with the time-frequency analysis method. The calculation details can be found in Ref. [57] and the references therein. The result is shown in Fig. 6(a). In addition, the classical electron trajectory as a function of the recombination times is also superimposed as the circles. One can clearly see that the left branches of the trajectory are bright, while the right one almost disappears at the delay ω 0τ = − 0.8π . This result indicates that the synthesized APT and NIR fields have significantly enhanced the short trajectory contribution and suppressed the long trajectory, resulting in a regular harmonic spectrum [Fig. 3(e)] and only one pulse per half optical cycle [Fig. 4(a)]. This result agrees well with the classical analysis in Fig. 5. For comparison, the similar time-frequency analysis result for ω 0τ = − 0.2π is also presented in Fig. 6(b). It is obvious that the HHG contributions from short and long quantum trajectories exist simultaneously in every half optical cycle. The interference between the two trajectories leads to the irregular structures in the harmonic spectrum [Fig. 3(c)] and temporal profiles [Fig. 4(b)].
 | Fig. 6. (a) The time-frequency image (background), and the superimposed classical recombination (circles) paths of electrons for ω 0τ = − 0.8π . (b) Same as panel (a), but for the case of ω 0τ = − 0.2π . In the calculation, other parameters are the same as those in Fig. 3. The color bar is in logarithmic scale. |
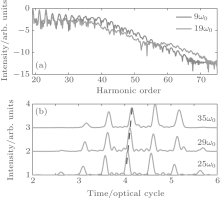
Finally, we would like to compare the quantum trajectory selection with the APT energy above the ionization threshold. Figure 7(a) shows the harmonic spectrum (green line) with the APT centered at 19ω 0. Here, the time delay between the APT and NIR field is chosen as ω 0τ = 0.5π , and other laser parameters are the same as those in Fig. 3. We can see that the harmonic spectrum is well resolved. Also, as shown in Fig. 7(b), the temporal profile is regular and only one pulse is generated in each half cycle. These results are very similar to those in Fig. 4; i.e., it shows a positive and linear frequency chirp for each high harmonic (as marked by the black dashed line). This means that the short quantum trajectory is also well selected with the APT centered at 19ω 0. Furthermore, we also present the harmonic spectrum at the APT frequency 9ω 0 [namely, the spectrum in Fig. 3(e)] with the blue line in Fig. 7(a). One can see that the high harmonic intensity with the APT centered at 19ω 0 is about one magnitude lower than that at 9ω 0. This result demonstrates the prediction in Fig. 1. In the resonance region, the harmonic generation from the selected quantum trajectory is indeed more efficient than that above the ionization threshold, and is more beneficial for the experimental realization of quantum trajectory selection and efficient high harmonic attosecond sources. On the other hand, one can see from Fig. 1 that the ionization enhancement effect gradually decreases with the increasing NIR field intensity. This happens because the ionization will saturate in the high-intensity NIR laser field. Therefore, the above scheme of quantum trajectory selection and enhanced HHG works well if the laser intensity is lower than 5 × 10¹⁴ W/cm2.
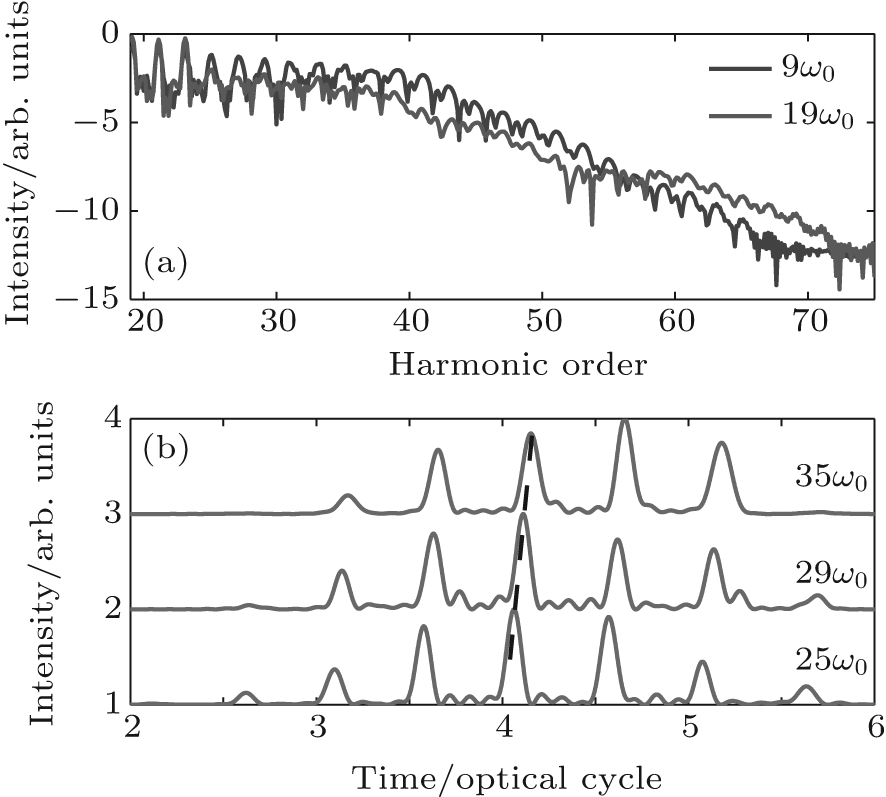 | Fig. 7. (a) The harmonic spectrum calculated with the APT centered at 19ω 0 (green line). (b) The corresponding attosecond pulses centered at different frequencies by superposing the harmonics (green line) in panel (a). Here, the time delay is chosen as ω 0τ = 0.5π . Other laser parameters are the same as those in Fig. 3. For comparison, the harmonic spectrum in Fig. 3(e) is also presented as the blue line in panel (a). |
In conclusion, we have investigated quantum trajectory control in the APT-assisted near-infrared field with the APT energy below the ionization threshold. Our results show an enhanced resonance ionization peak when the UV energy is from 8ω 0 to 12ω 0. With the APT energy in the resonance region, the generated harmonic spectrum can be well resolved at a proper time delay between the APT and the NIR field. Moreover, each harmonic exhibits a positive and linear frequency chirp. This indicates that the short trajectory is well selected. Further, the classical electron trajectory has been employed to analyze the physical mechanism of the quantum trajectory selection. In addition, by calculating the HHG with the APT energy above the ionization threshold, we find that harmonic emission in the resonance region is more efficient and is more beneficial for the experimental realization of the quantum path selection.
| 1 |
|
| 2 |
|
| 3 |
|
| 4 |
|
| 5 |
|
| 6 |
|
| 7 |
|
| 8 |
|
| 9 |
|
| 10 |
|
| 11 |
|
| 12 |
|
| 13 |
|
| 14 |
|
| 15 |
|
| 16 |
|
| 17 |
|
| 18 |
|
| 19 |
|
| 20 |
|
| 21 |
|
| 22 |
|
| 23 |
|
| 24 |
|
| 25 |
|
| 26 |
|
| 27 |
|
| 28 |
|
| 29 |
|
| 30 |
|
| 31 |
|
| 32 |
|
| 33 |
|
| 34 |
|
| 35 |
|
| 36 |
|
| 37 |
|
| 38 |
|
| 39 |
|
| 40 |
|
| 41 |
|
| 42 |
|
| 43 |
|
| 44 |
|
| 45 |
|
| 46 |
|
| 47 |
|
| 48 |
|
| 49 |
|
| 50 |
|
| 51 |
|
| 52 |
|
| 53 |
|
| 54 |
|
| 55 |
|
| 56 |
|
| 57 |
|