

Some regularity on how to locate electrodes for higher fECG SNRs*
[Zhang Jie-Mina) , Huang Xiao-Lina) , Guan Qunb) , Liu Tie-Bingb)†  , Li Ping
b) , Zhao Yinga) , Liu Hong-Xinga)‡ ]
, Li Ping]
|
|

 , Li Ping
†Corresponding author. E-mail: njbull@163.com
‡Corresponding author. E-mail: njhxliu@nju.edu.cn
*Project supported by the National Natural Science Foundation of China (Grant No. 61271079) and the Supporting Plan Project of Jiangsu Province, China (Grant No. BE2010720).
The electrocardiogram (ECG) recorded from the abdominal surface of a pregnant woman is a composite of maternal ECG, fetal ECG (fECG) and other noises, while only the fECG component is always needed by us. With different locations of electrode pairs on the maternal abdominal surface to measure fECGs, the signal-to-noise ratios (SNRs) of the recorded abdominal ECGs are also correspondingly different. Some regularity on how to locate electrodes to obtain higher fECG SNRs is needed practically. In this paper, 343 groups of abdominal ECG records were acquired from 78 pregnant women with different electrode pairs locating, and an appropriate extended research database is formed. Then the regularity on fECG SNRs corresponding to different electrode pairs locating was studied. Based on statistical analysis, it is shown that the fECG SNRs are significantly higher in certain locations than others. Reasonable explanation is also provided to the statistical result using the theories of the fetal cardiac electrical axis and the signal phase delay.
Unlike magnetocadiography (MCG), [1– 3] noninvasive fetal electrocardiogram (ECG) detection promises to be a much cheaper way to monitor fetal status.
Fetal cardiac electrical activities pass through various body layers, and are finally picked up by electrodes on the pregnant abdominal skin. The abdominal ECG (aECG) record of a pregnant woman is composed of the maternal ECG component, the fetal ECG component, and various interferences (due to muscular and respiratory activities, etc.) and noises.[4– 7] Among various recorded abdominal ECGs, those with greater fECG components will be more likely and easier to extract clear fECGs.[8, – 12] The recorded abdominal ECGs seem quite different as the electrode location varies. It is therefore necessary to optimize the electrode locations to record the abdominal ECG signals with higher fECG signal-to-noise ratios (SNRs).
A number of electrode position schemes have been proposed for fetal ECG collection. In general, they can be divided into two groups. One is to place the electrodes around the maternal abdomen, [13, 14] and another is to place the electrodes on the abdominal surface.[15– 17] Considering the latter group, the optimized electrode position scheme has not been obtained or confirmed based on theoretical analyses or experimental studies. Therefore, in this paper, some regularity on how to place electrodes on the maternal abdominal surface for higher fECG SNRs is investigated, based on a large amount of experimental data.
The rest part of this paper is arranged as follows. Section 2 describes how to collect the experimental data. Section 3 provides the statistics of fECG SNRs based on these experimental data. Section 4 gives a further discussion on the regularity of fECG SNRs. Section 5 ends with the conclusion.
Our data acquisition system is composed of a 1350P-ECG (a 12-lead electrocardiograph made by Nihon Kohden Corporation) and a personal computer (PC). The electrocardiograph acts as a data acquisition module and is connected to the PC with a dedicated USB cable. The sample frequency was set to 500 Hz, the cutoff frequency of the anti-aliasing filter was set to 75 Hz, and the switches of baseline drift suppression and EMG interference suppression were both set on.
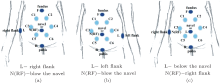
For aECG collecting, three schemes of electrode placement were designed for ten electrodes, as illustrated in Fig. 1. In these schemes, six electrodes, which are originally thoracic electrodes, labeled from C1 to C6, were placed on six vertices of the hexagon, inscribed in a circumference with the pregnant woman's navel as its center and 10 cm as its radius, keeping fixed at these locations for each pregnant woman. Among the remaining four electrodes, which were originally limb electrodes, the electrodes labeled as F and R were fixed at the uterus fundus and pubic, respectively, for three schemes, while the other two labeled as L and N(RF) have different positions, as shown in Figs. 1(a)– 1(c).
 | Fig. 1. Three placement schemes for the ten electrodes. |
The experimental steps were as follows: (i) let the woman lie down on a bed and clean her abdominal skin with alcohol and apply saline water at the positions where the electrodes will be pasted (the purpose of this step is to remove the grease on the skin and enhance the conductivity of the electrodes); (ii) place the ten electrodes according to Figs. 1(a)– 1(c) respectively, and for each placement scheme, record 1– 2 groups of data with a duration of 24 seconds.
Experiments were carried out on 78 pregnant women in the Obstetrics Branch of Nanjing General Hospital of Nanjing Military Command. All together, 343 groups of aECG records have been collected. Among them, 300 groups were acquired from those pregnant women with fetuses in cephalic head position and 43 groups from those with fetuses in breech position. In this paper, these 343 groups of data composed the original aECG database.
Each group of data recorded by the electrocardiograph consists of 8-channel aECGs. The corresponding relationship between the channels and the potential differences is presented in Table 1, in which Vc1, Vc2, Vc3, Vc4, Vc5, and Vc6 denote corresponding electrode potentials respectively, and VWT stands for the potential for the Wilson central terminal, expressed as

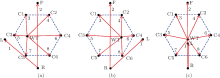
In fact, every channel records the projection of the vector of the cardiac electric activities on this channel. Therefore, we illustrate the channel direction in Fig. 2.
| Table 1. Corresponding relationship between channel indices and electrode potential differences. |
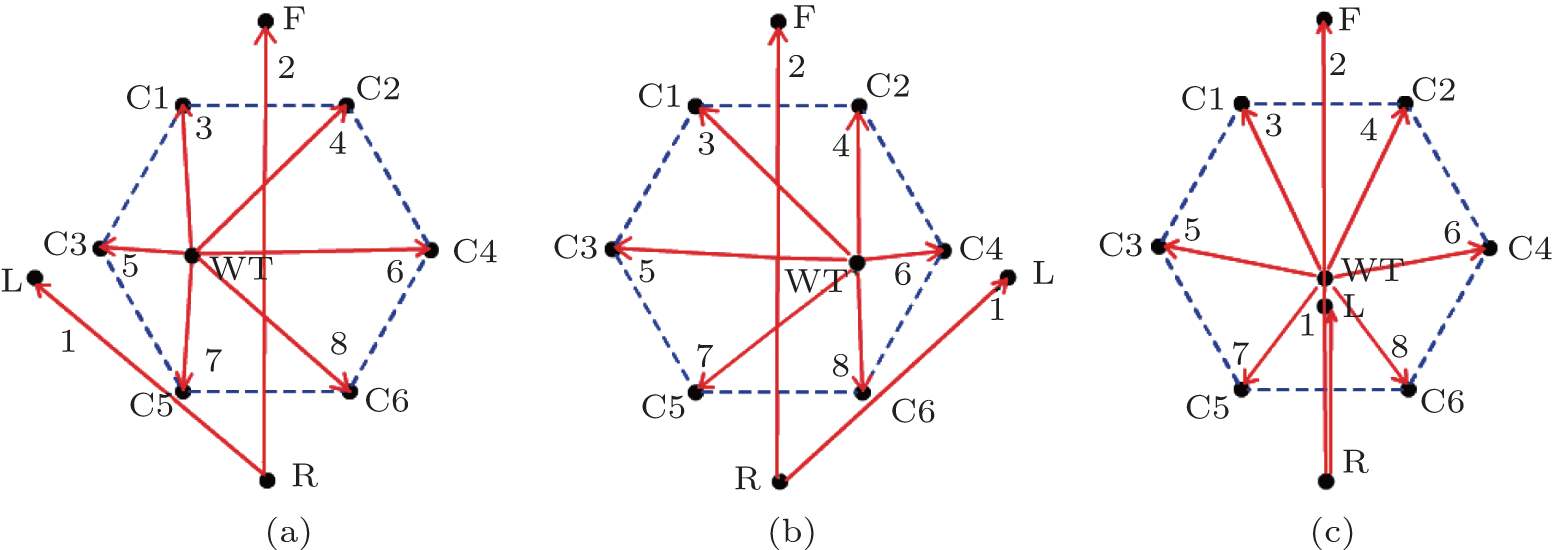 | Fig. 2. Direction diagrams of all eight channels corresponding to the (a) first, (b) second, and (c) third electrode placement schemes in Fig. 1. The numbers from 1 to 8 represent the channel indices in Table 1, respectively. |
Since the position of electrode L, included in the channel 1, is not fixed, the aECG of channel 1 was not considered in this paper. Besides, the directions of channel 3 to channel 8 change with the position variation of WT and they cannot evenly cover the whole maternal abdomen no matter which scheme is taken.
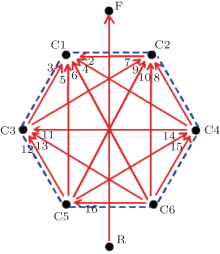
To break through the limitation of the original signals, a channel number expanding process was then performed. That is, for channel 3 to 8, the differential between every two original channels was calculated and thought of as a new channel. Thus, we can get fifteen new channels in all. In addition to the original channel 2, we finally form an extended database with 16 channels. The corresponding relationship between the 16 channels and the electrode potential is presented in Table 2, and the directions of the channels are illustrated in Fig. 3. It is clear that the channel expanding scheme excludes the influence from WT and can evenly cover the abdominal surface in various directions.
| Table 2. Corresponding relationship between the channel indices and the electrode potential differences for the extended abdominal ECG database. |
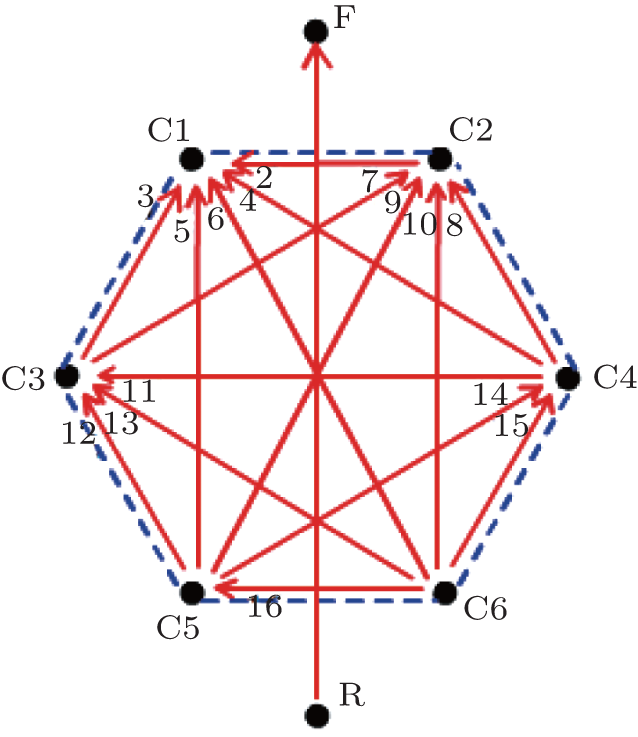 | Fig. 3. Directions of the extended channels. Numbers from 1 to 16 represent the corresponding channel indices in Table 2. |
As is known to all, in most fetal ECG separation algorithms, the maternal component is first removed from the abdominal ECG and then the fetal ECG is separated in the remaining components.[8, 10, 18– 21] The specific algorithm in our paper is based on Refs. [8] and [10], and the corresponding steps are illustrated in Fig. 4.
In this paper, the fECG SNR is defined as follows:
Here, aECG(n) (n= 1, … , N) is the original recorded abdominal ECG series, mECG(n) (n= 1, … , N) is the extracted maternal ECG series, [22, 23] and fECG(n) (n= 1, … , N) is the separated fetal ECG series.
Based on the specific algorithm in Refs. [8] and [10], we tried to extract the fECG component from each abdominal signal for the extended database, including 343 groups of data in all. Finally, the extractions were successfully conducted on 274 groups of data. Here the “ successfully conducted” means that, for all extended sixteen abdominal signals of one group data, the fetal ECGs are successfully separated out.
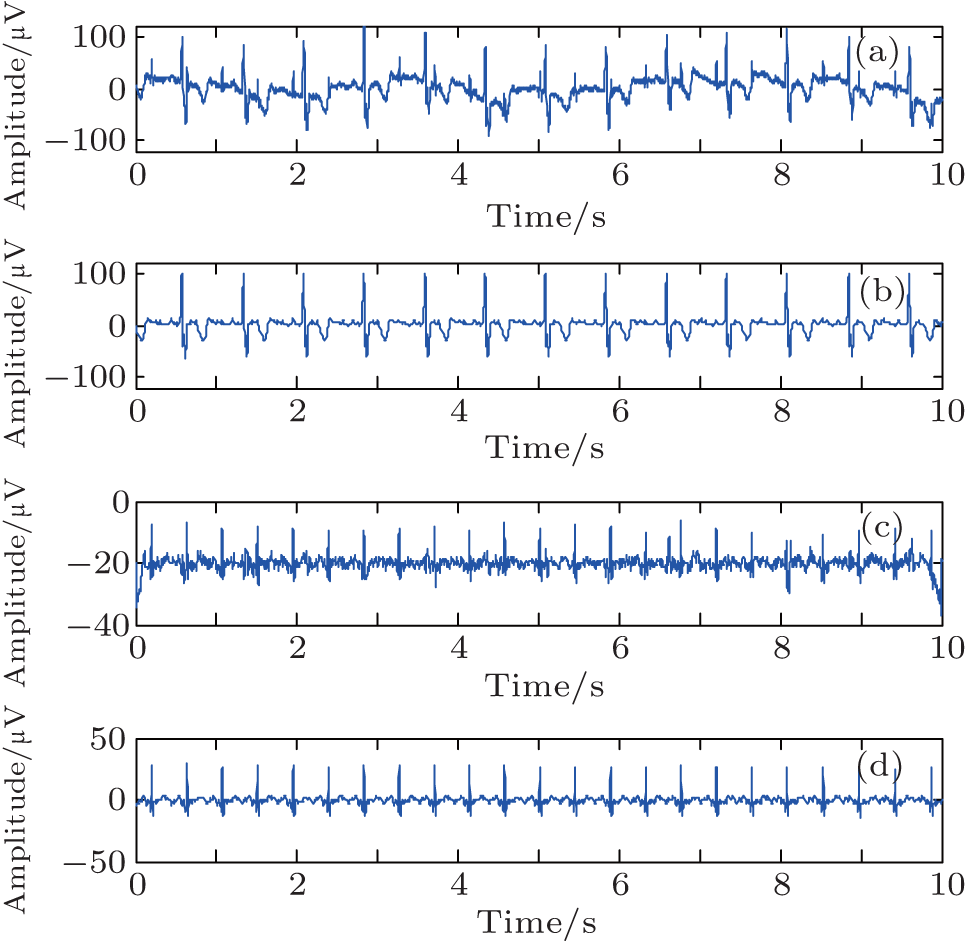 | Fig. 4. Specific processing of fetal ECG separation from abdominal ECG. (a) Abdominal ECG, (b) maternal ECG, (c) the remaining ECG component after the removal of maternal component, (d) fetal ECG. |
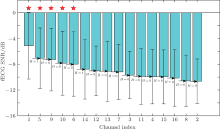
The fECG SNRs for all extended channels of the 274 groups were then calculated, and the results are presented in Fig. 5, in which the horizontal axis represents channel indices and the vertical axis represents the fECG SNR (the boxes stand for mean and the error bars stand for standard deviations). For clarity, the channels are realigned in descending order of fECG SNRs. To test the significance of differences between channels, two-sample T-test was then taken and the results of H are also presented, in which H= 1 indicates a significant difference between two adjacent channels at the 5% level, while H= 0 indicates that there is no significant difference.
From Fig. 5, it can be clearly seen that several channels have significantly higher fECG SNRs. Among them, the channel 1 has the highest fECG SNR with a mean value of -5.10 dB. In addition, the fECG SNRs of channels 1, 5, 9, 10, and 6 are significantly higher than those of the other channels.
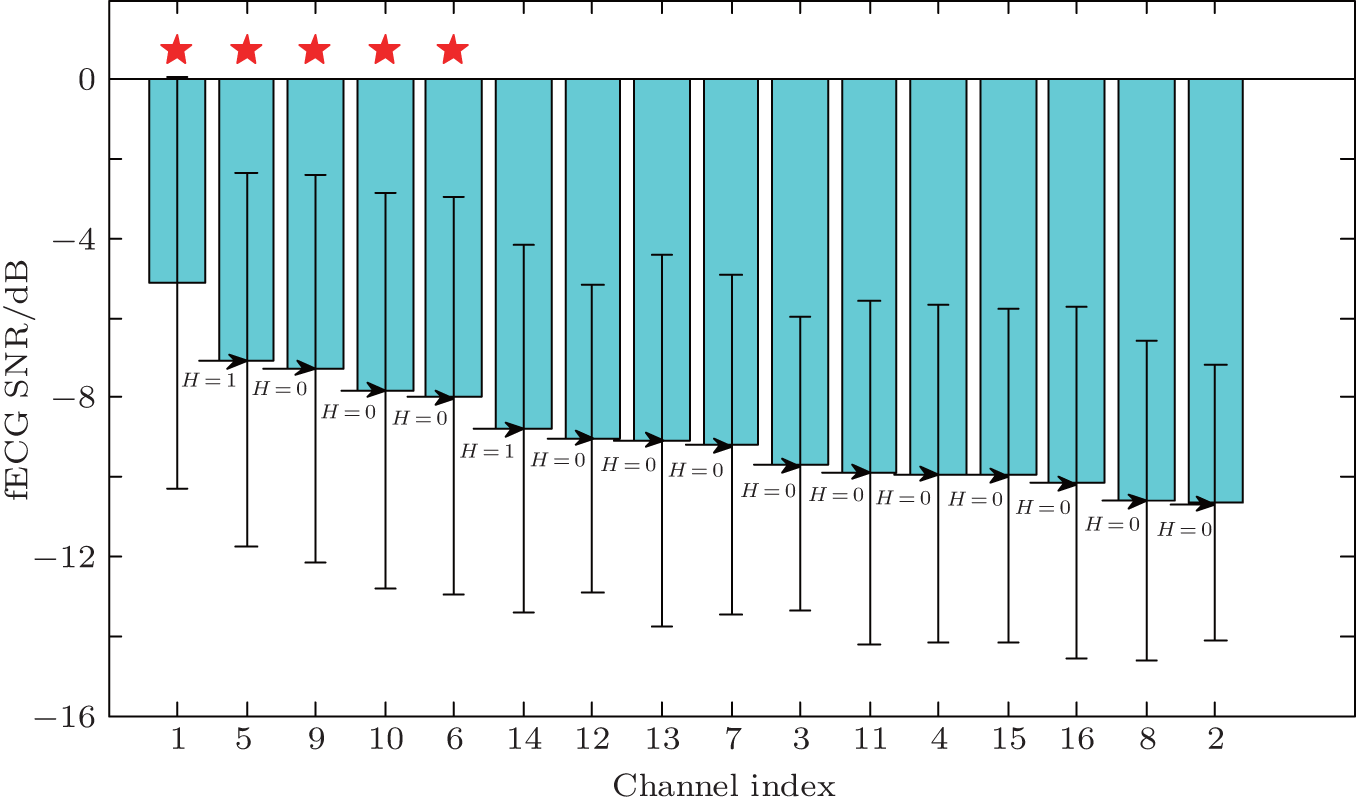 | Fig. 5. Statistics of the mean value and the standard deviation of fECG SNRs for different channels. For vertical axis of fECG SNR, the boxes stand for mean and the error bars stand for standard deviation. Five asterisk marks mean that the corresponding fECG SNRs are much higher than the other channels. H= 1 indicates the significant difference between two adjacent channels at the 5% level in the two-sample T-test, while H= 0 indicates no significant difference. |
In the above section, why do channels 1, 5, 9, 10, and 6 have much higher fECG SNRs than the rest? And, especially, why does the channel 1 has the highest fECG SNR of all? Perhaps we can explain these problems as follows.
First, the directions of these five channels are basically consistent with the fetal cardiac axis. As we know, the cardiac electric activity can be simplified as a dipole, with a variation in both the orientation and intensity of polarization. Signals picked up from the skin are in fact projections of the polarization vectors on the directions of channels. Since the polarization is time variable, the average orientation of the polarization vectors, known as the cardiac axis, is often considered. Generally, a higher channel amplitude can be achieved when the channel direction is more consistent with the cardiac axis. The typical normal direction of the cardiac axis is considered as moving from the right shoulder to the left leg.
In all our 274 groups of successful fECG exaction data, we know that, 91.6% result from the fetus in a cephalic position and the remaining are in a breech position. Therefore, we take the fetus cephalic position as an example. Figure 6 illustrates the relationship between fetal cardiac axis and channels 1, 5, 9, 10, and 6 under two different cases. In Fig. 6, the solid arrows represent the direction of channel directions with higher fECG SNRs and the dashed arrow represents the direction of the fetal cardiac electrical axis. We can see that in any cases of the fetal cephalic position, the channels with higher fECG SNRs have a feature in common that they are more consistent with the fetal cardiac electrical axis than the rest.
Second, the fact that the channel 1 has the highest fECG SNR of all, we think, comes from the farthest distance for two points F and R of channel 1. The distance between two points F and R is at least 20 cm longer than those of other channels. Although the abdominal surface potentials do come from the same fetal cardiac activity, they will have different phases for different points; i.e., different time delays. The greater the distance of the two points, the more time delays of two point potentials, which will lead to a bigger potential difference amplitude.
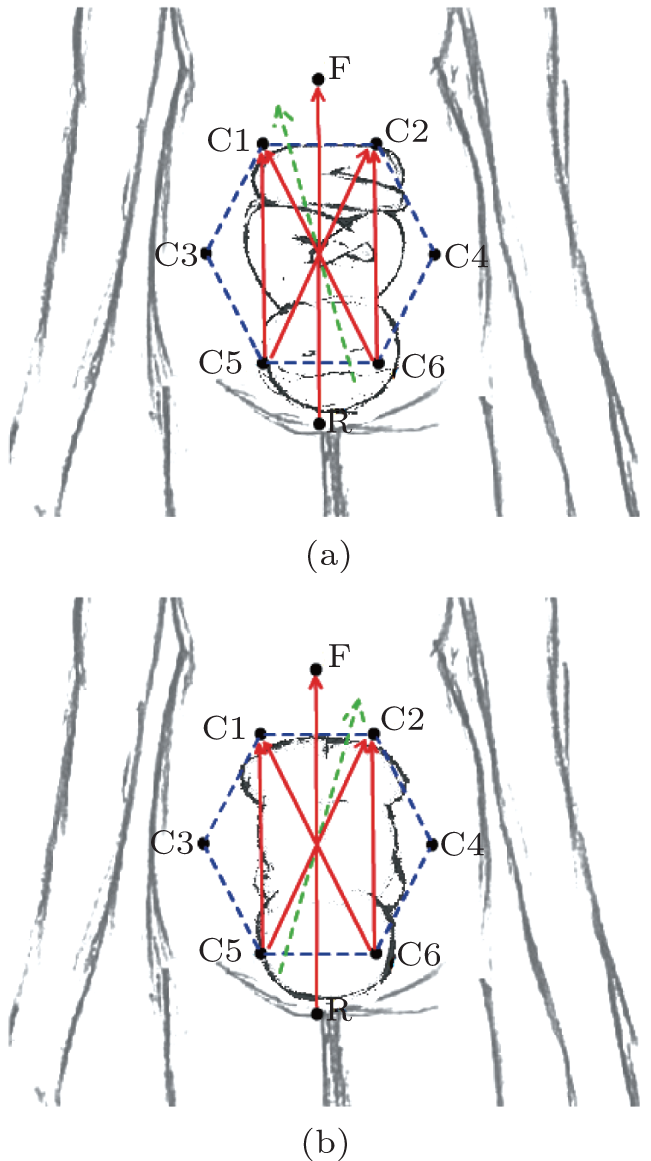 | Fig. 6. Direction relationship between five channels with higher fetal SNR and the fetal cardiac electrical axis in the cases of fetus (a) facing forward and (b) facing backward. The dashed line arrow represents the direction of the fetal cardiac electrical axis and the solid line arrows represent the directions of the five channels. |
In this paper, using a standard 12-lead electrocardiograph, we collected the abdominal ECG signals from 78 pregnant women and then studied the regularity of the fECG SNRs related to electrode locations on the maternal abdominal surface. Consequently, five channels of signals are discovered to have higher fECG SNRs. These five channels also have a feature in common in that the channel directions are more consistent with the fetal cardiac electrical axis than the other channels. On the other hand, the bigger distance between two detecting points may be helpful in acquiring fECG signals with higher fECG SNRs. These findings must provide an important guidance for the placement of the electrode positions when detecting the fetal ECG.
The unique feature of our paper is that the original experimental data were expanded and integrated by the clever use of the difference method. In addition, the statistical result is also reasonably explained by the theories of the fetal cardiac electrical axis and signal phase delay.
A limitation of our work is that we still lack data from the fetus in breech position. To verify its clinical feasibility, more experiments must be conducted to expand the database.
| 1 |
|
| 2 |
|
| 3 |
|
| 4 |
|
| 5 |
|
| 6 |
|
| 7 |
|
| 8 |
|
| 9 |
|
| 10 |
|
| 11 |
|
| 12 |
|
| 13 |
|
| 14 |
|
| 15 |
|
| 16 |
|
| 17 |
|
| 18 |
|
| 19 |
|
| 20 |
|
| 21 |
|
| 22 |
|
| 23 |
|