*Project supported by the National High Technology Research and Development Program of China (Grant No. 2013AA032205), the National Natural Science Foundation of China (Grant No. 51272022), and the Fundamental Research Funds for the Central Universities, China (Grant No. 2012JBZ001).
Abstract
In this work, a simple method to modulate the crystal phase and morphology with a large amount of K+ ions codoping is proposed. The phase changes to the mixture of β-NaYF4 and β-KYF4 with increasing the content of K+ ions to 80 mol%. When it exceeds 80 mol%, β-NaYF4 disappears gradually and β-KYF4 dominates with a poor crystalline. In addition, the morphology changes from nanosphere to nanoplate, and then to nanoprism, which indicates that a higher content of K+ ions favors the growth rates along [0001] than the [10-10] of the nanocrystals. Additionally, the upconversion (UC) luminescence properties and the ratio of red/green (R/G) UC intensity of samples with different phases and morphologies are detected, which makes it possible to tune the UC fluorescence by varying the concentration of K+ ions.
Rare-earth ions doped inorganic materials are a kind of upconversion fluorescence materials which have a great application prospect in many fields, such as three-dimensional (3D) display, [1] UC lasers, [2] bioimaging, [3, 4] therapy, [5] and optical memory[6] due to their unique advantages compared with traditional organic dyes and semiconductor quantum dots, including weak autofluorescence backgrounds, deep penetration abilities, resistance to photobleaching and low toxicity, et al.[7, 8] Among all of these materials, Yb, Er (or Yb, Tm) co-doped fluorides have been reported to be the most efficient upconversion material for green (or blue) emission due to their low phonon energy (∼ 350cm-1), low non-radiative probability, and this accordingly increases the luminescence intensity.[9– 11]
Nowadays, the manipulation of upconversion (UC) nanocrystals with controllable morphologies and sizes remains the research focus because of their great potential in improving the emission intensity, changing emission ratios, and tuning the multi-color luminescence.[12] So far, many efforts have been dedicated to preparing nanocrystals with multiple morphologies and phases.[13– 16] Traditional methods to achieve phase transformation and morphology tuning usually manipulate several experimental parameters, such as reactant concentration, reaction time, and reaction temperature.[17, 21] The problems faced by these methods mainly concentrate on the higher demand for the reaction conditions and the difficulty in tuning the size over a broad range.
More recently, impurity doping has emerged as an important route to easily change the morphology and phase, which requires only a change of the dopant concentration, whereas it provides tremendous improvements in the control of the phase and morphology. K element is from the same alkali group as Na element, which makes it possible to replace Na with K and this accordingly achieves the precisely architectural manipulation with well-defined morphologies and phases. In fact, in recent years there have been some researches on K+ ions codoping in β -NaYF4 matrix. Typically, Zhao's group[22] reported that the morphology kept microrods, although it increased K+ ions to 85 mol%, that is, almost no morphology changes in this process. Zhang's group[23] and Vishal Kal's group[24] presented the crystal structure and UC emission spectra by K+ ions codoping. However, there is still lack of a systematic study of how the phase and morphology change regularly when the content of K+ ions increases gradually.
Herein, as the focus of this article, we discuss how a regular control over the crystal phases and morphologies of the nanocrystals can be achieved by simply varying the codoped concentration of K+ ions. In addition, we also measure the UC luminescence of the samples with different phases and morphologies.
2 Experimental section
The rare earth chlorides RECl3 (YCl3, YbCl3, and ErCl3, 99.99%), oleic acid (OA, 90%), 1-octadecene (ODE, 90%), ammonium fluoride (NH4F, ≥ 98%), sodium hydroxide (NaOH, 99.99%), potassium hydroxide (KOH, 99.99%), absolute methanol (≥ 99.9%) and cyclohexane (≥ 99.5%) were purchased from Sigma-Aldrich. All of the chemicals were used directly without any further purification.
For a typical synthesis of β -Na(K)YF4:Yb3+ , Er3+ nanocrystals similar to the procedure reported previously, [25] 1-mmol YCl3, YbCl3, and ErCl3 in a ratio of 78:20:2 were added into a 50-ml flask containing 6 ml of OA and 15 ml of ODE. The solution was heated to 160 ° C for 20 min and then cooled down to room temperature. Subsequently, 10-ml methanol solution containing a total of 2.5-mmol NaOH and KOH with corresponding molar ratios and 4-mmol NH4F were added into the flask dropwise, which was stirred for 30 min to ensure that all of the fluoride has been completely consumed. After the methanol was evaporated, the solution was heated to 300 ° C and maintained for 1.5 h. The whole process was protected in an argon environment. The resulting nanocrystals were precipitated by ethanol and washed with ethanol and water several times and then dried at 50 ° C overnight.
Powder x-ray diffraction (XRD) patterns of the samples were performed with a x-ray diffractometer with Cu Kα 1 radiation (λ = 1.540Å ). The morphology and size of the synthesized nanocrystals were characterized by transmission electron microscopy (TEM) using a JEOL-2100F TEM. Scaning electron microscope (SEM) measurements were performed using a Hitachi, S-4800 SEM equipped with the energy dispersive x-ray (EDX) spectrum. UC emission spectra were collected using a 980-nm diode laser (BWT Beijing LTD) as the excitation source and detected by SPEX Fluordlog-3 Fluorescence Spectrometer from 350– 700 nm. All of these measurements were performed at room temperature.
3 Results and discussion
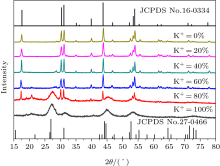
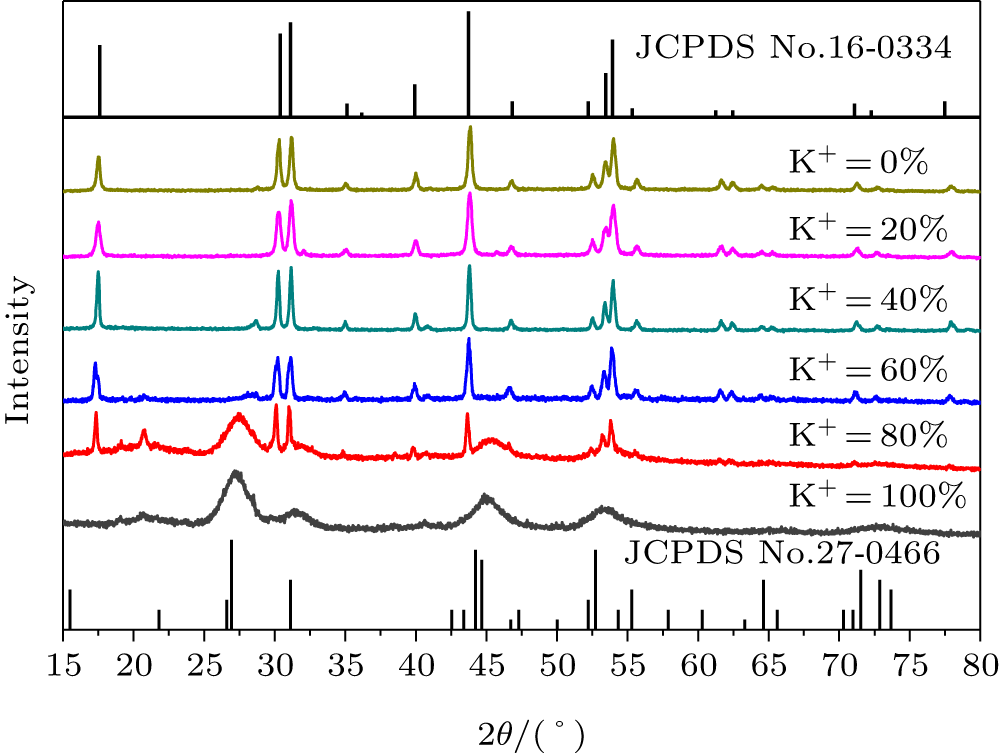
Figure 1 shows the XRD patterns of all as-prepared samples after codoping with x mol% K+ ions (x= 0, 20, 40, 60, 80, 100), respectively. The crystal structure is dominated by the hexagonal NaYF4 until the content of K+ ions exceeds 60 mol%. When the concentration of K+ ions reaches 80 mol%, there are more β -KYF4 nanoparticles formed and β -NaYF4 nanocrystals are no longer dominated. In case of 100 mol% K+ ions, the hexagonal NaYF4 phase disappears and the poor crystalline KYF4 totally exists in the phase. Obviously, the phase transformation from NaYF4 to KYF4 is closely related to the amount of K+ ions codoping. When there are not enough codoped K+ ions to form β -KYF4 hexagonal NaYF4 dominates with a good crystalline. Thereafter, a relatively large amount of K+ ions are doped into the crystal, the imbalance of the intrinsic structure caused by K+ ions plays a role due to K+ ions occupy only the substitution positions of Na+ ions, then β -KYF4 appears. When the remaining Na+ ions are too few to any longer form a stable NaYF4 phase, the KYF4 dominates with poor crystalline.
Fig. 1. XRD patterns of the nanocrystals codoped with different contents of K+ ions and the standard data of β -NaYF4 (JCPDS No. 16-0334) and β -KYF4 (JCPDS No. 27-0466).
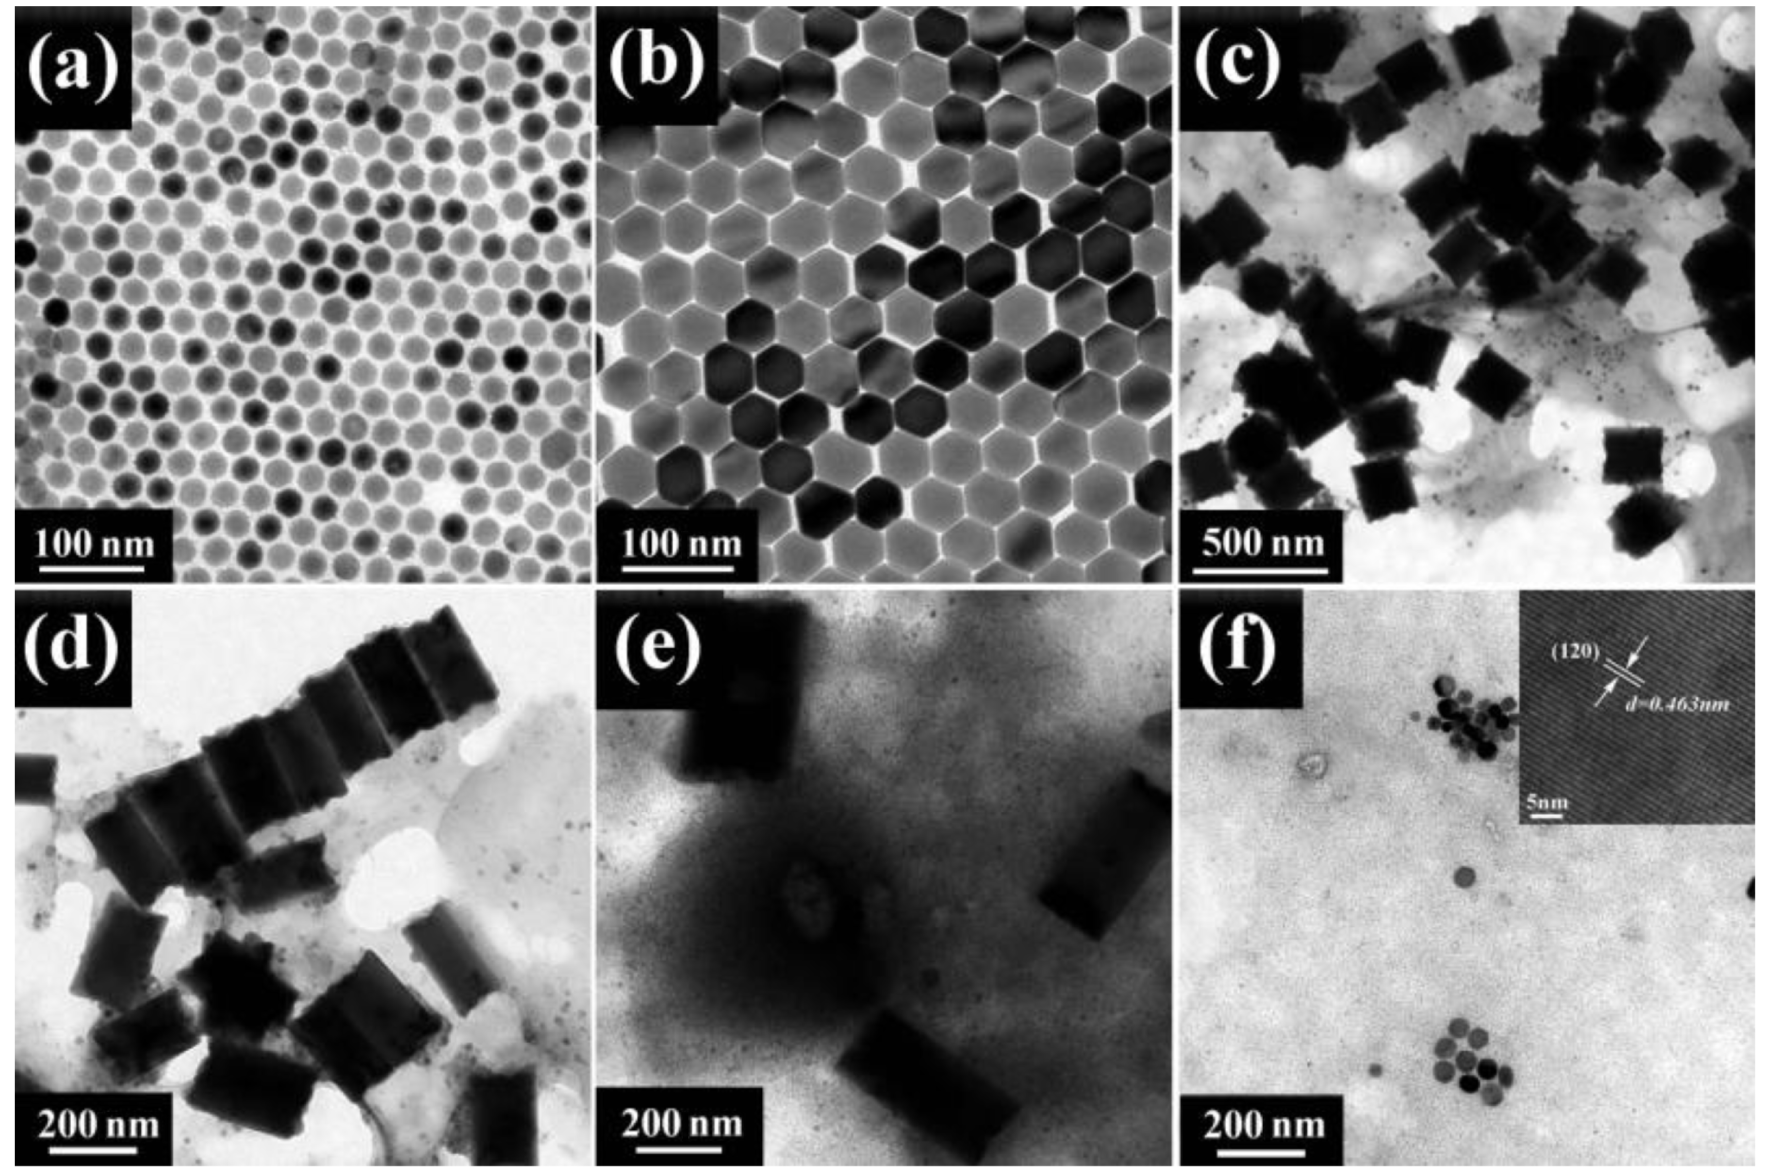
The effect of the amount of K+ ions on the morphology and size has been investigated by TEM, as shown in Fig. 2. Spherical nanoparticles with an average diameter of about 26 nm are obtained when there is no K+ introduced (Fig. 2(a)). As the content of K+ ions increase to 20 mol%, most of the nanocrystals are uniform in size with a regular hexagonal cross-section (Fig. 2(b)). As the codoped K+ ions continually increase to 40 mol%, the shape turns into a rectangular-like cross-section with uneven top-bottom surface (Fig. 2(c)) and, subsequently, it remarkably becomes longer along the cross-section with a further increase in K+ ions content to 80 mol% (Figs. 2(d) and 2(e)). For the amount of 80– 100 mol% K+ ions, the spherical hexagonal KYF4 dominates with almost 20 nm (Fig. 2(f)). The inset in Fig. 2(f) presents a typical HRTEM image of β -KYF4 nanocrystals, and it reveals that the as-obtained β -KYF4 nanocrystals are a single crystalline with clear lattice fringes with an interplaner spacing of 0.469 nm, which coincides with the lattice spacing for (012) planes of the β -KYF4 conforming the formation of β -KYF4 nanocrystals.
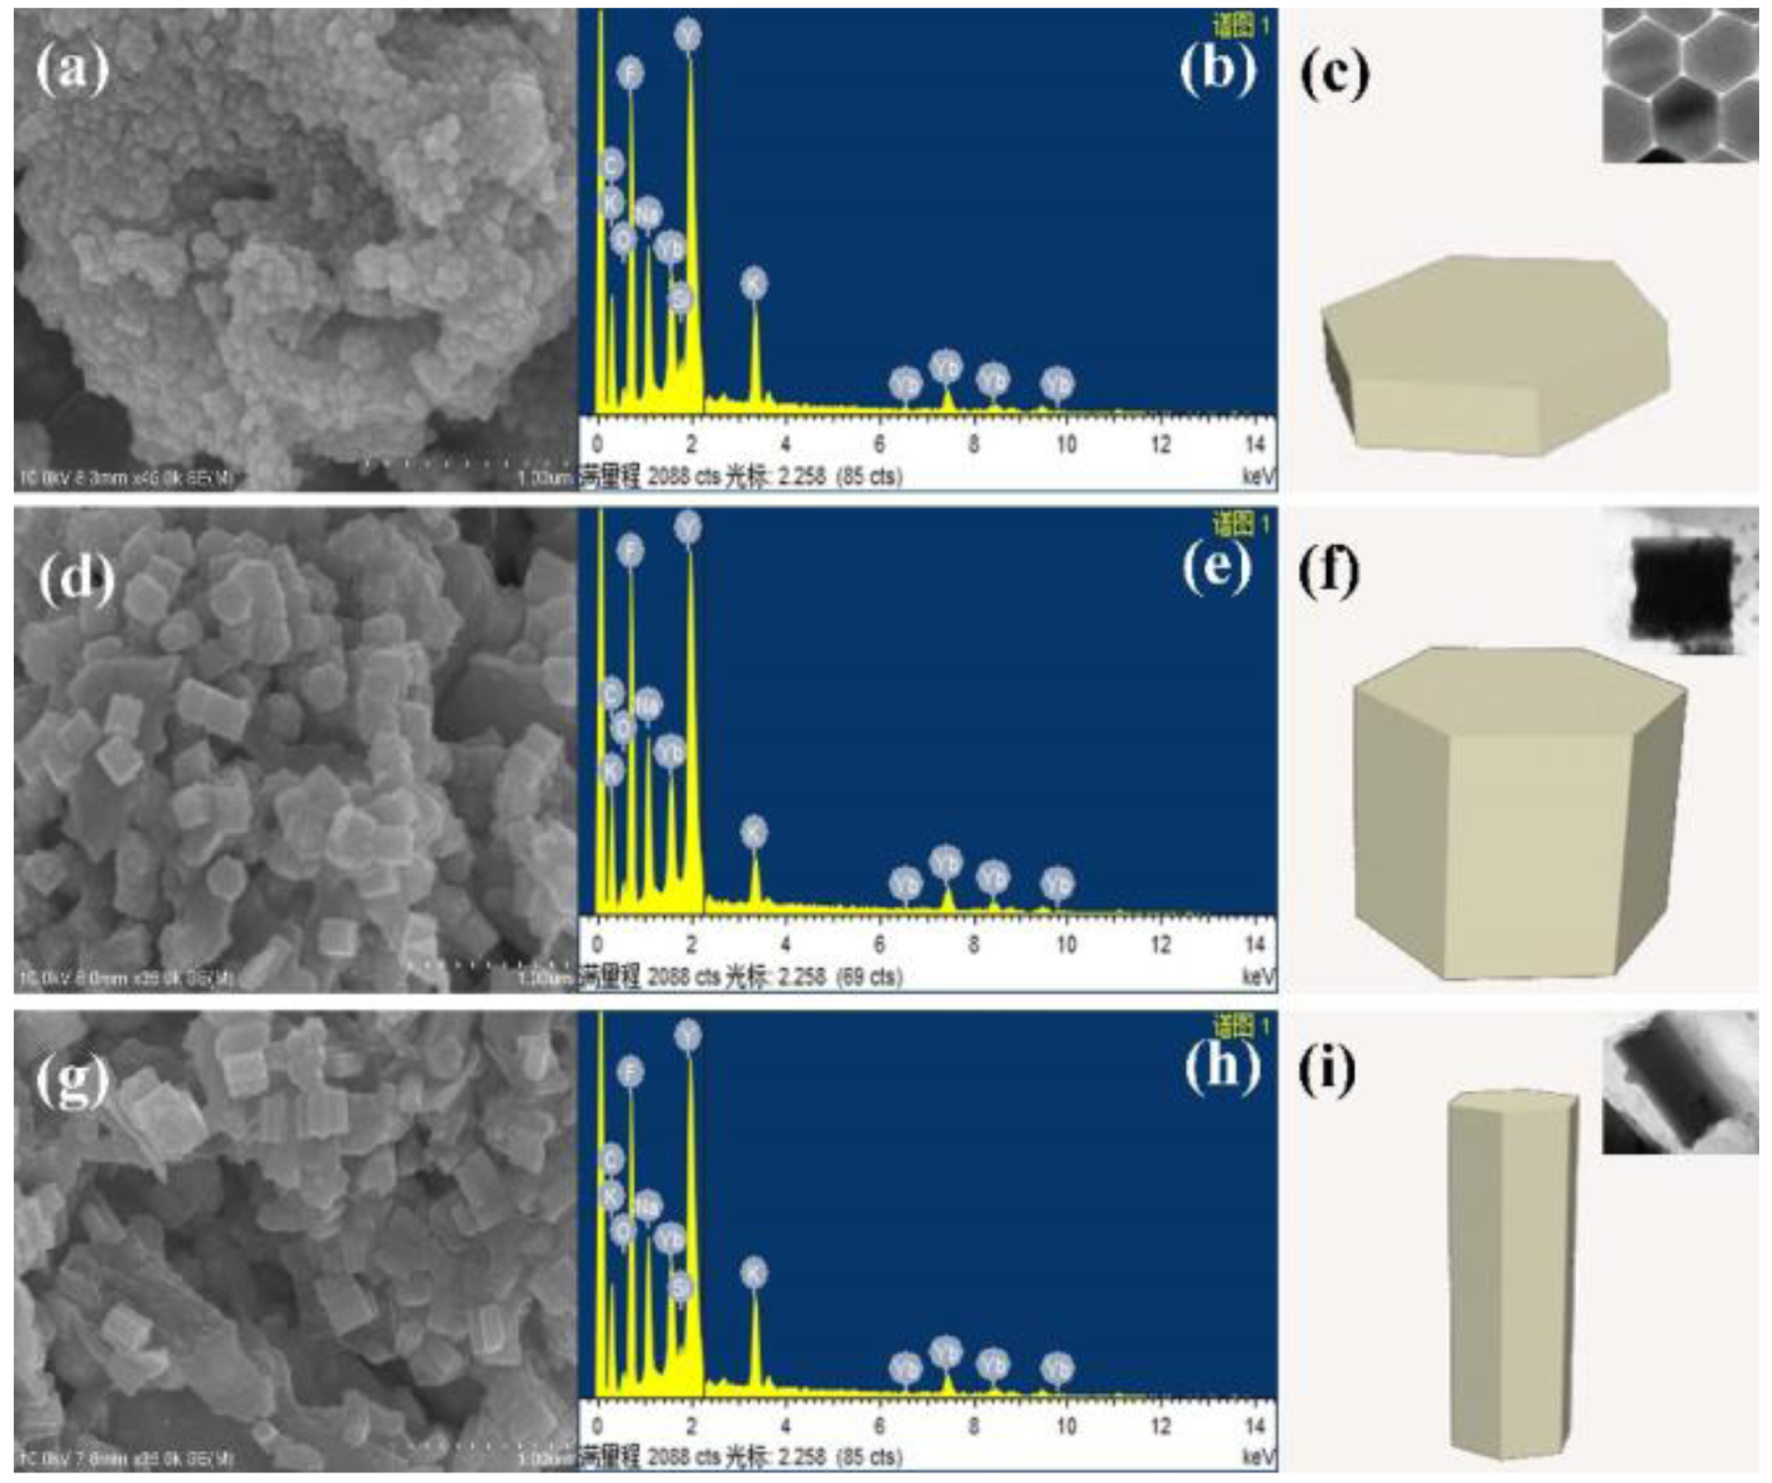
The SEM images present in Fig. 3 can provide further insight into the morphology changes with different codoping content of K+ ions. The regular hexagonal plate-like can be observed with 20 mol% K+ ions (Fig. 3(a)), the shape then changes from nanoplate to nanoprism as the content of K+ ions further increases. These phase transformations from SEM images are consistent with the results shown in the TEM images. The energy dispersive x-ray spectroscopy (EDX) results (Figs. 3(b), 3(e), and 3(h)) reveal that the samples are mainly composed of Na, K, Y, Yb, Er, which coincide with the initial elements.
Fig. 3. SEM, EDX images, and schematic structures: (a)– (c) 20 mol% K+ ions, (d)– (f) 20 mol% K+ ions, and (g)– (i) 20 mol% K+ ions.
The schematic structures (Figs. 3(c), 3(f), and 3(i)) concretely display the morphology changes. As is well known, the surfaces of hexagonal nanoprisms consist of {0001} top/bottom planes and six energetically equivalent {10-10} families of prismatic side planes.[26] The anisotropic structures of the thermodynamically stable hexagonal NaYF4 nanoparticles induce anisotropic growth along their crystallographically reactive directions, which results in anisotropic shapes of the nanocrystals.[27] According to the Gibbs– Thompson theory, the relative chemical potential of a crystal is proportional to its surface-atom ratio, which is determined by the average number of dangling bonds per atom over the whole crystal.[28] The capping effect of F- can decrease the average number of dangling bonds and further decrease the chemical potential of the crystal.[29] With an increase in the content of K+ ions, the amount of Na+ ions combined with F- gradually decreases, while the amount of Y3+ ions keeps constant. Detailed observation on the crystal structure of β -NaYF4 revealed that the density of Y3+ on the {10-10} is higher than that on the {0001} planes. Therefore, there are more Y3+ ions attaching to the six equivalent {10-10} faces when more Na+ ions are replaced by K+ ions, which results in the capping effect of F- on the {10-10} plane being greater than on the {0001} plane. So the chemical potential of {10-10} plane decreases while that of the {0001} plane increases accordingly. Consequently, the growth rate of the nanocrystals along the {0001} is much quicker than that along the {10-10} , therefore the morphologies from nanoplate to nanoprism, and then to nanorod have been produced. In addition, fast growth on the edges rather than in the center leads to an uneven top-bottom surface.
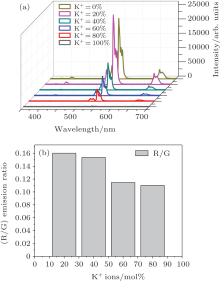
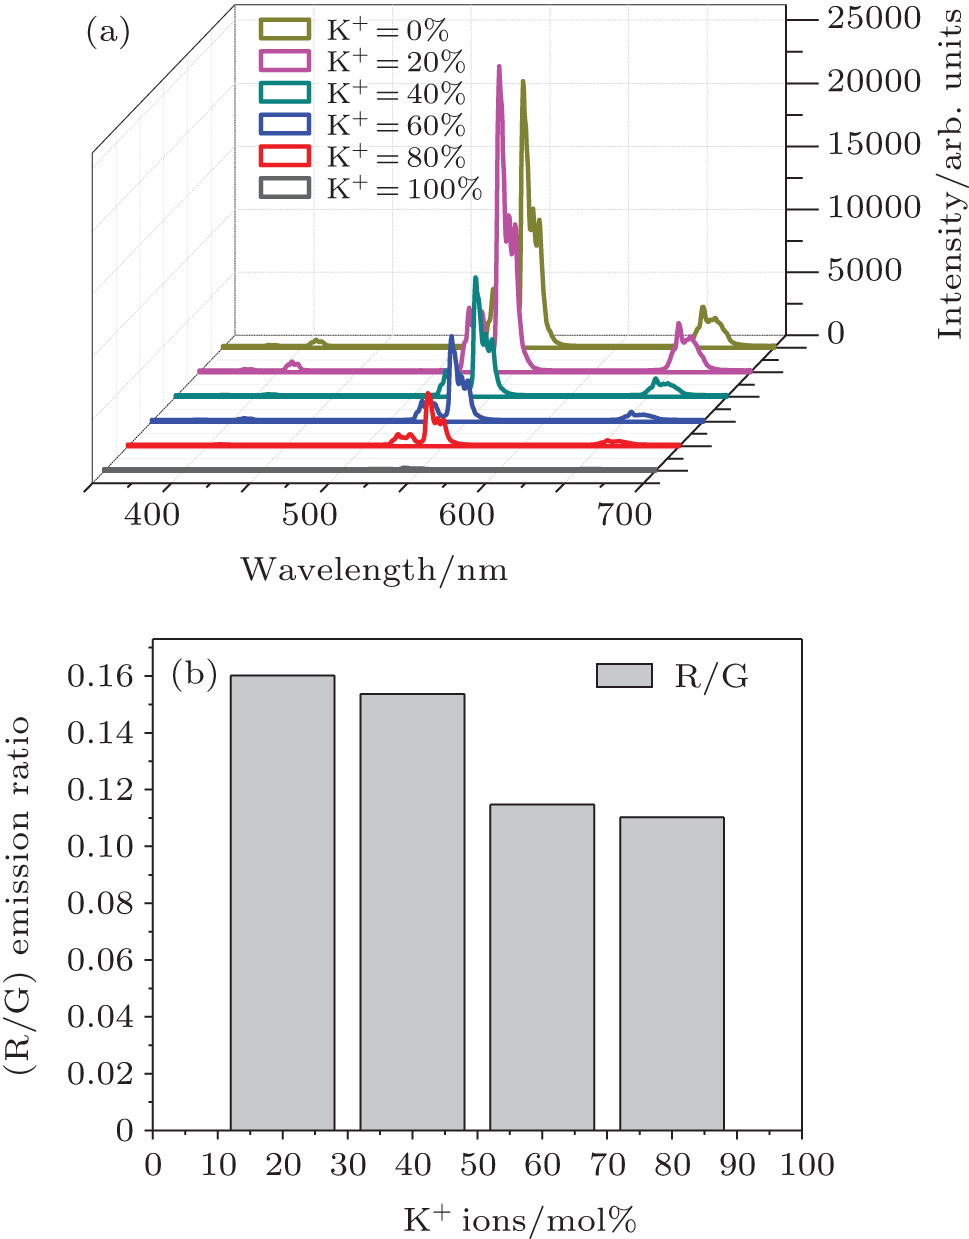
The UC luminescence spectra of the synthesized nanoparticles were measured at room temperature under 980-nm excitation, as shown in Fig. 4(a). For all of the samples, the sample with 20 mol% K+ ions shows the maximum UC luminescence intensity in comparison with the others under the same condition. Thereafter, the UC intensity starts to decrease with further increase of the content of K+ ions. Such an enhancement in UC luminescence intensity may be caused by two factors. One is that the local crystal field could be tailored when introducing K+ ions into the NaYF4 matrix, which may decrease the intrinsic symmetry around Er3+ ions. According to previous reports, [32, 33] lower crystals field symmetry will lead to an increase in the electric dipole transition probability and thereby enhances the UC intensity. But with more K+ ions codoped into the host materials, the symmetry around the environment of Er3+ ions is gradually better, giving rise to the decreased UC emission intensity. In this work, when the concentration of K+ ions equals to 20 mol%, the crystal field symmetry is the lowest, therefore 20 mol%K+ ions shows the maximum UC intensity. The other factor is that the distance between Yb3+ - and Er3+ ions changes when introducing a large amount of K+ ions. In the starting materials, the Na/R ratio decreases in the NaYF4 lattice as the content of K+ ions increases to 20 mol%. This may decreases the distance between Yb3+ and Er3+ ions, which contributes to the easy energy transfer. However, with a further increase of K+ ions to 40 mol%, the close distance between rare-earth ions, which is too close, results in the concentration quenching, which decreases the UC emission intensity.
It is worth noting that such a comparison of emission intensity does not make much sense, although the samples present different UC emission[32] because the phase and morphology change a lot after codoping with different concentrations of K+ ions, which affects the scattering and absorption of incident light. In addition, the number of luminescence centers is related to the size of the nanocrystals. However, it is difficult to satisfy the same luminescence center. When the intensity is normalized according to the green emission peak at 541 nm, the value of Ired/Igreen decreases as the amount of K+ ions increases, as shown in Fig. 4(b). This may be attributed to the fact that more electrons go to the splitting 4I11/2 of Er3+ caused by the changed crystal lattice with K+ ions codoped, leading to an increased chance that the electrons on this level are further excited to the 4F7/2, and at last an enhanced green emission.[23]
Fig. 4. (a) UC emission spectra of the samples with different concentrations of K+ ions. All of them are measured under the same conditions. (b) Red-to green (R/G) emission ratios as a function of the content of K+ ions.
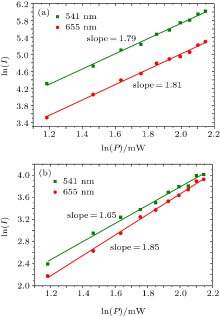
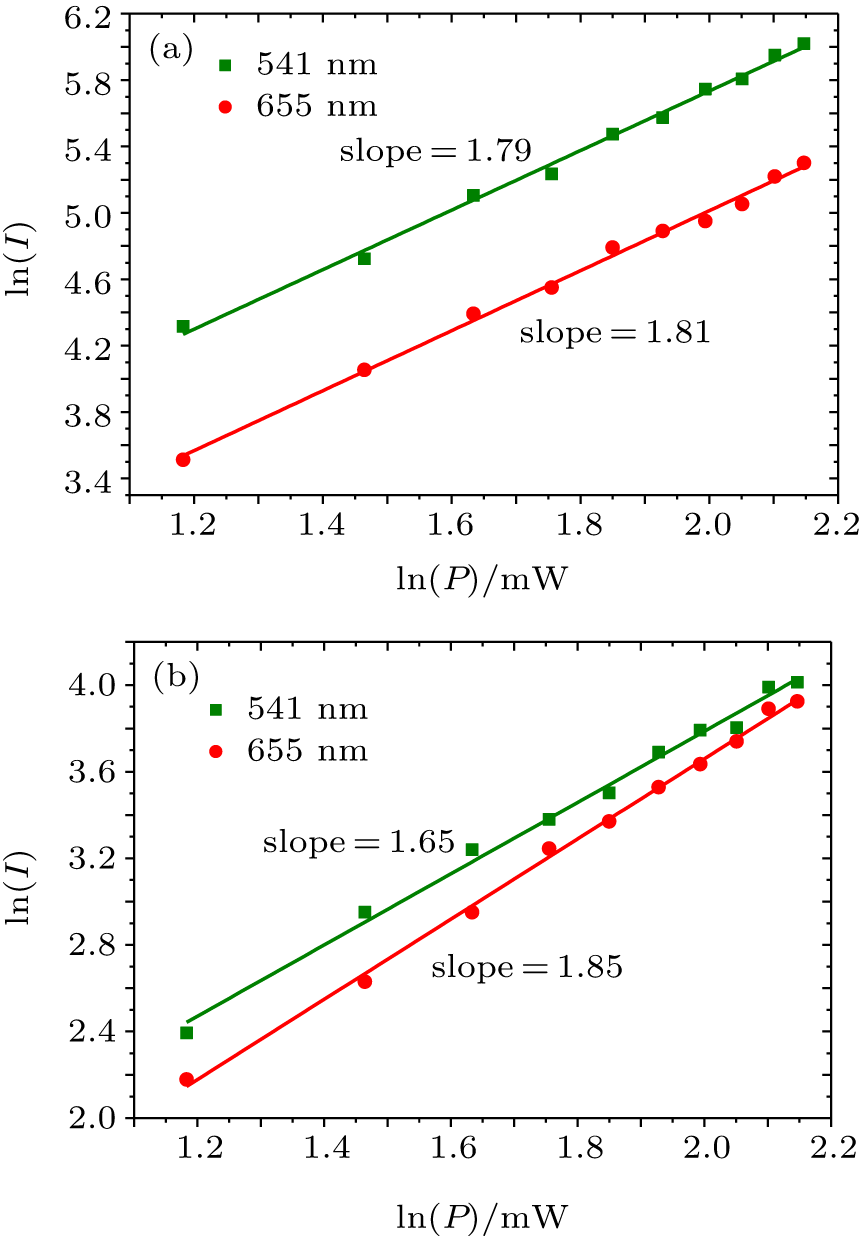
The UC luminescence intensities were measured as a function of the pump power for β -NaYF4:Yb3+ , Er3+ and β -KYF4:Yb3+ , Er3+ nanocrystals in order to determine the number of photons responsible for the UC mechanism.[34] For an unsaturated UC process, the emission intensity (I) is proportional to the excitation power (P): I = Pn, in which n is the number of pump photons required.[31] As shown in Fig. 5, the slopes n are 1.79 and 1.81 for the green and red emissions, respectively, for the NaYF4:Yb3+ , Er3+ nanocrystals. Likewise, for the KYF4:Yb3+ , Er3+ nanocrystals, the values n are 1.65 and 1.85 for the green and red emissions, respectively. This means that the green and red emissions for both of the samples are two-photon processes.
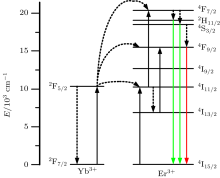
Fig. 6. A schematic diagram of UC process under 980-nm excitation.
Combined with the schematic diagram of UC process in Fig. 6, we can deduce the UC mechanism easily. In short, two successive energy transfers from Yb3+ ions can excite Er3+ ions to the 4F7/2 level, then the Er3+ ions relax to the 2H11/2 and 4S3/2 levels due to the non-radiative process, followed with the green emission. The red emission of the 4F9/2 level can also be populated either from the upper 2H11/2 and 4S3/2 level by non-radiative process, or through the non-radiative relaxtion from 4I11/2 to 4I13/2, then the 4I13/2 level of Er3+ ions absorb an energy from excited Yb3+ ions, and are thereby excited to the 4F9/2 level.[35]
4 Conclusions
In summary, we have successfully synthesized K+ ions codoped β -NaYF4:Yb3+ , Er3+ nanocrystals. Systematic manipulation of the phase and morphology has been achieved by simply tuning the content of K+ ions. It turns out that a higher content of K+ ions favors the growth rates along [0001] than the [10-10] ofβ -NaYF4:Yb3+ , Er3+ nanocrystals, which results in the morphology tuning from nanosphere to nanoplate, and then to nanoprism and the phase transformation from β -NaYF4 to β -KYF4. Additionally, the samples present a strong green emission under 980-nm excitation. This is a facile strategy to tuning the phase and morphology, which is helpful for further crystal-design and morphology-controlled synthesis of other nanocrystals.[36] Moreover, these obtained products present different emission spectra, which makes it possible to tune the UC fluorescence of the nanocrystals. The emission spectra tuning will enable these UC nanomaterials to offer promising application prospects in many fields, such as 3D displays, solar cells, and multiplexing bioassays.
... IntroductionRare-earth ions doped inorganic materials are a kind of upconversion fluorescence materials which have a great application prospect in many fields, such as three-dimensional (3D) display,[1] UC lasers,[2] bioimaging,[3,4] therapy,[5] and optical memory[6] due to their unique advantages compared with traditional organic dyes and semiconductor quantum dots, including weak autofluorescence backgrounds, deep penetration abilities, resistance to photobleaching and low toxicity, et al ...
1
2007
2.144
0.0
... IntroductionRare-earth ions doped inorganic materials are a kind of upconversion fluorescence materials which have a great application prospect in many fields, such as three-dimensional (3D) display,[1] UC lasers,[2] bioimaging,[3,4] therapy,[5] and optical memory[6] due to their unique advantages compared with traditional organic dyes and semiconductor quantum dots, including weak autofluorescence backgrounds, deep penetration abilities, resistance to photobleaching and low toxicity, et al ...
1
2004
14.829
0.0
... IntroductionRare-earth ions doped inorganic materials are a kind of upconversion fluorescence materials which have a great application prospect in many fields, such as three-dimensional (3D) display,[1] UC lasers,[2] bioimaging,[3,4] therapy,[5] and optical memory[6] due to their unique advantages compared with traditional organic dyes and semiconductor quantum dots, including weak autofluorescence backgrounds, deep penetration abilities, resistance to photobleaching and low toxicity, et al ...
1
2009
6.378
0.0
... IntroductionRare-earth ions doped inorganic materials are a kind of upconversion fluorescence materials which have a great application prospect in many fields, such as three-dimensional (3D) display,[1] UC lasers,[2] bioimaging,[3,4] therapy,[5] and optical memory[6] due to their unique advantages compared with traditional organic dyes and semiconductor quantum dots, including weak autofluorescence backgrounds, deep penetration abilities, resistance to photobleaching and low toxicity, et al ...
1
2012
22.864
0.0
... IntroductionRare-earth ions doped inorganic materials are a kind of upconversion fluorescence materials which have a great application prospect in many fields, such as three-dimensional (3D) display,[1] UC lasers,[2] bioimaging,[3,4] therapy,[5] and optical memory[6] due to their unique advantages compared with traditional organic dyes and semiconductor quantum dots, including weak autofluorescence backgrounds, deep penetration abilities, resistance to photobleaching and low toxicity, et al ...
1
2009
10.677
0.0
... IntroductionRare-earth ions doped inorganic materials are a kind of upconversion fluorescence materials which have a great application prospect in many fields, such as three-dimensional (3D) display,[1] UC lasers,[2] bioimaging,[3,4] therapy,[5] and optical memory[6] due to their unique advantages compared with traditional organic dyes and semiconductor quantum dots, including weak autofluorescence backgrounds, deep penetration abilities, resistance to photobleaching and low toxicity, et al ...
1
2004
41.298
0.0
... [7,8] Among all of these materials, Yb, Er (or Yb, Tm) co-doped fluorides have been reported to be the most efficient upconversion material for green (or blue) emission due to their low phonon energy (#cod#x223C ...
1
2011
0.0
0.0
... [7,8] Among all of these materials, Yb, Er (or Yb, Tm) co-doped fluorides have been reported to be the most efficient upconversion material for green (or blue) emission due to their low phonon energy (#cod#x223C ...
To investigate the upconversion emission, this paper synthesizes Tm 3+ and Yb 3+ codoped Y 2 O 3 nanoparticles, and then coats them with TiO 2 shells for different coating times.The spectral results of TiO 2 coated nanoparticles indicate that upconversion emission intensities have respectively been enhanced 3.2, 5.4, and 2.2 times for coating times of 30, 60 and 90 min at an excitation power density of 3.21× 10 2 ~W.cm 2 , in comparison with the emission intensity of non-coated nanoparticles. Therefore it can be concluded that the intense upconversion emission of Y 2 O 3 :Tm 3+ , Yb 3+ nanoparticles can be achieved by coating the particle surfaces with a shell of specific thickness.
a Department of Material Physics and Chemistry,School of Material Science and Engineering, Harbin Institute ofTechnology, Harbin 150001, China; b Department of Material Physics and Chemistry,School of Material Science and Engineering, Harbin Institute ofTechnology, Harbin 150001, China;Center of Electron Microscope Technology, MudanjiangMedical College, Mudanjiang 157011, China
To investigate the upconversion emission, this paper synthesizes Tm 3+ and Yb 3+ codoped Y 2 O 3 nanoparticles, and then coats them with TiO 2 shells for different coating times.The spectral results of TiO 2 coated nanoparticles indicate that upconversion emission intensities have respectively been enhanced 3.2, 5.4, and 2.2 times for coating times of 30, 60 and 90 min at an excitation power density of 3.21× 10 2 ~W.cm 2 , in comparison with the emission intensity of non-coated nanoparticles. Therefore it can be concluded that the intense upconversion emission of Y 2 O 3 :Tm 3+ , Yb 3+ nanoparticles can be achieved by coating the particle surfaces with a shell of specific thickness.
... [12] So far, many efforts have been dedicated to preparing nanocrystals with multiple morphologies and phases ...
1
2007
4.814
0.0
... [13#cod#x2013 ...
1
2010
6.378
0.0
1
2013
0.0
0.0
1
2010
0.0
0.0
... 16] Traditional methods to achieve phase transformation and morphology tuning usually manipulate several experimental parameters, such as reactant concentration, reaction time, and reaction temperature ...
1
2006
10.677
0.0
... [17,21] The problems faced by these methods mainly concentrate on the higher demand for the reaction conditions and the difficulty in tuning the size over a broad range ...
Metal-insulator-semiconductor back contact has been employed for a perovskite organic lead iodide heterojunction solar cell, in which an ultrathin Al2O3 film as an insulating layer was deposited onto the CH3NH3PbI3 by atomic layer deposition technology. The light-to-electricity conversion efficiency of the devices is significantly enhanced from 3.30% to 5.07%. Further the impedance spectrum reveals that this insulating layer sustains part of the positive bias applied in the absorber region close to the back contact and decreases the carrier transport barrier, thus promoting transportation of carriers.
... [17,21] The problems faced by these methods mainly concentrate on the higher demand for the reaction conditions and the difficulty in tuning the size over a broad range ...
We report a facile oleic acid-assisted hydrothermal route to synthesize NaYF4:Yb/Er crystals doped by alkali ions (Li+ or K+ ions), and the effects of alkali ion doping on the crystal structure and upconversion (UC) fluorescence emission of the NaYF4:Yb,Er crystals are investigated in detail. With the increasing dosage of Li+ ions in the NaYF4:Yb/Er crystals, their morphologies are changed from rod to disk and finally to polyhedron. However, the morphologies of NaYF4:Yb/Er crystals doped with K+ ions almost keep the rod-like shape. In addition, the phase transition of LixNa1-xYF4 crystals initiates when x is equal to or larger than 0.5, but the phase of KyNa1-yYF4 remains unchanged even if y reaches 0.85. Furthermore, the UC emission intensity of NaYF4:Yb/Er crystals reduces with the doping of Li+ ions. On the contrary, the UC emission intensity of NaYF4:Yb/Er crystals increases as K+ ions are introduced. It is interesting that the green and red UC emissions of the K0.7Na0.3YF4:Yb,Er crystal are high 8 and 7 times, respectively. (C) 2013 Published by Elsevier B.V.
Zhao, Lijun 1 ;
... Typically, Zhao's group[22] reported that the morphology kept microrods, although it increased K#cod#x002B ...
2
2011
4.187
0.0
... Zhang's group[23] and Vishal Kal's group[24] presented the crystal structure and UC emission spectra by K#cod#x002B ...
Abstract Quasi-critical fluctuations occur close to critical points or close to continuous phase transitions. In three-dimensional systems, precision tuning is required to access the fluctuation regime. Lowering the dimensionality enhances the parameter space for quasi-critical fluctuations considerably. This enables one to make use of novel properties emerging in fluctuating systems, such as giant susceptibilities, Casimir forces or novel quasi-particle interactions. Examples are discussed ranging from simple metal–adsorbate systems to unconventional superconductivity in iron-based superconductors.
1. Institute of Physical Chemistry, University of Innsbruck, Innrain 52a, 6020, Innsbruck, Austria
... Zhang's group[23] and Vishal Kal's group[24] presented the crystal structure and UC emission spectra by K#cod#x002B ...
1
2008
3.842
0.0
... nanocrystals similar to the procedure reported previously,[25] 1-mmol YCl3, YbCl3, and ErCl3 in a ratio of 78:20:2 were added into a 50-ml flask containing 6#cod#x00A0 ...
1
2007
4.593
0.0
... [26] The anisotropic structures of the thermodynamically stable hexagonal NaYF4 nanoparticles induce anisotropic growth along their crystallographically reactive directions, which results in anisotropic shapes of the nanocrystals ...
1
2007
8.238
0.0
... [27] According to the Gibbs#cod#x2013 ...
1
2007
9.765
0.0
... [28] The capping effect of F- can decrease the average number of dangling bonds and further decrease the chemical potential of the crystal ...
1
2013
0.0
0.0
... [29] With an increase in the content of K#cod#x002B ...
1
2003
3.794
0.0
1
1962
6.583
0.0
... [31] As shown in Fig ...
2
2008
4.814
0.0
... According to previous reports,[32,33] lower crystals field symmetry will lead to an increase in the electric dipole transition probability and thereby enhances the UC intensity ...
... It is worth noting that such a comparison of emission intensity does not make much sense, although the samples present different UC emission[32] because the phase and morphology change a lot after codoping with different concentrations of K#cod#x002B ...
1
2013
0.0
0.0
... According to previous reports,[32,33] lower crystals field symmetry will lead to an increase in the electric dipole transition probability and thereby enhances the UC intensity ...
1
1973
6.911
0.0
... [34] For an unsaturated UC process, the emission intensity (I) is proportional to the excitation power (P): I #cod#x003D ...
1
2003
8.238
0.0
... [35] ...
1
2012
1.148
1.2429
... [36] Moreover, these obtained products present different emission spectra, which makes it possible to tune the UC fluorescence of the nanocrystals ...
Phase transformation and morphology tuning of β-NaYF4:Yb3+,Er3+ nanocrystals through K+ ions codoping*


 , Cui Yue