Frequency detection of self-adaption control based on chaotic theory*
[Xu Yan-Chun, Qu Xiao-Dong† , Li Zhen-Xing]
, Li Zhen-Xing]
|
|


†Corresponding author. E-mail: quxd@hlju.edu.cn
*Project supported by the Talent Scientific Research Foundation of China Three Gorges University (Grant No. KJ2013B079).
Low-order Duffing and high-order Rössler chaotic oscillator are connected together and new self-adaption frequency detection method is presented. The frequency difference control between unknown signal and the periodic driving force is realized in this paper and the self-adaption is obtained. Thus, the detection precision and speed are promoted. The limitation that there are too many chaotic oscillators in Duffing system is broken. Meanwhile the disadvantage that the detection speed is lower in Rössler chaotic control is overcome. The self-adaption choice of frequency difference control is realized using the Duffing and Rössler different chaotic oscillators to obtain unknown signal frequency. The simulation results show that the presented method is feasible and effective.
The technology of weak signal detection is used in many fields, such as electronics, sounds, magnetic, biology, and so on. So far, detecting a weak photoelectrical signal has been a popular topic of research. In an optical system, if the photo source is divided through a polarization beam splitter, the energy is very low.[1– 3] Most are submerged in the noise and the useful signal is weaker than the noise. Therefore, we must detect the weak useful signal from the strong noise in order to know the radiant features of the weak signal well. In recent years, chaos and its applications in complex dynamics have become hot topics of research. Many studies have focused on the generation of chaos. Chaos is widely used in many fields because it is sensitively dependent on its initial value and disturbance. Recently, we have paid more attention to the application of chaotic theory to signal detection. Many experts have proposed detection methods to detect the amplitude and frequency of a weak signal.[4, 5] Most of their methods suppose that the frequency is known. It is only necessary to detect the amplitude of the weak signal. However, these methods are invalid when the frequency is unknown.[6– 8]
Previous studies have shown that when a low-order Duffing chaotic system is used to detect the frequency of a weak photoelectric signal, the system will exhibit intermittent chaotic state, with the frequency difference being Δ w. When Δ w is less than 0.03, the regular intermittent chaotic state will be distinguished. However, when Δ w is larger than 0.03, the error is too large to use this method for detecting the frequency of a weak photoelectric signal.[9, 10] Hence, in order to detect the frequency of a weak signal precisely, a self-adaption frequency detection method based on chaotic theory is presented. Thus, the detection precision and stability will be improved and the detection speed will be increased.
The Duffing equation describes a motion equation of a nonlinear elastic system. In 1918, Duffing proposed the standard kinetic equation through researching a forced vibration system which has a nonlinear restoring force item. After which, Holms et al. investigated the equation deeply, hence this equation is also called Holmes equation. Because the equation’ s order is lower and its structure is simpler, it is applied for weak signal detection.[11, 12]
Let the unknown signal be

where A is the amplitude of useful periodic signal, Δ wis the absolute frequency difference, φ is the phase difference between unknown signal and periodic driving force, and n(t) is the noise signal.
By substituting unknown signal into Duffing equation, we obtain the Duffing equation as
Here, f is the amplitude of periodic driving force.
Equation (2) can be changed into


where F(t) is the amplitude of total driving force, and θ (t) is the initial phase of total driving force.
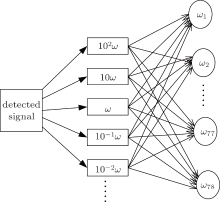
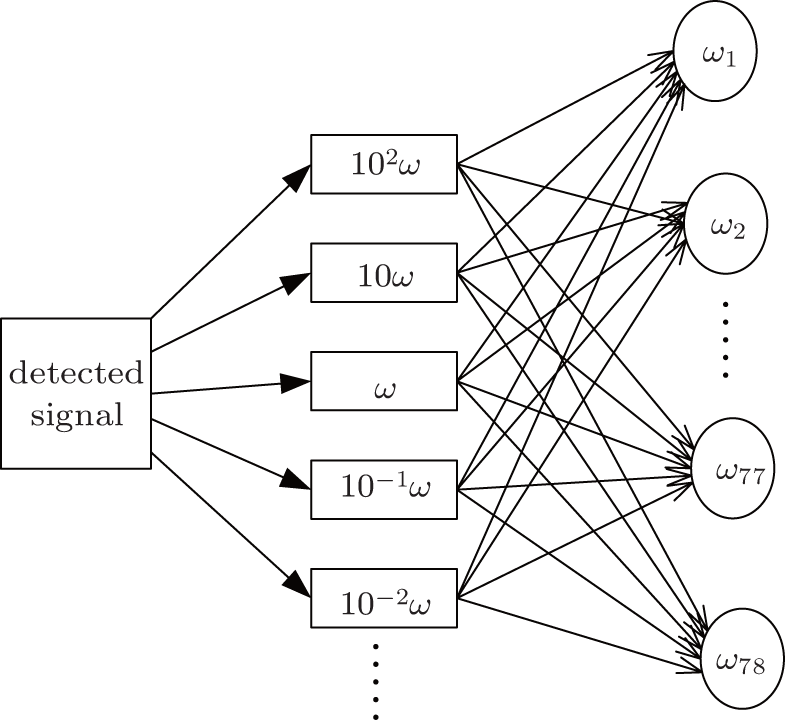
In Eq. (4), f − A ≤ F(t) ≤ f + A. According to the principles of Duffing equation, f is put into around fd. The system will appear to be an intermittent chaotic state under the effect of total driving force. A large number of experiments have shown that if Δ ω is less than 0.03, then the regular intermittent chaotic state will be distinguished. The array will be composed of a geometric sequence with the common ratio being 1.03, namely, w1 = 1 rad/s, w2 = 1.03 rad/s, … , wk = 1.03wk − 1 rad/s, … , w78 = 9.738 rad/s. The intermittent chaotic state will appear in the two adjacent oscillators and then the unknown frequency can be detected. The following conclusion can be obtained.
(i) The unknown frequency and periodic driving force frequency are the same when Δ ω is equal to 0. The unknown frequency can be known through using the frequency of periodic driving force.
(ii) The system will appear to have a tiny deviation when Δ ω is not equal to 0. The system sometimes goes to a periodic state or chaotic state. It often appears to be an intermittent chaotic state.
When the unknown signal goes through the oscillator array, the frequency range of the two adjacent oscillators, in which intermittent chaotic phenomenon takes place, will be between 1 rad/s and 10 rad/s. They are ω k and ω k + 1, respectively. Then, the range of the unknown frequency ω will be

According to the above features, it is supposed that the frequency of the unknown periodic signal is between 1 rad/s and 10 rad/s. The unknown frequency can then be detected. However, if the frequency is not in this range, then the signal frequency has to be processed in advance. Normally the signal will be recorded at speed v, and then it can be emitted at speed 10n (n = … , − 2, − 1, 0, 1, 2, 3, … ). The signal which is emitted again will correspond with the signal between 1 rad/s and 10 rad/s. The original frequency can then be obtained.
The detective flow diagram of the oscillator array method is shown in Fig. 1. The details of the computing method are introduced below. Suppose n = − 3, there will be intermittent chaos at the twentieth oscillator and the twenty-first oscillator. The angle frequency is ω 20 = 1.7535 rad/s and ω 21 = 1.8061 rad/s. The periods of intermittent chaos TΔ 1 and TΔ 2 are 376 s and 178 s, respectively. Therefore, the frequency difference is, respectively, Δ ω 1 = 2π /TΔ 1 = 0.0167 rad/s and Δ ω 2 = 2π /TΔ 2 = 0.0353 rad/s. Finally, the frequency of unknown signal can be calculated, that is, ω = [(ω 20 + Δ ω 1) + (ω 21 + Δ ω 2)]/2 × 102 = 177.05 rad/s. If the number of the chaotic oscillators is increased, then the other frequency range can be detected.
 | Fig. 1. Flow diagram of the oscillator array method. |
The order of the chaotic oscillator is very low in this method and the equations are very simple. Hence, it is more convenient to use and study. However, 78 chaotic oscillators are needed and the oscillator number is too large, thus there is a big limitation.[13]
The Rö ssler system equations are given by
where a, b, and c are the system parameters.
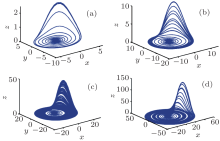
The Rö ssler equation is a three-order self-governing system. There is a nonlinear term xz, which is used to induce the complex dynamics behavior of bifurcation and chaos. The shape of the Rö ssler attractor is shown in Fig. 2 as both of the parameters a and b are equal to 0.2 and the parameter c is different.
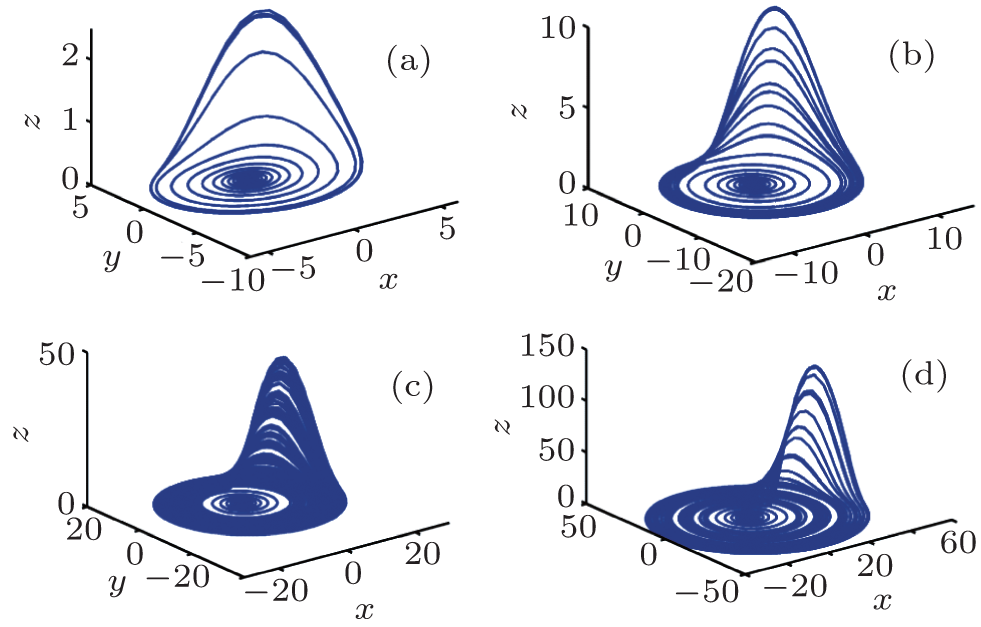 | Fig. 2. Phase diagram of Rö ssler attractor when parameter c is equal to (a) 3, (b) 7, (c) 10, and (d) 30. |
In this theory, the unknown weak signal can be put into one of the three Rö ssler equations and the system dynamic behavior would be changed.[14] In the case of the chaotic critical state, the unknown signal is put into the system, and then the system state will be changed from critical state to chaotic state. At the moment the proportional plus derivative control is used to control the system to stable periodic state and we then use spectral analysis to detect the unknown frequency.
The specific algorithm is described below. (i) Regulate the parameter c of Rö ssler chaos system in order to make it become chaotic critical state. (ii) Put the unknown weak signal with noise into the system and make the system a chaotic state. (iii) Use the above proportional plus derivative control strategy to regulate the parameters in order to make the system change from chaotic state to periodic state. (iv) The unknown signal is included in the output signal after the system is controlled. Then, the spectral analysis is still needed. The unknown weak signal will be checked out.
The proportional and derivative control is used in this method so that the weak photoelectric signal detection is realized. However, the order of Rö ssler system is higher and the control process is more complex, especially to control chaotic dynamic properties from a chaotic state to periodic state, since control is so difficult. The detection speed is lower so that there is still a big limitation.
According to the principle of weak signal frequency detection based on the Duffing chaotic theory, the intermittent chaotic state occurs with a frequency of Δ w. The research results show that the regular intermittent chaotic state can be distinguished when Δ w is less than 0.03. If Δ w is larger than 0.03, then the detection error is too big to use a Duffing chaotic system. Therefore, a Rö ssler chaotic system based on proportional plus differential control strategy can be used to detect the unknown photoelectric signal frequency. However, the Rö ssler chaotic oscillators are of a high order and their dynamic features are complex. Meanwhile, the order is higher and control is so complex. Comparatively speaking, the Duffing system is simpler and the order is lower, so that the computing is more convenient.
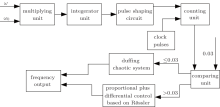
In order to detect weak photoelectric signal frequency commodiously, in this paper the chaotic oscillator self adaption control strategy based on frequency difference control is presented. The functional block diagram is shown in Fig. 3.
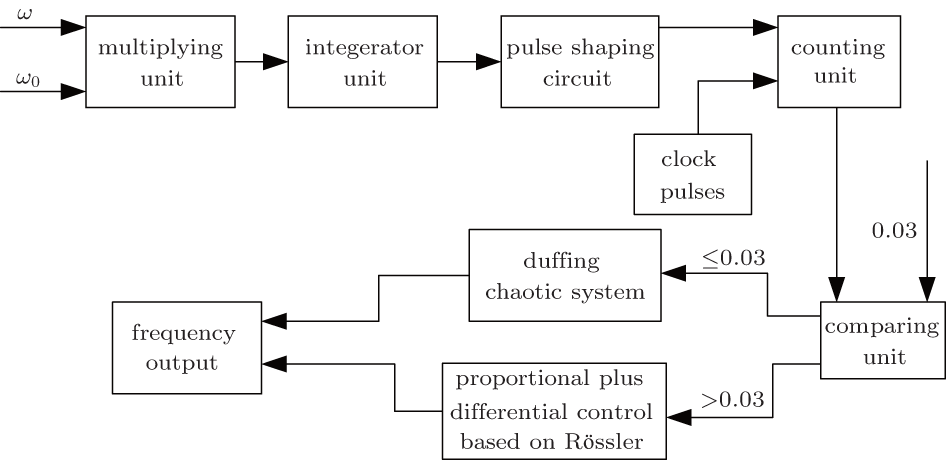 | Fig. 3. Principle diagram of chaos adaptive selection based on frequency deviation control. |
In Fig. 3, the known frequency of the Duffing chaotic periodic force is ω 0 = 2π f0. The unknown frequency is ω = 2π f. We then put the different frequencies into the multiplying unit and then regulate the output signal to become a periodic signal. The changing frequency is just the frequency difference Δ ω . If Δ ω is less than 0.03, then the simple Duffing chaotic system will be selected to detect an unknown frequency. Otherwise, the presented method in this paper will be used. The connection of two methods will make the detection more convenient.
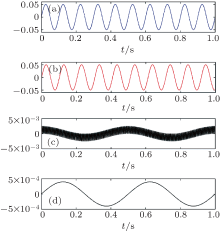
The test waveform diagram is shown in Fig. 4. Figures 4(a) and 4(b) present a sine-shaped input signal of two different frequencies. We put them into multiplying unit and the output signal is shown in Fig. 4(c). We use the above method to detect weak photoelectric signals, i.e., different signal-to-noise ratio, and then to simulate them. The simulation results are compared with Rö ssler and Duffing systems. The results are shown in Table 1.
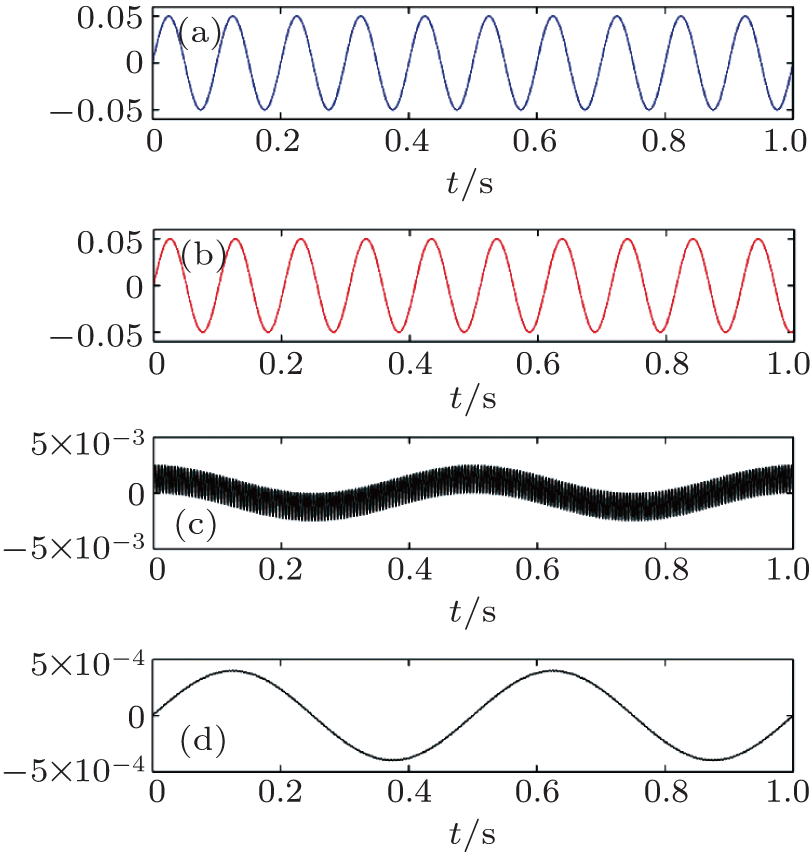 | Fig. 4. Experiment waveform diagram of frequency deviation measurement. (a) Input f0, (b) input f, (c) multiplying unit output, and (d) integerator output. |
| Table 1. Frequency detection results and contrast based on chaos model. |
From the principle diagram (see Fig. 3), we know that the regulated output signal changes periodically as the variation frequency is just the frequency difference Δ f. Therefore, the low-frequency component will be extracted through controlling high-frequency component (see Fig. 4(d)). The accurate frequency difference Δ f can then be obtained through a counting device, which can be output as measured data.
From Table 1, it is shown that the presented method in this paper is feasible. The detection precision is higher and the error is lower. In addition, the method is more convenient and flexible.
In order to verify the stability of the presented method, we carry out many simulations. Suppose that the input signal to noise ratio is − 60 dB and the unknown frequency is 100 rad/s. The simulation results are shown in Table 2.
| Table 2. Stability analysis of frequency detection methods. |
Table 2 obviously shows that the self-adaption frequency detection method based on frequency difference control is stable and the precision is higher. Hence, the method is feasible.
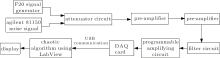
In a real detection test the weak photoelectric signal is usually submerged in the strong noise. In order to simulate the real noise of the system, an Agilent 81150A function signal generator is used and the output signal is white noise. In the test, F20 function signal generator first generates a sine-shaped simulative signal with a peak– peak value of 1 V and a frequency of 1 kHz. We then put the signal into the attenuator circuit, and the peak value becomes 5.7284 × 10− 4 V. Another signal generator will generate white noise with a peak value of 0.5 V. The two signals add repeatedly in order to simulate the real weak photoelectric signal. The signal is put into the preamplifier so that the system can detect it. The detection principle is shown in Fig. 5.
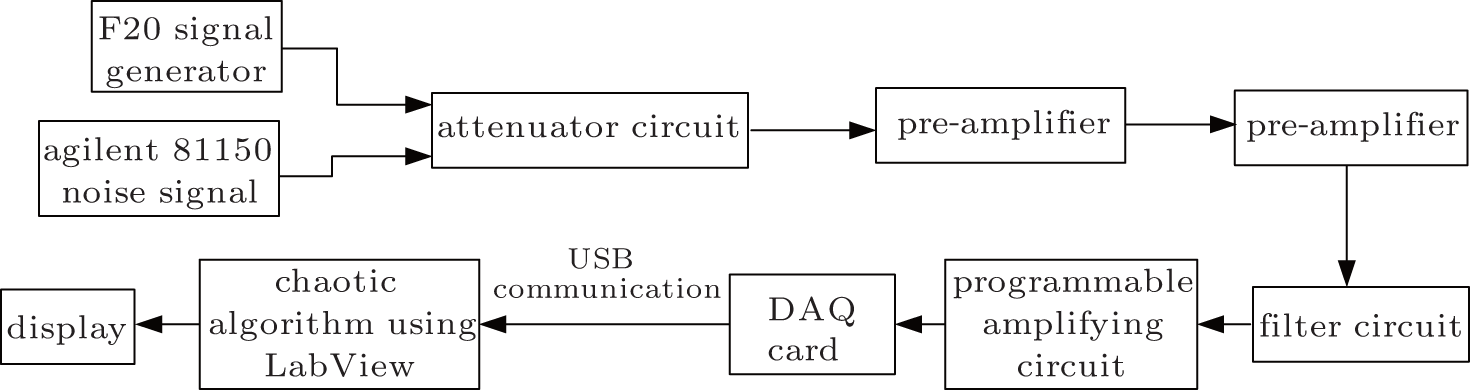 | Fig. 5. Principle block diagram of experiment system. |
The frequency detection of weak photoelectric signal is tested in two methods. One is the presented method in this paper, i.e., self-adaption frequency detection method based on frequency difference, and the other is proportional differential control based on Rö ssler chaotic system. The detection results are shown in Table 3.
| Table 3. Experiment results and relative error of frequency. |
In Table 3 it is shown that there are still some errors in the detection system. In summary, the main factors are given below.
(i) Error of the electrical system. The error comes from the noise of electronic device, preamplifier, drifting, and so on. However, through the test it is shown that the noise is less than 0.1%. The error of the A/D device is about 0.25%, so the total error from electrical system is

(ii) Error of data processing. Because the critical threshold value of chaotic system is determined and the initial value of the system is regulated, the system is more sensitive. Especially when using the Lyapunov index number to detect amplitude, the computing threshold value will have some error, but it is less than 0.75%.
(iii) Error of data collecting. In the data collecting system, data are transmitted through the USB communication interface to the upper computer. Sometimes data are lost or overwritten so that errors are obtained in the data collecting system. The error is less than 0.3%. Thus, the total detection error of the weak signal detection system is

In this paper we use the Duffing chaotic system and proportional differential control strategy based on the Rö ssler chaotic system to detect the frequency of a weak photoelectric signal. Through analyzing the merits and demerits of the two methods and then mixing the two chaotic models together, a new method is presented, that is: self adaption frequency detection based on frequency difference control. We use self adaption in the two chaotic oscillators through controlling the frequency difference between the known frequency of the driving force and the unknown frequency of the weak signal. Thus the detection speed is increased and it is high precision. The error is also smaller. The stability is analyzed for self adaption frequency detection based on frequency difference control. The simulation results show that the presented method is stable and feasible.
| 1 |
|
| 2 |
|
| 3 |
|
| 4 |
|
| 5 |
|
| 6 |
|
| 7 |
|
| 8 |
|
| 9 |
|
| 10 |
|
| 11 |
|
| 12 |
|
| 13 |
|
| 14 |
|