†Corresponding author. E-mail: gfshao@xmu.edu.cn
*Project supported by the National Natural Science Foundation of China (Grant No. 51271156) and the Natural Science Foundation of Fujian Province, China (Grant Nos. 2013J01255 and 2013J06002).
The morphologies and structures of Pt–Pd bimetallic nanoparticles determine their chemical and physical properties. Therefore, a fundamental understanding of their morphologies and structural stabilities is of crucial importance to their applications. In this article, we have performed Monte Carlo simulations to systematically explore the structural stability and structural features of Pt–Pd alloy nanoparticles. Different Pt/Pd ratios, and particle sizes and shapes were considered. The simulated results reveal that the truncated octahedron, which has the remarkably lowest energy among all the considered shapes, exhibits the best structural stability while the tetrahedron has the worst invariably. Furthermore, all the structures of Pt–Pd alloy nanoparticles present Pd-rich in the outmost layer but Pt-rich in the sub-outmost layer. Especially, atomic distribution and chemical short-range order parameter were applied to further characterize the structural features of Pt–Pd alloy nanoparticles. This study provides a significant insight not only into the structural stability of Pt–Pd alloy nanoparticles with different compositions, and particle sizes and shapes but also to the design of bimetallic nanoparticles.
In recent years, with the rapid progress of nanoscience and nanotechnology, metallic nanoparticles have received enormous attention due to their unique optical, [1] electronic, [2] and catalytic properties.[3– 5] Especially, bimetallic nanoparticles, composed of two different metal elements, are of greater interest than those of the corresponding bulk materials and the monometallic nanoparticles because of the synergy effects of the electronic structures of the components.[6, 7] As is well-known, the Pt nanoparticle is considered as one of the best catalysts owing to its excellent reactivity and stability.[8– 10] However, several scientific and technical challenges in catalyst materials have kept Pt nanoparticles from being used in wide-scale commercialization, including expensive cost, low efficiency for the oxygen reduction reaction, and weak durability.[11] In order to enhance their catalytic activity and utilization efficiency, alloying of Pt with other elements such as Pd, Au, Ir, Co, Ni, Fe, and Cu, has been extensively investigated and proved effective due to the increased d-band center and lattice contraction.[12– 15] In comparison to Pt alone, such Pt-based nanostructures not only improve the utilization efficiency of catalysts, but also reduce Pt usage in catalysts. Among the various Pt-based alloy catalysts, the Pt– Pd system is one of the most attractive bimetallic systems because Pd is stable in acidic solutions, less expensive than Pt, and the combination of Pt with Pd would not only enhance the catalytic performance but also improve the durability of the Pt-based catalysts. However, owing to the increased structural complexity of alloy catalysts compared with unary catalysts, the study of structural stability for Pt– Pd bimetallic nanoparticles has become a key issue in development of relevant catalysis fields.
It is known that the exceptional catalytic activity of bimetallic nanoparticles depends strongly on not only the particle size but also the Pt/Pd ratio.[16] Therefore, a detailed understanding of morphology and structural stability of Pt– Pd bimetallic nanoparticles with different Pt/Pd ratios and particle sizes would facilitate an exploration of the properties of bimetallic nanoparticles and their applications in catalysis. To date, many studies have been devoted to investigating the structural stability of Pt– Pd bimetallic nanoparticles with different particle sizes and compositions. For example, some researchers have focused on Pt– Pd core-shell and alloy nanoparticles for exploring the effect of size, temperature and structure on their stability.[8, 17, 18] Additionally, available studies have synthesized Pt– Pd bimetallic nanoparticles with different Pt compositions to assess the influence of size and Pt/Pd ratios on their catalytic activity and stability.[19– 22] Moreover, a growing number of researchers have analyzed the structural features of Pt– Pd bimetallic nanoparticles for investigating their stability.[10, 23, 24] All of the aforementioned studies in structural stability are of importance to the development and application of relevant nanocatalysts.
Although considerable experimental and theoretical studies have been dedicated to the design, synthesis, characterization, and performance evaluation of Pt– Pd bimetallic nanoparticles, to the best of our knowledge, there is still a lack of a thorough understanding of the structural stabilities of Pt– Pd alloy nanoparticles with different Pt/Pd ratios, and particle sizes and shapes. In this article, we have performed a systematic study of the stability analysis of Pt– Pd alloy nanoparticles bound with low-index facets by using Monte Carlo simulations. Firstly, the structural and surface segregation characteristics of these nanoparticles were analyzed. Subsequently, the size-dependent structural stability of different shaped nanoparticles was discussed. Furthermore, the atomic distribution and chemical short-range order (CSRO) parameter were used to characterize the structural features of Pt– Pd alloy nanoparticles. This article is structured as follows. Section 2 briefly describes the simulation methods. Section 3 presents the calculated results, and discusses and compares these with the available results. The main conclusions are summarized in the fourth section.
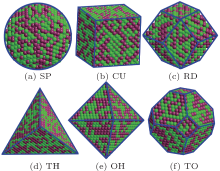
As we know, bimetallic nanoparticles present increasing structural complexity compared with unary nanoparticles because the two components can exhibit various structural configurations/modifications. For example, there are ordered/random mixed alloy, [25] core-shell[26– 28] and multi-shell forms in bimetallic nanoparticles.[29, 30] In this article, we have first constructed six polyhedral shapes of Pt– Pd bimetallic nanoparticles enclosed by low-index facets, namely cube (CU) bound by six {100} facets, rhombic dodecahedron (RD) by twelve {110} ones, tetrahedron (TH) by four {111} ones, octahedron (OH) by eight {111} ones, sphere (SP) and truncated octahedron (TO) by six {100} and eight {111} ones, from a large face-centered cubic (fcc) crystal, respectively. Note that all of the six shapes frequently occurring in theoretical and experimental studies[6, 25] belong to single-crystalline structures. These Pt– Pd bimetallic nanoparticles of six shapes have been illustrated schematically in Fig. 1. Due to the limitation of the computer facilities available, the total number of atoms varies between 231 and 14992. For each shape, the particle size ranges from about 1.0 to 5.5 nm. Initially, Pt and Pd atoms are arbitrarily distributed in bimetallic nanoparticles by computer-produced random seeds. Pt composition is continuously increased from 0 to 100% with an increment of 10%. Note that the Pt– Pd bimetallic nanoparticle is evolved to the Pd monometallic nanoparticle for Pt percentage of zero and the Pt monometallic one for Pt percentage of 100%.
In atomistic simulations, it is considerably important to precisely describe the interatomic interactions. Although they are closely associated with the electronic structures, the interactions between atoms are usually described by empirical potentials in most simulations, such as molecular dynamics and Monte Carlo methods. In this work, we have adopted the quantum corrected Sutton– Chen (Q-SC) type potentials to describe the interatomic interactions based on our previous studies.[31– 33] The potentials represent many-body interactions, and their parameters are optimized to describe the lattice parameter, cohesive energy, bulk modulus, elastic constants, phonon dispersion, vacancy formation energy, and surface energy, leading to an accurate description of thermodynamic and transport properties of metals and their alloys.[18] In the Q-SC potentials, the total potential energy for a system of atoms is given as follows:

in which V (Rij) is a pair interaction function defined by the following equation:

accounting for the repulsion between the i and j atoms; ρ i is a local electron density accounting for cohesion associated with atom i defined by

In Eqs. (1)– (3), Rij is the distance between atoms i and j; a is a length parameter scaling all spacing (leading to dimensionless V and ρ ); c is a dimensionless parameter scaling the attractive terms; ε sets the overall energy scale; and, n and m are integer parameters such that n > m. Given the exponents (n, m), c is determined by the equilibrium lattice parameter, and ε is determined by the total cohesive energy. The potential parameters for Pt and Pd are shown in Table 1. In order to describe the interaction between Pt and Pd atoms, the geometric mean was used to obtain the energy parameter ε while the arithmetic mean was used for the remaining parameters. The interaction energy between different metals was obtained by this approach and the reasonable results have been verified in our previous studies.[18, 32, 33]
| Table 1. Potential parameters for Pt and Pd. |
As a first step to investigate the structural property of Pt– Pd bimetallic nanoparticles, we will calculate their total energies according to Eq. (1), and then predict their stable structures. For a large nanoparticle, the computation of energetically stable structures is regarded as a highly complex optimization problem because it involves searching the lowest-energy configuration in the solution space composed of all possible atomic arrangements. Here, we have employed the Metropolis Monte Carlo (MC) simulation to search the stable structures of bimetallic nanoparticles since it is the most popular method for energy minimization due to its concision and effectivity.[34– 36] Considering that the predictive quality of MC simulations might be associated with the initial conditions, we have adopted different random seeds to produce various initial configurations. All of the simulations were performed at ground state (zero temperature). Furthermore, since the polyhedral shapes are based on an fcc crystal and the atomic radii of Pt and Pd are almost equal (1.39 Å for Pt and 1.38 Å for Pd), the effects of strain energy can be ignored.[37] Therefore, the positions of all of the atoms were fixed and the relaxation will be very small after exchanging their positions.
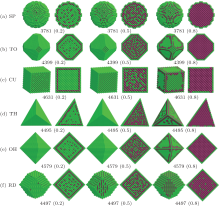
The optimized structures of Pt– Pd alloy nanoparticles with six different shapes and similar sizes are shown in Fig. 2. Note that the Pt compositions of 0.2, 0.5, and 0.8 are selectively illustrated in this figure for all the considered shapes. As is shown in Fig. 2, the influence of Pt/Pd ratios is not remarkable for different shapes because the tendency of atomic distribution seems to be the same at minimum energy state. Meanwhile, all of these configurations show that the outermost layer is primarily composed of Pd atoms while the sub-outermost layer is preferentially occupied by Pt atoms. This is mainly attributed to the difference of surface energy between Pd and Pt. For comparison, the surface energies of (111), (001), and (110) have been calculated by Q-SC potentials and ab initio calculations, as shown in Table 2. Considering the surface energy of Pd lower than that of Pt, this segregative behavior will be beneficial to lowering the total energy of the Pt– Pd alloy nanoparticle.
| Table 2. Surface energies fromab initio calculations and Q-SC empirical potentials. |
As we know, the composition of an alloy nanoparticle affects its surface segregation. Figure 3 depicts the variation of Pd fraction at surface and the degree of surface segregation for the different shapes mentioned above. Here, the degree of surface segregation can be defined as[12]

where NPdS is the number of surface Pd atoms, NS is the number of surface atoms, and NPd is the number of Pd atoms in the nanoparticles. By introducing the degree of surface segregation, we can investigate the composition-dependent and shape-dependent segregation. For the spherical and dodecahedral nanoparticles, one can clearly find that the fraction of Pd at the surface decreases with the increase of Pt composition. However, the surface separation of Pd will be weakened to a minimum value and then be strengthened gradually. Except for spherical and dodecahedral nanoparticles, all of the other nanoparticles show that the surface has been completely occupied by Pd atoms when the Pt composition is less than a certain value, preferentially forming the core-shell-like structures. The fraction of Pd at surface will be decreased once the composition of Pt exceeds a certain value. Although the fraction of Pt surface atoms is variable, the degree of surface segregation closes to one for all Pt composition. Generally speaking, the atoms with a coordination number less than 12 are considered as surface atoms in the fcc nanoparticles. For the nanoparticles enclosed by {100} and {111} faces, all of the surface atoms are located in the outermost layer. When the Pt composition is increasing, there are not enough Pd atoms to fill the whole surface. Therefore, the fraction of Pd at surface will decrease when the composition of Pt exceeds a certain value. However, for the sphere and rhombic dodecahedron enclosed by {110} facets, the surface atoms existed in the outermost and sub-outermost layer. Due to the Pt atoms preferentially occupying the sub-outermost layer, the fraction of Pd at the surface in the spherical and dodecahedral nanoparticles continuous to decrease with the increasing Pt composition.
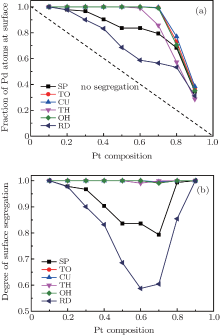 | Fig. 3. The segregation behavior at surface with respect to different Pt concentrations for six nanoparticles in Fig. 2. (a) Variation of surface Pd fraction. (b) The degree of surface segregation for six nanoparticles. |
The structural stability of a nanoparticle can be determined according to its total energy, which is equal to the summation of the potential energy of each atom at the ground state. Generally, the structure with a lower energy tends to be more stable. In order to facilitate the comparison of Pt– Pd bimetallic nanoparticles with different shapes, a common definition of particle size, based on equivalent volume, was introduced as follows:

where N is the total number of atoms in the particle and a0 = 3.924 Å is the lattice constant of bulk Pt. The energies of Pt– Pd bimetallic nanoparticles with different shapes were calculated. As a representative, figure 4 shows the potential energies of Pt– Pd alloy nanoparticles at Pt: Pd = 2:8 and Pt: Pd = 8:2, which represents the small (20%) and large (80%) Pt compositions. Here, the particle size ranges from 0.5 nm to 6.5 nm. Evidently, the energies of the nanoparticles with different shapes were decreased with the increasing size, independent of Pt/Pd ratios. Furthermore, a strong size effect can be found. Besides, the energy differences between different shapes were dependent on their surface structures, indicating a significant surface effect in these nanoparticles. This phenomenon has already been observed in the previous studies.[38, 39] Figure 4 also reveals that the tetrahedron has remarkably higher energy than the other five shapes, always exhibiting the worst stability. Meanwhile, the stability of the cube and rhombic dodecahedron, respectively, ranks the second and the third worst stability among all of the shapes. Interestingly, the sphere is not the most stable shape, although its surface area is theoretically the smallest in all of the particles of the same size. Instead, the truncated octahedron displays the best stability.
 | Fig. 4. Size-dependent energies of Pt– Pd alloy nanoparticles with particle size from 1.5 to 6.5 nm at compositions of Pt:Pd= 2:8 (a) and 8:2 (b). |
The phenomenon that a strong size effect usually occurs in small nanoparticles can be elucidated by the influence of surface-to-volume ratio. With the particle size decreasing to nanoscale, the particle is formed by a reduced number of atoms and the majority of them are located at the surface. As a result, the surface-to-volume ratio remarkably increases, leading to the strong size effect. As is known, the surface energy of low-index planes that determine the shapes of these nanoparticles is generally increased in the order of γ {111} < γ {100} < γ {110}.[25– 27] Therefore, it is not surprising to find that the octahedron, enclosed by {111} facets, and the truncated octahedron, enclosed by eight {111} facets and six {100} facets, are both more stable than the cube and the rhombic dodecahedron which are, respectively, terminated by {100} and {110} facets.
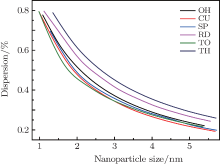
It is worth noting that not only the type of facets but also the number of facets have significant contributions in determining the structural stability. The former is associated with particle shape, the latter is size- and shape-dependent.[40] To further analyze on the size or shape dependence of the number/type of facets, we introduce a concept of dispersion, which is defined as the ratio of the number of surface atoms to the total number of atoms.[41] Because different sizes and different shapes contribute to different surface areas, the surface area will affect the structural stability of alloy nanoparticles due to the different dispersion defined above. Figure 5 shows the size dependent dispersion for the six shapes. The larger the particle size, the smaller the dispersion. The dispersion of tetrahedron is bigger than the other shapes, which is the reason why the tetrahedron is more unstable, even though it is enclosed by {111} facets. Similarly, the cube has the lowest dispersion although it is enclosed by {100} facets. Therefore, it has a worse stability compared with the others.[31]
To further analyze the structural stability of Pt– Pd bimetallic nanoparticles, we have investigated their local structural information and atomic distributions. All of the shaped nanoparticles in this article were divided into successive shells from the surface towards the core. The Pt fraction and the number of Pt atoms in each shell were calculated from the optimized Pt– Pd NPs.
As a representative, figure 6 shows the distribution of Pt atoms in spherical and truncated octahedral nanoparticles of Pt:Pd = 5:5. Here, the 1st shell denotes the innermost shell (core) and the last shell denotes the outmost surface. It can be seen that Pt atoms are not found on the outmost shell (not outmost surface) in all cases, indicating that the outmost shell has been completely occupied by Pd atoms. In addition, the alloy feature is observed in the core region. For spherical nanoparticles, the fraction of Pt atoms on surface is not zero but a small proportion (0.1– 0.2) because its surface is comprised of outmost shell and part of sub-outmost shell (see Fig. 6(a)). In addition, the Pt fraction is distinctly increased from the interior to sub-outmost shell, and is drastically decreased to a small proportion at the outmost surface. Moreover, the fraction of Pt atoms is close to 50% near the core, indicating that Pd and Pt atoms are similarly distributed in the spherical nanoparticles. For polyhedral nanoparticles, the outmost surface is the outmost shell, the distribution features are different from the spherical nanoparticles. As shown in Fig. 6(b), the fraction of Pt atoms slightly rises near sub-outmost shell, and then significantly drops to zero at the outmost shell of the truncated octahedral nanoparticles. These results indicate that the outmost shell is Pd-rich while the sub-outmost shell is Pt-rich, which is consistent with the results presented in Fig. 2.
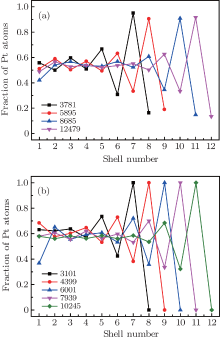 | Fig. 6. Fraction of Pt atoms in each shell for Pt/Pd = 1 in (a) spherical and (b) truncated octahedral nanoparticles. |
To investigate the effect of Pt composition on the distributions of Pt and Pd atoms, we calculated the number of Pt atoms in all shells, as shown in Fig. 7. Similar to Fig. 6, the spherical and truncated octahedral nanoparticles were selected for comparison. It can be found that a peak appears in the sub-outmost shell, indicating that the Pt atoms tended to be distributed in the sub-outmost shell, independent of the Pt or Pd composition. For those nanoparticles with other shapes and atomic numbers, it is still valid that the Pd atoms preferentially located on the outermost shell and Pt atoms predominantly occupied the sub-outmost shell, which is in good accordance with the results in Figs. 2 and 6.
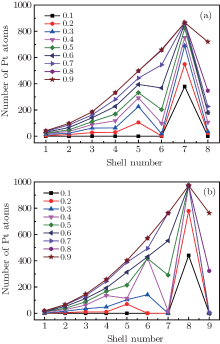 | Fig. 7. The number of Pt atoms at each shell of Pt– Pd alloy nanoparticles with different compositions: (a) sphere with 3781 atoms and (b) truncated octahedron with 4399 atoms. |
As mentioned above, it can be seen that the segregation of Pt atoms in the sub-surface layer induces an oscillatory concentration profile, which is typical of alloys with a tendency to order. This segregation is in accordance with the negative enthalpy of mixing. In addition, our simulations show that in Pt– Pd bimetallic nanoparticles a metal of high surface energy tends to be distributed in the interior of the nanoparticles while for a metal of low surface energy the atoms prefer to occupy at the surface. This is a general tendency for all Pt– Pd alloy nanoparticles.
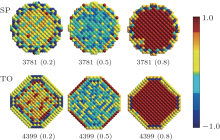
As depicted in Fig. 2, the tendency for ordering is pronounced in the Pt– Pd alloy nanoparticles. In order to investigate the bond characteristics of these nanoparticles, we have introduced the Warren– Cowley CSRO parameter, as follows:[23]

where NAB is the nearest coordination number of B atoms around an A atom, NCN is the total coordination number in the nearest-neighbor shell, and CB is the atomic concentration of B. This parameter is a useful measure of the chemical affinity and represents the degree of tendency for ordering or clustering. CSRO values range between − 1 to 1. Positive CSRO parameter values indicate clustering or phase separation, and negative values indicate strong A– B bonds and chemical ordering.[42]
To explore the influence of Pt composition on CSRO parameters, we have calculated the average CSRO values of Pt– Pd alloy nanoparticles with Pt compositions ranging from 10% to 90%, as shown in Fig. 8, and the CSRO parameter profile, as shown in Fig. 9. Note that the sphere and truncated octahedron were selected as representatives for comparison. It is obviously seen that the variation of CSRO values in the spherical nanoparticles is quite similar to that in the truncated octahedral nanoparticles. As shown in Fig. 8, in low Pt composition, the average CSRO values were small positive values. At this situation, most Pt atoms tended to be distributed in the sub-outermost layer, only a minority of Pt atoms were located in interior. With increasing Pt composition, the sub-outermost layer was gradually occupied by Pt atoms, and the number of Pt atoms in the interior also increased, which led a slight decrease of the average CSRO value. When the Pt composition rose up to 0.5, Pt and Pd displayed a mixed structure in the interior and the CSRO value was small (see Fig. 9), indicating strong A– B bonds and chemical ordering. As the Pt composition kept growing, the average CSRO parameter was also gradually increased until the core of the nanoparticle was full of Pt atoms, indicating that a pure Pt nanoparticle could be obtained after peering off the Pd-rich surface. However, the CSRO values did not increase any further with the further increase of Pt composition. Contrarily, they slightly dropped owing to the increasing number of Pt atoms on the surface. Because a small particle size has a large dispersion, Pt atoms completely occupy the interior in small Pt composition in small nanoparticles. When the number of atoms is less than 5895 for sphere and 4399 for truncated octahedron (see Fig. 8), the interior has been fully occupied by Pt atoms, and the average CSRO value declined slightly before Pt composition rose up to 0.8. In conclusion, when the Pt composition is not high, Pt and Pd atoms were uniformly mixed in the core region. In addition, the average CSRO value is small in the interior, indicating strong A– B bonds or chemical ordering for Pt– Pd alloy nanoparticles. The average CSRO increased with the increase of Pt composition. For the different sizes or shapes, the Pt composition is different when the CSRO value reaches the biggest or the smallest values.
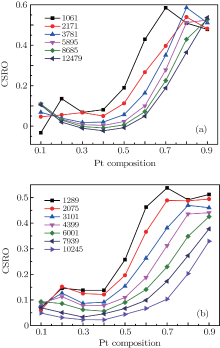 | Fig. 8. CSRO value as a function of Pt compositions in (a) spherical and (b) truncated octahedral nanoparticles. |
In summary, we have employed Monte Carlo simulations to investigate the structural stability and structural features of Pt– Pd alloy nanoparticles. Six diverse shapes were considered. The effects of particle size and Pt compositions were explored for these particles. Moreover, atomic distribution and the CSRO parameter were introduced to characterize their structures. The results show that the atomic distribution seems to be independent of the particle shape. Pd atoms occupy the outermost layer while Pt atoms do the sub-outermost layer, which is beneficial for minimizing the surface energy and total energy due to the difference in surface energy between Pt and Pd, suggesting a tendency towards phase separation at the surface. Besides, the fraction of Pd atoms at surface is decreased with the increased Pt composition, while the degree of surface segregation is decreased to a minimum value and subsequently increased for spherical and dodecahedral nanoparticles. However, for other shaped nanoparticles, the degree of surface segregation is almost equal to one. Furthermore, it is found that truncated octahedral nanoparticles possess the best structural stability, while tetrahedral ones present the worst. Our study shows that the structural stability of Pt– Pd alloy nanoparticles is closely associated with their compositions, sizes, and shapes. When the Pt composition is not large, Pt and Pd atoms are almost uniformly mixed in the core region. The segregation of the Pt atoms induces an oscillatory concentration profile, which is typical of alloys with a tendency to order. The strong A– B bonds or chemical ordering for Pt– Pd alloy nanoparticles are found in the interior, A– B bonds or chemical ordering for Pt– Pd alloy nanoparticles are found in the interior, especially for medium Pt compositions. Since both Pt and Pd are the most efficient metal catalysts for fuel cells and for energy storage and conversion, the detailed understanding of structural features of Pt– Pd alloy nanoparticles will contribute to the development and design of alloy nanoparticle catalysts of high catalytic performance.
| 1 |
|
| 2 |
|
| 3 |
|
| 4 |
|
| 5 |
|
| 6 |
|
| 7 |
|
| 8 |
|
| 9 |
|
| 10 |
|
| 11 |
|
| 12 |
|
| 13 |
|
| 14 |
|
| 15 |
|
| 16 |
|
| 17 |
|
| 18 |
|
| 19 |
|
| 20 |
|
| 21 |
|
| 22 |
|
| 23 |
|
| 24 |
|
| 25 |
|
| 26 |
|
| 27 |
|
| 28 |
|
| 29 |
|
| 30 |
|
| 31 |
|
| 32 |
|
| 33 |
|
| 34 |
|
| 35 |
|
| 36 |
|
| 37 |
|
| 38 |
|
| 39 |
|
| 40 |
|
| 41 |
|
| 42 |
|


