Project supported by the National Natural Science Foundation of China (Grant Nos. 11274370 and 51471185) and the National Basic Research Program of China (Grant Nos. 2012CB933102 and 2011CB921801).
Abstract
Monodispersive ZnO nanoparticles each with a hexagonal wurtzite structure are facilely prepared by the high-temperature organic phase method. The UV-visible absorption peak of ZnO nanoparticles presents an obvious blue-shift from 385 nm of bulk ZnO to 369 nm. Both the real part and the image part of the complex permittivity of ZnO nanoparticles from 0.1 GHz to 10 GHz linearly decrease without obvious resonance peak appearing. The real parts of intrinsic permittivity of ZnO nanoparticles are about 5.7 and 5.0 at 0.1 GHz and 10 GHz respectively, and show an obvious size-dependent behavior. The dielectric loss angle tangent (tan δ) of ZnO nanoparticles with a different weight ratio shows a different decreasing law with the increase of frequency.
As a wide-band gap semiconductor (3.37 eV), wurtzite ZnO with an exciton binding energy of 60 meV at room temperature (RT), which is larger than that of the widely used semiconductors GaN (26 meV) or ZnSe (20 meV), has attracted the attention of researchers for several decades due to its many important applications, especially in optics and optoelectronics.[1– 6] ZnO nanomaterials with significantly novel and improved physical, chemical, and biological properties and functionality due to their nanoscale sizes have aroused much interest in near-UV emission, gas sensors, transparent conductor, optoelectronics, and piezoelectric application.[7– 13] Most of the ZnO nanomaterials have been synthesized by the traditional high temperature solid state method, which is energy-consuming and difficult to control the particle properties. ZnO nanoparticles can be prepared on a large scale at low cost by simple solution-based methods, such as microemulsion synthesis, [3] sol– gel synthesis, [4] chemical precipitation, [7] and hydrothermal reaction.[11] However, ZnO nanomaterials prepared in water phase due to the existence of surface polarization result in hydrophilic nanomaterials and hard agglomerates, which impede the application of ZnO nanomaterials. Therefore, the hydrophobic ZnO nanomaterials have received much attention because of the enhanced dispersability in the organic solution and the polymer and improved surface chemical and physical properties. In addition, the properties under GHz electromagnetic field of ZnO nanomaterials have drawn less attention though ZnO can serve as useful dielectric materials with a high effective permittivity of above 2.
In this paper, we present a facile method to synthesize monodispersive hydrophobic ZnO nanoparticles with a single crystalline phase by a high-temperature organic phase method. The high-frequency properties above GHz including frequency-dependent permittivity and dielectric loss tangent (tanδ ) of ZnO nanoparticles are investigated.
2. Experiments
In a typical synthesis procedure, 0.5-mmol Zn(acac)2, 2-mmol 1, 2-hexadecanediol, 1-mol oleic acid, 1-mmol oleylamine, and 10-ml diphenyl ether were mixed and magnetically stirred under a flow of Ar gas. The mixture was heated to 120 ° C for 30 min until a clear solution formed, and then heated to 300 ° C for another 30 min. The solution turned slowly milk white and subsequently was cooled to room temperature by removing the heat source. The 20-ml of ethanol was added to the mixture, and a white material was precipitated and separated via centrifugation (8000 rpm, 10 min). The white product was dissolved in hexane and separated by centrifugation (3000 rpm, 3 min). The product was washed by ethanol and hexane three times. The size of ZnO nanoparticles can well be controlled by adjusting the quantity of surfactants.
The morphologies and selected area electron diffractions (SAEDs) of ZnO nanoparticles were characterized by transmission electron microscopy (TEM, JEM-2100F with operation voltage 200 kV). To identify the crystal structures of the samples, x-ray diffraction (D2 PHASER, Cu Kα radiation, λ = 0.154 nm) was employed with a scanning rate of 0.2° /s. A UV-visible spectrophotometer (Varian Cary 5000) equipped with a xenon flash lamp for the best sensitivity was used for monitoring the absorption peak of ZnO nanoparticles. Dielectric spectra were measured by a vector network analyzer (Agilent N5224A) using a coaxial transmission– reflection method in the frequency range 0.1 GHz– 10.0 GHz. ZnO powder with a size less than 5 μ m and purity of 99.9% was purchased from Aldrich Co. Ltd.
3. Results and discussion
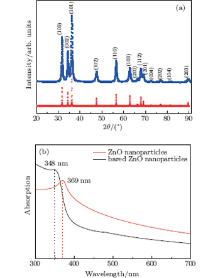
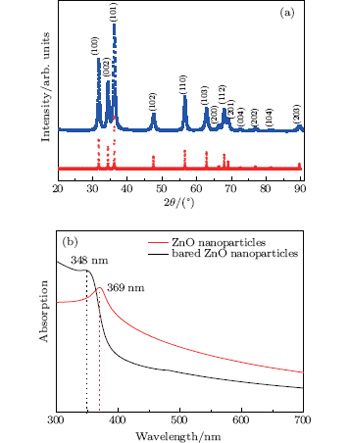
The XRD patterns and UV-vis spectra are measured to reveal the crystalline structures and energy levels of ZnO nanoparticles. Figure 1(a) shows the XRD patterns of as-prepared nanoparticles and bulk wurtzite ZnO. Seven major diffraction peaks were seen respectively at 31.7° , 34.6° , 36.2° , 47.6° , 56.5° , 62.9° , and 68.0° , which can be assigned to diffractions from (100), (002), (101), (102), (110), (103), and (112) planes respectively, according to the data base in the JCPDS card (No. 36– 1451). These results reveal that the resulting nanoparticles are well-crystallized and stoichiometric ZnO nanoparticles with a hexagonal wurtzite structure. No impurities could be found in this pattern, which implies that the hexagonal phase ZnO nanoparticles can be obtained along the current synthetic route. The crystallite size is calculated to be around 28 nm from the peak widths based on the Scherrer’ s equation. Figure 1(b) shows the UV-vis absorption spectra of the as-synthesized and surfactant-free ZnO nanoparticles. For the as-synthesized ZnO nanoparticles, the absorption peak at 369 nm corresponding to an excitonic band is significantly blue-shifted compared with that at 380 nm of bulk ZnO. Also, the absorbance wavelength further shifts to 348 nm of surfactant-free ZnO nanoparticles by thermally removing the surfactants of oleic acid and oleylamine. The as-synthesized ZnO nanoparticles have a longer absorbance wavelength, which may be attributed to the quenching of the oxygen vacancies on the external surfaces of the ZnO nanoparticles by the carboxylic group in the oleic acid molecules. These results reveal that the band gap of the ZnO nanoparticles increases due to the quantum size effect[14] and can be strongly affected by the vacancies (defects) on the surfaces of ZnO nanoparticles. The quenching by oleic acid on the vacancies (defects) on the external surfaces of ZnO nanoparticles is considered to relax the dimension contraction (caused by the increased proportion of surface atoms with the reduced dimensions), which therefore leads to an increase of the particle size. In addition, the lower absorbance intensity for the as-synthesized ZnO nanoparticles may be ascribed to the screen effect of the capping ligand shell around the particles where quite a number of absorbable photons cannot be effectively captured by the ZnO core.[15]
Fig. 1. (a) XRD of the ZnO nanoparticles, (b) UV-vis absorption spectra of the ZnO nanoparticles.
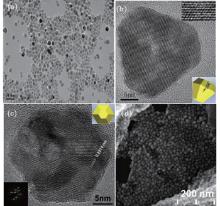
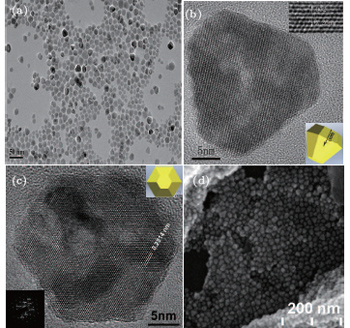
Figure 2 shows the typical TEM and SEM images of as-synthesized ZnO nanoparticles. From the low-magnification TEM image shown in Fig. 2(a), the project shapes of ZnO nanoparticles show triangle, truncated triangle, polygon, and irregular polygon shapes. The ZnO nanoparticles disperse very well and have an average diameter of about 25 nm (side-edge length). In the corresponding high-magnification TEM images (Figs. 2(b) and 2(c)), two kinds of lattice fringes with a high degree of extended structural ordering for these ZnO nanoparticles are clearly observed, which implies that the high-temperature organic method can produce a highly crystalline structure. The interplanar spacing in the truncated triangle shape (shown in Fig. 2(b)) is about 0.26 nm which refers to the lattice plane (002) of the hexagonal wurtzite structure. The interplanar spacing in the polygon shape (shown in Fig. 2(c)) is about 0.281 nm which refers to the lattice plane (100) of the hexagonal wurtzite structure. From the diffraction rings of the SAED pattern shown in the inset of Fig. 1(b), the basal plane of the ZnO nanoparticles is perpendicular to the [0001] direction, which is the c axis of the wurtzite hexagonal structure. From the SEM image of ZnO nanoparticles shown in Fig. 2(d), the ZnO nanoparticles are not a plain shape but a nanopyramid shape. Combination of the TEM analysis with the SEM analysis shows that the as-synthesized ZnO nanoparticles are truncated nanopyramids with a hexagonal basal plane. The lateral facets of the nanopyramids are not perfectly developed although each nanopyramid is a single crystal, which results in some irregular polygon shapes in the projective TEM images.
Fig. 2. (a) Low-magnification and (b) high-magnification TEM image, and [(c) and (d)] SEM image of ZnO NPs, with the insets showing the corresponding SAEDs of ZnO nanoparticles.
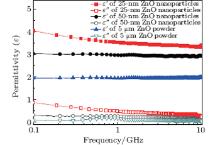
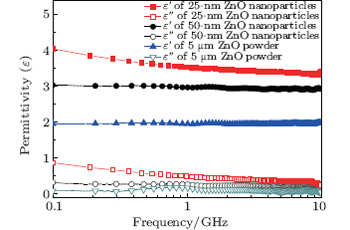
Figure 3 shows the complex dielectric constant of ZnO particles with sizes of 25 nm, 50 nm, and 5 μ m at the same weight percent of 60% in paraffin wax, respectively. As shown in Fig. 3, the real permittivity (ɛ ″ ) of the 5-μ m ZnO particles has an approximately constant value of 2.0, and ɛ ′ of 50-nm ZnO nanoparticles slightly decreases from 3.0 to 2.9, while ɛ ′ of 25-nm ZnO nanoparticles obviously decreases from 4.0 to 3.4 with the increase of frequency from 0.1 GHz to 10 GHz. The values of the imaginary permittivity (ɛ ″ ) of 5-μ m ZnO particles and 50-nm ZnO nanoparticles are almost 0.15 and 0.25 in the whole frequency range, while ɛ ′ of 25-nm ZnO nanoparticles shows a frequency-dependent behavior and has relatively higher values: 0.45 at 1 GHz and 0.25 at 10 GHz. It should be noted that the ɛ ″ of 25-nm ZnO nanoparticles above 5 GHz is almost the same as the value of ZnO particles with large sizes. The low complex permittivity of ZnO particles with large sizes results from the intrinsic property of the semiconductor ZnO. The direct band gap Eg of the ZnO semiconductor is about 3.37 eV, which is much larger than the thermal energy at room temperature. This leads to the low polarization and conductivity corresponding to low real and imaginary permittivity.[16] As the particle size decreases to dozens of nanometers, the number of surface atoms with unsaturated bonds and the corresponding dipole moment per unit volume due to the dielectric confinement effect increase greatly, which results in the increase of ɛ ′ and ɛ ″ of the ZnO nanoparticles.[17]
Fig. 3. Frequency-dependent complex dielectric constants of ZnO particles with different sizes.
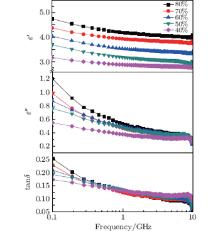
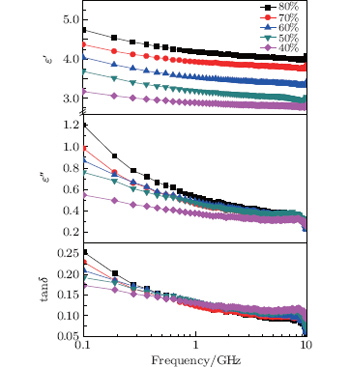
Figure 4 shows the complex dielectric constant and dielectric loss angle tangent (tanδ = ɛ ″ /ɛ ′ ) of ZnO nanoparticles with weight percent from 40 wt% to 80 wt% of ZnO nanoparticles in paraffin wax. With the increase of frequency from 0.1 GHz to 10 GHz, the dielectric constant ɛ ′ and ɛ ″ of ZnO nanoparticles are both slowly reduced without obvious resonance peaks appearing. Especially, the values of the real part ɛ ′ of all samples only have a less than 15% decrease in such a wide frequency range, while the values of the image part ɛ ″ have a sharp decrease of more than 60% from 0.1 GHz to 1 GHz, a smooth decrease of 40% from 1 GHz to 10 GHz. With the decrease of the weight percent, the dielectric constants ɛ ′ and ɛ ″ are both reduced in the whole frequency range, typically from 4.25 and 0.6 to 2.8 and 0.4 at 1 GHz. According to the effective medium theory, the effective dielectric constant can be obtained from the following equation:[18]
where p1 and p2 are the volume fractions of two components, ɛ 1 and ɛ 2 are real parts of the dielectric constant of two components, ɛ eff is the effective dielectric constant obtained from measurement, and ɛ ′ is the dielectric constant of pure paraffin wax in our sample and is about 2.25. In the case of 80 wt%, the volume fraction p1 is about 77.29% and the values of effective dielectric constant ɛ eff are 4.75 at 0.1 GHz and 4.25 at 10 GHz. The intrinsic real parts of the dielectric constant of ZnO nanoparticles are 5.7 and 5.0.
Fig. 4. Frequency-dependent real part (ɛ ′ ) and image part (ɛ ″ ) of complex dielectric constant and dielectric loss angle tangent (tanδ ) of 25-nm ZnO nanoparticles with different weight fractions.
The change of tanδ of ZnO nanoparticles from 0.1 GHz to 10 GHz is shown in Fig. 4. With the increase of frequency, tanδ of ZnO nanoparticles is reduced from more than 0.25 to nearly 0.1. The tanδ of ZnO nanoparticles with a high weight ratio is higher than that with a low weight ratio between 0.1 GHz to 1.5 GHz, but lower between 1.5 GHz to 10 GHz. It reveals that the ratio between ɛ ′ and ɛ ″ does not decrease proportionally with the increase of frequency. In all different samples with different weight ratios, ZnO nanoparticles with a weight ratio of 80 wt% have the lowest tanδ value and highest ɛ ′ between 1 GHz and 10 GHz, which is in favor of its application in the microelectronic devices working in the GHz band. Typically, size reduction of micro-strip antenna is known to be roughly inversely proportional to the refractive index n = (ɛ ′ μ ′ )1/2, of the substrate (μ ′ is the real part of permeability), [19] which indicates that a high permittivity is useful for miniaturizing micro-strip antenna with an excellent performance. In addition, the characteristic impedance (Z) of the microwave electronic device is proportional to the (μ r/ɛ r)1/2, in which μ r and ɛ r are relative permeability and relative dielectric constant of the device respectively. So a relatively high permittivity is easy to realize the impedance matching with some microwave electronic devices by using the magnetic material with a high μ r, which results in a low energy consumption.
4. Conclusions
Monodispersive ZnO nanoparticles are prepared by the high-temperature organic phase method. XRD and high-resolution TEM reveal that the crystal structure of as-synthesized ZnO nanoparticles is hexagonal wurtzite structure. A strong absorption peak at 369 nm can be observed in the UV-visible absorption spectrum of ZnO nanoparticles, which corresponds to the band gap of 3.26 eV. The high-frequency permittivity properties of ZnO particles with different sizes and weight ratios are investigated between 0.1 GHz and 10 GHz. The complex permittivity of ZnO particles show a size-dependent behavior and ZnO nanoparticles with a small size have higher ɛ ′ and ɛ ″ due to surface unsaturated bonds and the corresponding dipole moment per unit volume. Both the real part and image part of complex of ZnO nanoparticles linearly decrease without the obvious resonance peak appearing. The real parts of intrinsic permittivity of ZnO nanoparticles are about 5.7 and 5.0 at 0.1 GHz and 10 GHz respectively. The change of frequency-dependent ratio between ɛ ′ and ɛ ″ is not in proportion to frequency, resulting in the different decreasing ratios of ZnO nanoparticles with the different weight ratios. The ZnO nanoparticles with a weight ratio of 80 wt% have the lowest tanδ value and the highest ɛ ′ above 1 GHz, which is in favor of its application in microelectronic devices working at the GHz band.
PiaoY Z, KimJaeyun, NaH B, KimD, BaekJ S, KoM K, LeeJ H, ShokouhimehrM and HyeonT2008Nat. Mater. 7242DOI:10.1038/nmat2118[Cited within:1][JCR: 35.749]
1
2000
3.607
0.0
... [1#cod#x2013 ...
1
2010
2.112
0.0
1
2003
9.765
0.0
... ZnO nanoparticles can be prepared on a large scale at low cost by simple solution-based methods, such as microemulsion synthesis,[3] sol#cod#x2013 ...
1
2003
3.607
0.0
... gel synthesis,[4] chemical precipitation,[7] and hydrothermal reaction ...
Metal-insulator-semiconductor back contact has been employed for a perovskite organic lead iodide heterojunction solar cell, in which an ultrathin Al2O3 film as an insulating layer was deposited onto the CH3NH3PbI3 by atomic layer deposition technology. The light-to-electricity conversion efficiency of the devices is significantly enhanced from 3.30% to 5.07%. Further the impedance spectrum reveals that this insulating layer sustains part of the positive bias applied in the absorber region close to the back contact and decreases the carrier transport barrier, thus promoting transportation of carriers.
... 6] ZnO nanomaterials with significantly novel and improved physical, chemical, and biological properties and functionality due to their nanoscale sizes have aroused much interest in near-UV emission, gas sensors, transparent conductor, optoelectronics, and piezoelectric application ...
Abstract ZnO nanoparticles assembled in one-dimensional order were synthesized by a template-free method. The synthesized ZnO powder have a hexagonal zincite structure. The ZnO aggregates with rod-like shapes are typically ∼1.2 μm in length and 100 nm in diameter with an aspect ratio as high as ∼12, which consist of many small nanocrystals with diameters of ∼15 nm. Longer wires connected by many hexahedral ZnO nanocrystals were obtained after calcination at the temperature over 500 °C. The formation of the rod-shaped ZnO powders is related to the existence of [Zn(NH 3 ) x ] 2+ complex cations. ZnO nanoparticles with an average crystallite size of about 30 nm assembled in one-dimensional order were synthesized by a template-free method.
... [7#cod#x2013 ...
... gel synthesis,[4] chemical precipitation,[7] and hydrothermal reaction ...
Effects of an ultra-strong magnetic field on electron capture rates for Co-55 are analyzed in the nuclear shell model and under the Landau energy levels quantized approximation in the ultra-strong magnetic field, and the electron capture rates on 10 abundant iron group nuclei at the surface of a magnetar are given. The results show that electron capture rates on Co-55 are increased greatly in the ultra-strong magnetic field, by about 3 orders of magnitude generally. These conclusions play an important role in future study of the evolution of magnetars.
Du Jun 1 ;Li Ping-Ping 1 ;Luo Xia 1,2 ;
Effects of ultra-strong magnetic field on electron capture rates for 55 Co are analyzed in the nuclear shell model and under the Landau energy levels quantized approximation in the ultra-strong magnetic field, and the electron capture rates on 10 abundant iron group nuclei at the surface of magnetar are given. The results show that electron capture rates on 55 Co are increased greatly in the ultra-strong magnetic field, by about 3 orders of magnitude generally. These conclusions play an important role in future studying the evolution of magnetar.
1
2003
10.677
0.0
... [11] However, ZnO nanomaterials prepared in water phase due to the existence of surface polarization result in hydrophilic nanomaterials and hard agglomerates, which impede the application of ZnO nanomaterials ...
1
2005
4.689
0.0
1
2005
2.024
0.0
... 13] Most of the ZnO nanomaterials have been synthesized by the traditional high temperature solid state method, which is energy-consuming and difficult to control the particle properties ...
1
2004
5.968
0.0
... These results reveal that the band gap of the ZnO nanoparticles increases due to the quantum size effect[14] and can be strongly affected by the vacancies (defects) on the surfaces of ZnO nanoparticles ...
The effects of annealing environment on the luminescence characteristics of ZnO thin films that were deposited on SiO 2 /Si substrates by reactive RF magnetron sputtering were investigated by X-ray photoelectron spectroscopy (XPS) and photoluminescence (PL). An analysis of the O 1s peak of ZnO film revealed that the concentration of oxygen vacancies increased with the annealing temperature from 600 °C to 900 °C under an ambient atmosphere. The PL results demonstrated that the intensity of green light emission at 523 nm also increased with temperature. Under various annealing atmospheres, the analyses of PL indicated that only one emission peak (523 nm) was obtained, indicating that only one class of defect was responsible for the green luminescence. The green light emission was strongest and the concentration of oxygen vacancies was highest when the ZnO film was annealed in ambient atmosphere at 900 °C. The results in this investigation show that the luminescence mechanism of the emission of green light from a ZnO thin film is associated primarily with oxygen vacancies.
1.National Sun Yat-Sen University Department of Electrical Engineering Kaohsiung Taiwan R.O.C. 2.Shu-Te University Department of Computer and Communication Kaohsiung Taiwan R.O.C. 3.Cheng Shiu University Department of Electrical Engineering Kaohsiung Taiwan R.O.C.
... [15] ...
1
1994
0.0
0.0
... [16] As the particle size decreases to dozens of nanometers, the number of surface atoms with unsaturated bonds and the corresponding dipole moment per unit volume due to the dielectric confinement effect increase greatly, which results in the increase of #cod#x025B ...
1
2007
1.913
0.0
... [17] ...
1
2004
0.71
0.0
... According to the effective medium theory, the effective dielectric constant can be obtained from the following equation:[18] ...
1
2008
35.749
0.0
... is the real part of permeability),[19] which indicates that a high permittivity is useful for miniaturizing micro-strip antenna with an excellent performance ...
High-frequency properties of oil-phase-synthesized ZnO nanoparticles*
[Ding Hao-Fenga),b), Yang Hai-Taob)†, Liu Li-Pingb), Ren Xiaob), Song Ning-Ningb), Shen Junc), Zhang Xiang-Qunb), Cheng Zhao-Huab), Zhao Guo-Pinga),b)‡]


 , Liu Li-Ping