

Quartic coupling and its effect on wetting behaviors in nematic liquid crystals*
[Zeng Ming-Yinga), b) , Holger Merlitza) , Wu Chen-Xua)†  ]
]
]
|
|


Corresponding author. E-mail: cxwu@xmu.edu.cn
Project supported by the National Natural Science Foundation of China (Grant No. 11374243).
Based on the fact that rubbed groove patterns also affect the anchoring of liquid crystals at substrates, a quartic coupling is included in constructing the surface energy for a liquid crystal cell. The phase diagram and the wetting behaviors of the liquid crystal cell, bounded by surfactant-laden interfaces in a magnetic field perpendicular to the substrate are discussed by taking the quartic coupling into account. The nematic order increases at the surface while it decreases in the bulk as a result of the introduction of quartic substrate–liquid crystal coupling, indicating that the groove anchoring makes the liquid crystal molecules align more orderly near the substrate than away from it. This causes a different wetting behavior: complete wetting.
The phenomenon that liquid crystal exhibits a preferential orientation at interfaces, called surface anchoring, has been studied for many years, which includes homeotropic anchoring, planar unidirectional anchoring, and planar degenerate anchoring.[1, 2] Such a kind of investigation, such as surface-induced wetting[3– 5] of thermotropic liquid crystals, is of special importance because of its technological applications.[6, 7] To describe this interfacial interaction, a simple phenomenological expression, later called RP-form, was given by Rapini and Papoular (RP)[8] in 1969, which interpreted the interfacial energy per unit area for a one-dimensional deformation as gs = A sin2θ /2, where A and θ are the anchoring strength parameter and the angle between the easy direction n and the orientation of the director at the interface n0 respectively. The RP anchoring was later transformed into a quadratic coupling expression in terms of quadrupolar order parameter:[9]

where W is the interaction strength, and Qij and QSij are the traceless quadrupolar order parameter and the quadrupolar surface field respectively. Besides Eq. (1), other forms of anchoring, derived from the RP’ s formation, were also reported.[6, 10, 11] Recently scientists have pointed out that RP anchoring is based on an assumption that the tilt distortion is purely induced by the surface grooves and the azimuthal distortion is negligibly small, which is actually invalid for a general θ except for θ = 0 and π /2.[9, 12] Investigations[12– 17] have also proved both theoretically and experimentally that with proper treatment of the anchoring surface, the anchoring energy of grooves substrate due to azimuthal distortion can be proportional to sin4θ . In general, considering the groove pattern and mechanical rubbing, the anchoring energy density can be given as a power series of sin2θ :

where the quadratic term A sin2θ /2 is contributed by surface mechanical rubbing and the quartic one B sin4θ /2 is induced by the groove pattern. B is negative because of the competition between the two opposite contributions of anchoring. Kadivar[18] applied the anchoring energy Eq. (1) rather than the substrate potential proposed by P. Sheng[19] to analyze the wetting behavior of a semi-finite nematic liquid crystal system. Later on the phase transition of a nematic liquid crystal cell was also discussed.[20] However, none of the above studies included the quartic liquid crystal-surface coupling contribution that can be nontrivial, as indicated in the literature.[12– 17]
In this paper, based on the previous investigations and Ginsburg– Landau theory, a general theoretical framework of both quadratic and quartic couplings will be considered in the free energy construction to discuss the wetting behaviors of nematic liquid crystals.
Using quadrupolar order parameters, we generalize the surface energy density Eq. (2) as

where W1 is the positive quadratic liquid crystal-surface coupling strength, and W2 is the quartic coupling strength, which is negative. Substituting the traceless quadrupolar order parameters Qij = 3S(ninj − δ ij/3)/2 and QSij = 3SS(n0in0j − δ ij/3)/2 into Eq. (3), one obtains the surface anchoring energy density free from an external field in terms of order parameters:
where SS is the preferred surface ordering for n = n0, and 1 − (n · n0)2 = sin2θ . Performing ∂ gs/∂ S = 0 leads to a minimum condition of

from which one gets S = SS when θ = 0, as expected. Taking this kind of surface anchoring energy into Ref. [18], one would obtain gs as a function of the order parameter shown by Eq. (6), after performing the tranformation 


where γ is the reduced positive quadratic liquid crystal surface coupling strength, and η is the reduced quartic coupling strength, which is negative.
In this paper, equation (6) is used as the surface free energy to discuss the phase diagram of liquid crystals bounded by surface– laden interfaces. By using the Landau– de Gennes theory, the free energy stored in the liquid crystal cell is calculated and the influence of grooved anchoring energy on the phase is analyzed.
The system we used for investigation is a liquid crystal cell of uniform thickness 2D (2D = 2d/ξ is the reduced cell thickness) with two identical treated substrates situated at z = 0 and z = 2D respectively. An external magnetic field h is applied along the z axis to the liquid crystal system.[21] It is easy to write down the free energy density for the system
in terms of the Maier– Saupe order parameter S(z). Here

is the bulk free energy density which comes from the Landau– de Gennes theory, t = a0(T − T*)/cg2 and h = H2Δ χ /(cg3) (Δ χ is the magnetic susceptibility of liquid crystal) are the reduced temperature and the reduced magnetic field respectively. The second term in the integration describes the one-constant approximation of elastic energy resulting from the inhomogeneous distribution of directors. The last two terms on the right-hand side of Eq. (7) are the surface anchoring energy for two substrates, which includes not only a quadratic term used in our previous study, [20] but also a quartic one.
After a simple calculation of Eq. (7), we get the orientational order profile S(z)
and the free energy of the system
in terms of the order parameter. As D is the dimensionless half sample thickness, fb(Sb)D represents the half bulk free energy when the whole liquid crystal cell exhibits bulk order. The positive sign is taken for dS/dz ≥ 0, while dS/dz ≤ 0, the negative sign is used.
Minimizing the free energy Eq. (10) with respect to S0 and Sb, one obtains the correlation between bulk order and surface order

and

or

Among the multiple pairs of solutions (S0, Sb), the pair corresponding to the lowest FA given by Eq. (10) is the one with structural stability. Here it should be noted that when 1/D → 0, equation (12) reduces to

In our calculation, there are six parameters, i.e. h, γ , η , t, SS, and D, to determine the phase diagram.
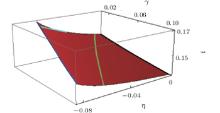
To find out the influence of the quartic coupling on the phase transition of the system, we fix the thickness of the sample 2D, the applied field h, and the substrate order parameter Ss at 20, 0.016, and − 0.3 respectively (the reduced parameters D = 10 and h = 0.016 correspond to d = 2.91 × 10− 6 cm and H = 8.1 × 10⁵ Gs for MBBA (1 GS = 10− 4 T), as an example in this paper). Given a pair of surface coupling strengths γ and η , and a temperature t, the orientational orders of the liquid crystal cell at the interfaces and bulk (S0, Sb) can be obtained by solving Eq. (11) and Eq. (13). If there are different pairs of solutions corresponding to the same minimum value of FA, then the system will undergo a first-order phase transition between the two structures (paranematic and nematic), at the coexisting point (t, γ , η ) in the phase diagram. Figure 1 shows the phase diagrams for the system, where it is found that the larger the quadratic surface coupling strength γ is, the lower the critical temperature is needed to trigger a phase transition, a feature that can be, however, eased by the introduction of quartic coupling energy. This can be reflected by the free energy given by Eq. (10), in which the negative energy contribution (i.e. the energy of the magnetic field) drives the critical temperature of the liquid crystal cell to a higher regime, while the positive energy (i.e the quadratic substrate coupling energy) lowers the phase transition temperature. The sample without quartic coupling experiences a phase transition so that dS/dz of both the nematic phase and the paranematic phase does not change its sign.
 | Fig. 1. Phase diagram for the system, where liquid crystal experiences a first-order phase transition from nematic phase (low temperature and low coupling strength) to paranematic phase at the critical surface (red). In the diagram the blue line is the boundary above which the phase transition disappears, the green one and the light blue one are critical lines across which dS/dz changes its sign. The black line is the phase transition curve without quartic coupling. |
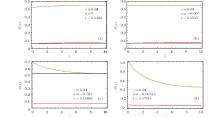
Besides the phase diagram, one can also derive the order distribution of the system using Eq. (9). Figures 2(a)– 2(d) show the order parameters for the paranematic phase (red) and the nematic phase (green) as a function of the z axis when the parameter set falls onto black, green, light blue, and blue lines in Fig. 1 respectively. At phase transition in a cell without the quartic coupling (Fig. 2(a)), liquid crystal jumps from a small paranematic order (red) to a substantial nematic order (green). For a system with quartic coupling at a certain high level, like the green line in Fig. 1, then below the critical surface a uniform nematic order is predominant in the cell (green line in Fig. 2(b)). If the quartic coupling strength of the system falls between the green line and the light blue line (or the blue line) in Fig. 1, then a paranematic order will emerge in the bulk (Figs. 2(c) and 2(d)). In a system above the light blue line (Fig. 1), one sees a uniform paranematic order in both interface and bulk (red line in Fig. 2(c)). No phase transition occurs if the parameter set is above the blue line. Thus we may conclude from Figs. 2(a)– 2(d) that the quartic coupling increases the nematic order at the surface but decreases it in the bulk, indicating that the quartic coupling as a result of the groove pattern makes the liquid crystal molecules align more orderly near the substrate than away from it. Thus the bulk order inside the cell can be adjusted by varying the environmental parameter temperature and anchoring parameters of different orders. On the blue line (the nematic phase order parameter) the surface is close to 1, indicating that the liquid crystal molecules near the surface align in almost perfect order.
 | Fig. 2. The order parameters for paranematic (red) and nematic (green) as a function of the z axis if the parameter set falls onto (a) the black line, (b) the green line, (c) the light blue line, and (d) the blue line in Fig. 1 respectively. The parameters γ = 0.01, η = 0, − 0.007, − 0.037, − 0.06545, and t = 0.1492, 0.1503, 0.15965, 0.17018 correspond to W1 = 2.32 × 10− 9 J· cm− 2, W2 = 0, − 5.323 × 10− 9 J· cm− 2, − 2.813 × 10− 8 J· cm− 2, − 4.977× 10− 8 J· cm− 2, and T = 308.45 K, 308.465 K, 308.548 K, 308.64 K respectively. |
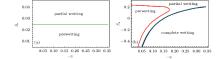
In order to discuss the influence of magnetic field h, the substrate order Ss and the cell thickness 2D on systems having quartic coupling, three wetting diagrams for paranematic wetting in terms of reduced magnetic field h, substrate order Ss, half cell thickness, and quartic coupling strength are shown in Figs. 3– 5 respectively when t = 0.1500 is approached from below. In panel (a) of the figures, the straight green lines without quartic coupling are recognized as the prewetting transition, on which a nematic-paranematic phase transition between partial wetting and prewetting takes place. While in panels (b) when quartic coupling gets involved, one finds a more complicated phase diagram defined by red, green, and black curves, dividing the diagram into prewetting, partial wetting, and complete wetting regimes. With high quartic coupling, the green line in panel (a) bends toward the − η horizontal axis to get into red lines in panel (b), which separate the regions of complete wetting and partial wetting. The black line is a critical line beyond which the first-order phase transition is replaced by continuous phase transition. The confined region between the red line and the black line defines the partial wetting surface. The blue line, on which the liquid crystal molecules close to the substrate arrays most orderly, and the black line confines the prewetting phase. Comparing panel (a) with panel (b) of these figures, we find that surface behaviors such as complete wetting induced by quartic coupling are much different from the one otherwise.
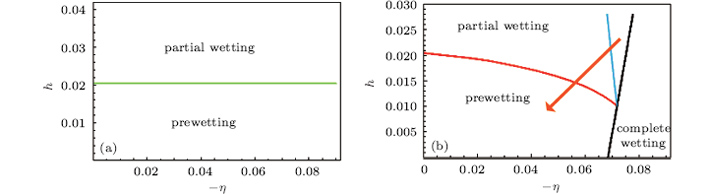 | Fig. 3. Wetting diagram for paranematic wetting when t = 0.1500 (T = 308.46 K) is approached from below, in the parameter space of the surface potential: reduced magnetic field h versus the modulus of the quartic coupling strength − η for Ss = − 0.3, γ = 0.05 (W1 = 1.160 × 10− 8 J· cm− 2), and D = 10 of the system (a) without quartic coupling and (b) with quartic coupling. |
 | Fig. 4. Wetting diagram for paranematic wetting when t = 0.1500 is approached from below, in the parameter space of the surface potential: quadratic coupling strength Ss versus the modulus of the quartic coupling strength − η for h = 0.016, γ = 0.05, and D = 10 of the system: (a) without the quartic coupling and (b) with the quartic coupling. |
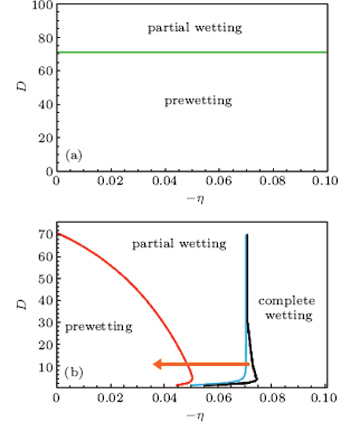 | Fig. 5. Wetting diagram for paranematic wetting when t = 0.1500 is approached from below, in the parameter space of the surface potential: half cell thickness D versus the modulus of the quartic coupling strength − η for Ss = − 0.3, γ = 0.05, and h = 0.016 of the system: (a) without the quartic coupling and (b) with the quartic coupling. |
In summary, we introduced the quartic coupling in terms of quadrupolar order parameter, and analyzed how the wetting behaviors of liquid crystal bounded by surfactant– laden interfaces depend on the quartic coupling intensity, cell thickness, external field, temperature, and substrate order. It is found that the quartic substrate– liquid crystal coupling increases the nematic order at the surface but decreases it in the bulk, indicating that the quartic coupling induced by some groove anchoring patterns makes the liquid crystal molecules align more orderly near the substrate than away from it, which is the reason that generates complete wetting at the surface. The same conclusion can be made with an electrical field since the formation of energy contributed by the electrical field applied to the liquid crystal is the same as that contributed by the magnetic field.
| 1 |
|
| 2 |
|
| 3 |
|
| 4 |
|
| 5 |
|
| 6 |
|
| 7 |
|
| 8 |
|
| 9 |
|
| 10 |
|
| 11 |
|
| 12 |
|
| 13 |
|
| 14 |
|
| 15 |
|
| 16 |
|
| 17 |
|
| 18 |
|
| 19 |
|
| 20 |
|
| 21 |
|