Frequency-locking and threshold current-lowering effects of a quantum cascade laser and an application in gas detection field*
[Chen Wei-Gen, Wan Fu† , Zou Jing-Xin, Gu Zhao-Liang, Zhou Qu]
, Zou Jing-Xin, Gu Zhao-Liang, Zhou Qu]
|
|


Corresponding author. E-mail: wanfuhappy@163.com
Project supported by the Special Funds for the Development of National Major Scientific Instruments and Equipment, China (Grant No. 2012YQ160007) and the National Natural Science Foundation of China (Grant No. 51277185).
In this paper, the frequency-locking and threshold current-lowering effects of a quantum cascade laser are studied and achieved. Combined with cavity-enhanced absorption spectroscopy, the noninvasive detection of H2 with a prepared concentration of 500 ppm in multiple dissolved gases is performed and evaluated. The high frequency selectivity of 0.0051 cm−1 at an acquisition time of 1 s allows the sensitive detection of the (1-0) S(1) band of H2 with a high accuracy of (96.53±0.29)% and shows that the detection limit to an absorption line of 4712.9046 cm−1 is approximately (17.26±0.63) ppm at an atmospheric pressure and a temperature of 20 °C.
Power transformers are essential devices in transmission and distribution systems, in which the working conditions have a critical influence on the safety and reliability of the power system. The thermal and electrical faults that develop in an oil-filled power transformer are always associated with the formation of dissolved gases in the oil, including methane (CH4), ethylene (C2H4), acetylene (C2H2), ethane (C2H6), carbon monoxide (CO), carbon dioxide (CO2), and hydrogen (H2).[1, 2] By dissolved gas analysis (DGA), it is possible to distinguish different types of faults, such as overheating, partial discharge, and arcing.[3, 4] Over several decades of testing and monitoring oil-filled transformers, DGA has been internationally accepted as an effective diagnostic method for detecting incipient transformer faults.[5, 6] Accurate determination of the components and their concentrations of dissolved gases in oil is key to detecting incipient transformer faults by DGA.[7]
Absorption spectroscopy for trace-gas detection with non-destructive and no consumable characteristics is used to detect the dissolved gases of CH4, C2H4, C2H2, C2H6, CO, CO2 or gaseous pollutants.[8– 14] However, little research has been published to detect H2 with high sensitivity because H2 is a homonuclear diatom and has no absorption lines corresponding to usual combination and overtone vibrational or fundamental vibrational transitions in the infrared (IR) region.[15] With the development of new technology, the absorption lines of H2 corresponding to electric quadrupole transitions have been found, which makes it possible to detect H2 using absorption spectroscopy.[16, 17] The strongest absorption line of H2 is (1-0) S(1), which is located at 4712.9046 cm− 1 in mid-infrared region.[18, 19] The recently developed quantum cascade laser (QCL) could work at Peltier cooled operation and provide a compact mid-IR source in tens of mW of continuous wave, which is well suited to trace-gas detection [20]
In this paper, the frequency-locking (FL)[21] and threshold current-lowering effects of QCL are studied and used in a sensitive optical system for detecting H2 at 4712.9046 cm− 1. To achieve the necessary high sensitivity, cavity-enhanced absorption spectroscopy (CEAS)[22] is used to increase the absorption path length. A single cavity ring-down time measurement[23] on the last cavity mode of each laser scan is used to monitor the effective mirror reflectivity and the cavity finesse. According to the experimental absorption spectrum of H2 with a prepared concentration of 500 ppm in multiple gases for an acquisition time of 1 s, the concentration of H2 and the minimum detectable concentration are calculated to be (482.65± 1.43) ppm and (17.26± 0.63) ppm at an atmospheric pressure and a temperature of 20 ° C, respectively.
In an FL-CEAS experiment, if the distance between the laser and the optical cavity is carefully chosen and controlled, then the emitted light will return to the laser cavity after a small delay time, which is called optical feedback (OF). When the laser begins to resonate at the frequency of the OF light, frequency injection locking happens and the laser becomes self-locked, which is a very good way to build up stable modes.[24, 25] Because the coupled laser frequency is strongly influenced by the optical cavity resonance, the function of the laser frequency during injection locking is different from that of a solitary free-running diode laser, which can be derived as[26]

where Δ v is the laser frequency excursion between emitted laser frequency with OF, v, and the value from the free-running laser frequency, vfree; s is the factor of a linewidth enhancement; β is the fraction of OF power; c is the light speed; η ll is the optical length of cavity; H is the reflectivity of laser facet intensity; and, τ is the roundtrip time of returning photon.
The laser frequency excursion will increase until a maximum is reached as the laser remains locked while the free-running frequency of laser continuously tunes with the applied current. At this moment, the laser frequency will jump to the free-running condition and it will scan linearly with the applied current of laser until the next resonance of cavity. If the OF rate is sufficiently large, then frequency locking at the next available resonance will immediately happen.[27]
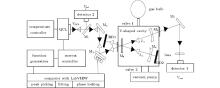
The optical setup of the FL-CEAS system is mounted on a 60 cm× 140 cm breadboard, as depicted in Fig. 1.
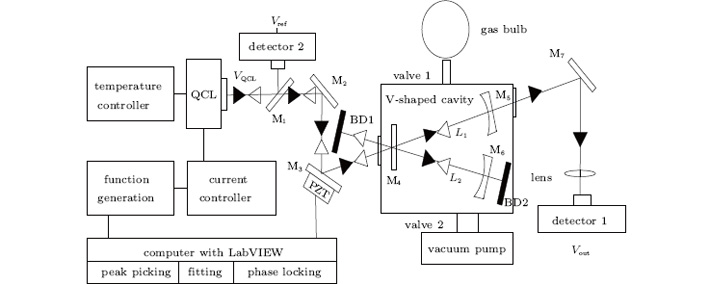 | Fig. 1. Block diagram of the FL-CEAS system. The beam enters from the left after collimation. M3 is mounted on a piezoelectric mirror drive for satisfying the OF phase. L1 = L2 = 48.8 cm (where L1 and L2 are the lengths of the two cavity arms). |
The laser used for the experiment is a single mode, continuous wave QCL from Thales III-V Labs, which is tunable around 2.12 μ m by applied current variation (LDX-3620) and temperature variation (TCU151). The QCL can produce approximately 30 mW of power depending on the operation temperature around − 25 ° C and current around 240 mA. A water chiller is connected to the laser housing for dissipating the heat produced by the QCL thermoelectric cooler.
The V-shape cavity is 48.8 cm long, giving 97.6 cm unfolded cavity length with an approximately 153.7-MHz free spectral range (FSR) created by using LonhStar Optics high-quality mirrors (M4, M5, and M6), which are dielectrically coated CaF2 with a theoretical reflectance less than 0.2% on the rear face and more than 99.8% on the front face. The mirror in the center of the cavity (M4) is planar while the mirrors at the ends (M5, M6) are concave, each with a curvature radius of approximately 0.9 m. After collimation, about 90% of laser beam, VQCL, goes through a wedged ZnSe mirror M1, reflected by M2 and enters the cavity from the rear face of mirror (M4). The entering beam goes with multiple reflections among the front faces of mirrors (M4, M5, and M6), and then part of enhanced laser beam after multiple passes goes out from the front face of mirrors (M5), reaches detector 1, which generates the output signal, Vout. About 10% of VQCL is reflected by M1, generating the reference signal, Vref, from detector 2, which allows the correction to power variation of gas absorption loss. The detectors (from VIGO Company) are stage thermoelectrically cooled. A GaAs hyper-hemi spherical lens in the detectors provides optical immersion, effectively increasing the active area by 0.32 mm × 0.32 mm. The beam dump (BD) 1 is used to prevent the back reflection of M4 and BD 2 is used to prevent the transmission beams of M6, respectively.
A chamber made of stainless steel houses the optical cavity, which can be pumped down to less than 150 Pa using a scroll pump (EDWARD). The volume of the chamber is about 60 cm × 40 cm × 20 cm, allowing gas exchange rates of several Hertz to be easily achieved. The air-tightness of the chamber is very stable with a leaking rate of approximately 3 Pa per hour. The gas bulk is used to store the sample gases.
A National Instruments USB-6251 data acquisition (DAQ) board is used to sample the signals from the detectors at 100 kHz and provides system control by a computer running LabVIEW software. Based on the symmetry of the individual cavity modes, LabVIEW codes have been programmed to adjust a piezoelectric (PZT) mirror driver (Thorlabs, MDT694A) attached to M3, which allows us to continuously optimize the distance between the cavity and the laser, maintaining the phase matching of the returning light in resonance with the cavity.
The laser-cavity distance could be set to be within about 20 μ m of the correct value by adjusting the three micrometer-adjust translational stages on which two steering mirrors (M2, M3) and the QCL are mounted. Let the distance from laser to M4 be equal to L1 (L1 = L2) to ensure that all of the excitations at cavity resonant frequencies return to the laser with the same phase. Set the temperature of laser at − 20 ° C and tune the current of laser at ± 20 mV (2.2 mA) with a sweep rate of 20 Hz. Within the cavity response time, the frequency locking is optimized by running a LabVIEW control system.
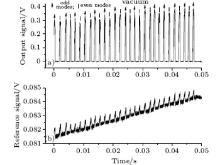
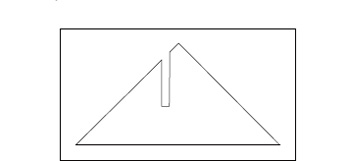
When a steady state is reached, the power exited from the cavity is equal to the power coupled into the cavity. During the rising ramp of the applied QCL current, the cavity modes that are built-up are much more stable than during the equivalent falling ramp, for which the OF seems to have a smaller influence on the QCL emission and the modes built-up is inferior. As shown in the upper panel of Fig. 2, the signal goes up tightly during the rising ramp of the applied current. The alternative higher modes and lower mode structure in vacuum are known as even and odd longitudinal modes (TEM00) for V-shape cavity because the central folding mirror, M4, of the V-shape cavity has a different effect on the mode intensity: even modes have a maximum of intensity at M4, while odd modes have a node of intensity at this point. This difference affects the amount of reflection loss at the mirror surface and, consequently, it affects the radiation leaking out of the cavity through M4 as well as the intensity on each even and odd modes.[28, 29] When analyzing these modes, they should be separated into two families, each of which has their own characteristic baseline losses.
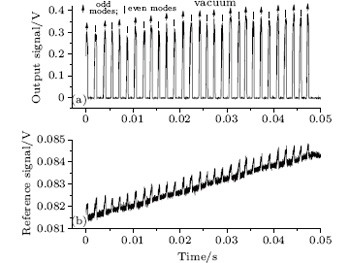 | Fig. 2. (a) Even and odd modes in vacuum. (b) Threshold current-lowering effect of optical feedback on QCL. |
For the QCL, the injection current excites the electrons supplied by gain medium to form a population inversion. The QCL will take effect when the number of photons produced by stimulated and spontaneous emission during a round trip of the laser cavity exceeds the number of photons lost due to waveguide adsorption and transmission absorption of the laser end facets. At this point, the injection current is called the threshold current.[30]
The lower panel of Fig. 2 illustrates the threshold current-lowering effect in our optical system. The reference signal where modes are built up is 8.5 × 10− 4 V bigger than the signal without modes, which indicates that the threshold current is reduced by approximately 1.18 mA. Under external optical feedback, the photons back to the laser cavity will stimulate further photon emission and lower the threshold current, which is good to enhance the measurement sensitivity. The threshold current of QCL under the effect of external optical feedback, Ith, OF, can be precisely calculated through[31, 32]

where Ith, fd, τ p, r, and κ are the threshold current of the free-running laser, the longitudinal mode spacing, the laser photon lifetime, the laser cavity reflection coefficient, and the current gain coefficient, respectively.
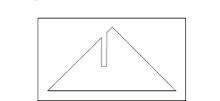
Both the effective reflectivity and the optical system constant are very important parameters, which can be deduced by the ring-down time, τ 0, through cavity ring-down spectroscopy (CRD) experiment.[22, 23] For CRDS, the laser should be shut off effectively and instantaneously to remove the resonance of the laser from a built-up mode, which can be achieved by adding a square wave to the applied laser current ramp of the last cavity mode, as shown in Fig. 3.
 | Fig. 3. Modified waveform for shutting off the laser. |
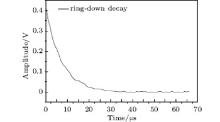
Figure 4 shows the result of a single ring-down decay trace of the system. The ring-down time, τ 0, is about 7.224(17) μ s. The effective reflectivity R of the mirror is about 99.977% at 2.12 μ m, which is determined from ln R = − (L1+ L2)/(2cτ 0). For a V-shape cavity, this reflectivity implies a cavity finesse, F, (= π R/(1− R2) of 6828, which corresponds to 4346 (= 2F/π ) passes for the average photon and hence an effective optical path length of 4.24 km in a cavity with a physical length of only 48.8 cm.[33, 34] The constant value of the whole FL-CEAS system, Csys, is equal to 7.97 × 10− 6 cm− 1, which is determined by measuring Vout, Vref, and the absorption coefficient through the method of measuring the ring-down time (α = 1/cτ 0 = 4.62 × 10 − 6 cm− 1) for a single mode from[35, 36]

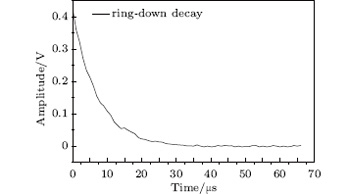 | Fig. 4. A single experimental ring-down decay. |
The dissolved gases H2, CH4, C2H4, C2H2, C2H6, CO, and CO2 at a prepared concentration of 500 ppm in the carrier gas of Ar are injected into the chamber through pneumatic valve 1 until atmospheric pressure and they can exit through valve 2 if need be. FL-CEAS is capable of recording H2 absorption line profiles rapidly (5000 data points in 0.05 s). To find the band of H2 (1-0) S(1) at 4712.9046 cm− 1, [19] a spectral search near the point within the working range of the laser from 4712.8100 cm− 1 to 4712.9950 cm− 1 is conducted by setting the temperature of the laser at − 25 ° C and tuning the applied QCL current with a sweep rate of 20 Hz.
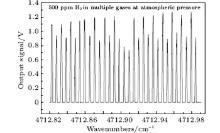
The absorption spectrum of H2 in multiple gases at atmospheric pressure and temperature of 20 ° C is presented in Fig. 5. The effect of the absorption of (1-0) S(1) for H2 can be clearly seen when compared with the modes in vacuum of Fig. 2. The mode resolution is about 5.1 × 10− 3 cm− 1, which is almost the same as the calculated value from the FSR of the system. The detector signals are averaged 20 times, as determined by Allan variance, and analyzed using LabVIEW and Origin. The LabVIEW program determines the normalized mode amplitudes of Vout and Vref for each cavity resonance through a peak picking algorithm. Fitting results are converted into absolute concentration values [X] through[37]

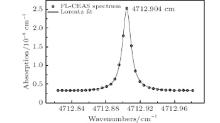
where N = 2.48 × 10¹⁹ molecule· cm− 3 is the molecular number density at atmospheric pressure and cavity temperature of 20 ° C; line integrated absorption cross section, σ INT, is 3.18 × 10− 26 cm− 1/molecule· cm− 2; [19]α INT is the line integrated absorption coefficient (in units of cm− 2), which is determined by fitting the absorption spectrum in Lorentz line-shape, as shown in Fig. 6. The calculated value of (482.65± 1.43) ppm is almost the same as the actual value of 500 ppm. So the relative measurement error is only (3.47± 0.29)%.
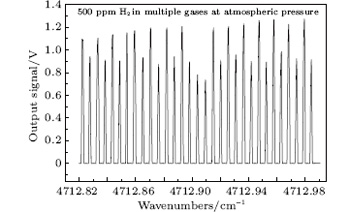 | Fig. 5. Absorption spectrum of H2 centered around 4712.9046 cm− 1 in multiple gases at atmospheric pressure and temperature of 20 ° C. |
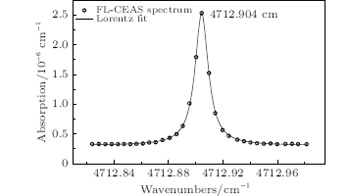 | Fig. 6. FL-CEAS spectrum of H2 (dot) and the fitted Lorentz line-shape (line). |
The measurement sensitivity of the QCL FL-CEAS system can be estimated from the noise on the measurement through[38, 39]

where σ is the standard deviation from the fit of the baseline. For an acquisition time of 1 s, this value is (9.82± 0.36) × 10− 11 cm− 1; γ is the collision broadening half high width.[18, 19] The minimum detectable number density will be calculated to be (4.28± 0.16) × 1014 molecule· cm− 3 for H2, corresponding to (17.26± 0.63) ppm at an atmospheric pressure and a cavity temperature of 20 ° C.
For QCL, , because of the frequency-locking effect, optical feedback and threshold current-lowering effect of about 1.18 mA are achieved. Based on mid-infrared QCL cavity-enhanced absorption spectroscopy, the sensitive detection of H2 is presented and evaluated. An effective mirror reflectivity of 99.977% at 2.12 μ m and a cavity finesse of 6828 are obtained through measuring a single cavity ring-down time. The spectral resolution is about 5.1 × 10− 3 cm− 1. At an atmospheric pressure and a temperature of 20 ° C, the relative measurement error and minimum detectable concentration for H2 are approximately (3.47± 0.29)%and (17.26± 0.63) ppm, respectively. In this work, we demonstrate for the first time (to the best of our knowledge) the high potential of FL-CEAS coupled with mid-cw QCL light sources for H2 analysis.
The authors are grateful to all members of spectrum research group at our state key laboratory for their contributions to this study.
| 1 |
|
| 2 |
|
| 3 |
|
| 4 |
|
| 5 |
|
| 6 |
|
| 7 |
|
| 8 |
|
| 9 |
|
| 10 |
|
| 11 |
|
| 12 |
|
| 13 |
|
| 14 |
|
| 15 |
|
| 16 |
|
| 17 |
|
| 18 |
|
| 19 |
|
| 20 |
|
| 21 |
|
| 22 |
|
| 23 |
|
| 24 |
|
| 25 |
|
| 26 |
|
| 27 |
|
| 28 |
|
| 29 |
|
| 30 |
|
| 31 |
|
| 32 |
|
| 33 |
|
| 34 |
|
| 35 |
|
| 36 |
|
| 37 |
|
| 38 |
|
| 39 |
|