
Excellent acetone sensing properties of porous ZnO*
Cite this Article
Liu Chang-Bai, Liu Xing-Yi, Wang Sheng-Lei. Excellent acetone sensing properties of porous ZnO* . Chinese Physics B, 2014, 24(1): 018503 
Permissions
Excellent acetone sensing properties of porous ZnO*
Corresponding author. E-mail: liwei99@jlu.edu.cn
Projected supported by the Project of Challenge Cup for College Students, China (Grant No. 450060497053).
Abstract
Porous ZnO was obtained by hydrothermal method. The results of scanning electron microscope revealed the porous structure in the as-prepared materials. The acetone sensing test results of porous ZnO show that porous ZnO possesses excellent acetone gas sensing properties. The response is 35.5 at the optimum operating temperature of 320 °C to 100 ppm acetone. The response and recovery times to 50 ppm acetone are 2 s and 8 s, respectively. The lowest detecting limit to acetone is 0.25 ppm, and the response value is 3.8. Moreover, the sensors also exhibit excellent selectivity and long-time stability to acetone.
Keyword:
85.85.+j; 85.35.–p; 81.07.–b; porous ZnO; acetone; gas sensor
1. Introduction
ZnO has always been one of the most interesting and promising semiconductor oxides for the large band gap, electro– optical properties, electrochemical stability, and plentiful amount in nature.[1] Hence, ZnO as one of the important semiconductor oxides, has been widely used in luminescence, [2] photosensitization, [3] magnetic semiconductors, [4] gas sensors, [5] and solar cells.[6] So far, lots of efforts have been made to present and enhance varieties of properties of ZnO. Especially in the field of gas sensors, ZnO as the common gas sensitive material, has been used to detect ethanol, acetone, H2, H2S and NH3 successfully.[7– 10] Nowadays, with the wide applications of the micro- and nano-materials, numerous efforts have been made to obtain ZnO with different morphologies and structures in the micro- and nano-scale. For instance, Liu et al. have prepared aligned ZnO nanotubes via electrospinning and sputtering techniques. It has been found that the aligned ZnO nanotubes demonstrated the sensing properties to H2.[11] Navale et al. have reported that the ZnO microrods were synthesized using the less explored hydrazine method. A gas sensing study proved that the ZnO microrods showed high efficiency and selectivity towards LPG at operating temperatures from 250 ° C to 350 ° C.[12] Wang et al. have obtained the different-shelled ZnO hollow microspheres by a simple green chemistry route.[13] The gas sensing tests revealed that the response of the hollow ZnO microspheres to formaldehyde increased with the increase of the number of shell structures. However, most studies concentrated on their attention on hollow structures to enhance gas sensitivity. In fact, three-dimensional hierarchical structures also have a positive effect on gas sensing properties and the related reports are rare.
Acetone is a kind of explosive and toxic gas. Therefore, the acetone gas sensor with fast response/recovery times is the necessary factor for practical applications. Moreover, selectivity is the other challenge for acetone sensor practical applications. For detection of acetone, ethanol is usually an interfering gas with a similar chemical nature, which often has similar sensitivity in the same condition.[14]
In our work, hedgehog-like porous ZnO was prepared by using hydrothermal method, which has been seldom reported. The gas sensing tests show that the as-prepared porous ZnO possesses fast response/recovery times and a high response to acetone. The lowest detecting limit of the pure ZnO to acetone is 0.25 ppm, and the response value is 3.8, which has been rarely reported. Moreover, excellent selectivity is also observed in our experiment, the pure ZnO can successfully distinguish acetone and ethanol.
2. Experimental
Zinc nitrate hexahydrate (Zn(NO3)2· 6H2O, ≥ 99.0%) and hexamethylenetetramine (C6H12N4, ≥ 99.5%) were purchased from Sigma-Aldrich (USA). The chemical reagents used were analytical grade and used without further purification.
1.8-g Zn(NO3)2· 6H2O and 0.6-g C6H12N4 and 0.4-g urea were mixed with 50-mL deionized water. The mixed solution was under vigorous stirring for 2 h. Then, the mixed solution was poured into a Teflon-lined stainless steel autoclave with a capacity of 50 mL. Then the autoclave was heated to 100 ° C and kept for 5 h. After the autoclave cooled to room temperature, the white precipitate was collected by centrifugation and washed with distilled water and ethanol several times, and dried in a vacuum at 50 ° C overnight. For the heat treatment, the samples were annealed at 450 ° C for 1 h. Finally, the porous ZnO was obtained.
The process of gas sensor fabrication is as follows. The samples of ZnO were mixed with deionized water and formed a paste. The paste was coated on a ceramic tube on which a pair of gold electrodes was previously printed, and a pair of Ni– Cr heating wire was inserted into the ceramic tube to form a gas sensor. The gas sensor was dried and aged for about a week before the first measurement.
Gas sensing tests were operated on CGS-1 (Beijing Elite Tech, Beijing, China). The response of sensors was studied in a sealed test chamber, the testing background gas was air. The target gas was injected into the test chamber mixed with air. Before the sensors’ testing, gas sensors would have been stable at the target temperature. When the resistance of the sensor was stable, target gas was injected into the test chamber by a micro-injector through a rubber plug. After the value of the gas sensor resistance reaches a new value, we open the test chamber to recover the gas sensor in air. The sensor resistance and response values were obtained by the analysis system. The sensor sensitivity is defined as β = Ra/Rg, where Ra and Rg are the electrical resistance of the sensor in air and in target gas, respectively. The time taken to achieve 90% of the resistance variation is defined as the response time. After taking the sensor out of the target gas, the time that resistance returns 90% of the resistance variation is defined as the recovery time.
Scanning electron microscopy (SEM) images were performed on a SHIMADZU SSX-550 instrument. X-ray diffraction (XRD) was conducted on a Scintag XDS-2000 x-ray diffractometer with Cu Kα radiation (λ = 1.5418 Å ).
3. Results and discussion
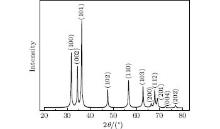
The x-ray diffraction pattern of the as-prepared porous ZnO is presented in Fig. 1. The primary peaks can be indexed to the hexagonal ZnO, all diffraction peaks coincide with JCPDS card of No. 89-0511. The lattice constants are a = 3.249 Å , b = 3.249 Å , c = 5.205 Å . No other impurity peaks are detected, indicating the non-existence of other impurities.
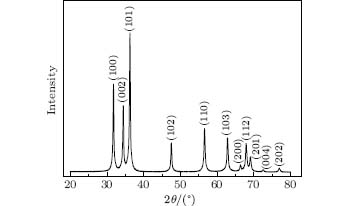 | Fig. 1. XRD patterns of porous ZnO. |
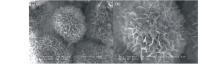
Figure 2 shows the SEM image of the as-prepared ZnO sample. It can be easy to find that ZnO distributes at random and forms the spherical clusters. The scales on a single sphere compose numerous holes. The average diameter of one sphere is 15μ m. From Fig. 2, it is clear to see that the samples of hedgehog-like porous ZnO possess a large specific surface, which can provide more space to make acetone react on the surface of porous ZnO. The morphologies of hedgehog-like porous ZnO can significantly enhance the contact area between the target gas and porous ZnO. Besides, the plentiful holes can also improve the response and recovery speed that makes acetone more easily desorbed from ZnO. Hence, the sensor based on hedgehog-like porous ZnO probably has an excellent gas sensing property.
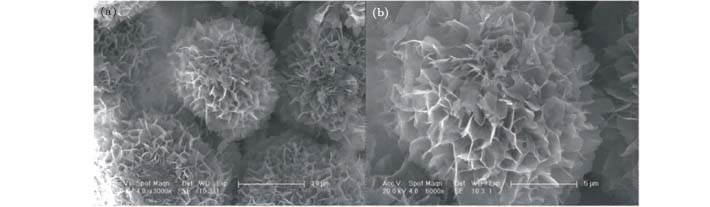 | Fig. 2. SEM image of porous ZnO under (a) low and (b) high magnification. |
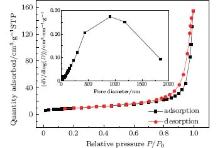
The pore size distribution curve (inset) and nitrogen adsorption and desorption isotherms of ZnO samples are shown in Fig. 3. The isotherms are type-II, indicating that ZnO possesses an appreciable amount of macroporous structures. The inset figure also reveals the existence of porous structures. The results have good consistency with the SEM observations. The BET specific surface area of ZnO samples is about 34 m2/g. The big BET specific surface area can be ascribed to the morphology of porous, which is good for gas response.
 | Fig. 3. Pore size distribution curve (inset) and nitrogen adsorption and desorption isotherms of ZnO samples. STP means standard temperature and pressure. |
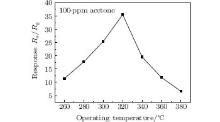
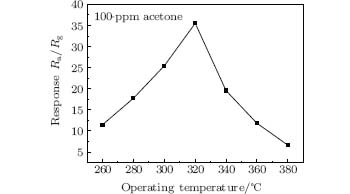
Gas sensing experiments are performed at different operating temperatures in order to obtain the optimal operating temperature.[15] Figure 4 shows the responses of porous ZnO gas sensors to different temperatures under 100-ppm acetone. We can see from the figure that the response achieves the maximum at 320 ° C, and the value is 35.5. At first, the response increases with the increase of temperature. Then the value of response decreases rapidly. This phenomenon may be due to the kinetics and mechanics of gas adsorption and desorption on the surface of semiconducting metal oxides, when the operating temperature is too low, the chemical activation of porous ZnO is small, leading to a low response. When the operating temperature increased too much, some adsorbed oxygen species may escape before their reaction due to their enhanced activation, thus the response will decrease correspondingly. Hence, the maximum value of sensitivity can only be obtained at a suitable temperature.[16, 17] In our case, 320 ° C is proved to be the optimum operating temperature. Therefore, 320 ° C is used in the measurement of other gas sensing properties.
 | Fig. 4. Responses of porous ZnO gas sensors to 100-ppm acetone at different operating temperatures. |
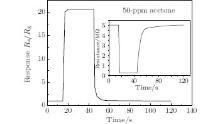
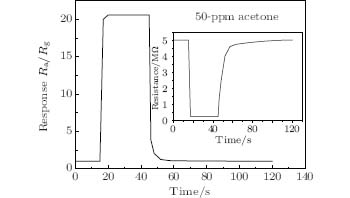
Response and recovery behavior is an important characteristic for evaluating the performance of gas sensors. Figure 5 shows the response– recovery curve of porous ZnO gas sensor to 50-ppm acetone at 320 ° C. The response and recovery times of the porous ZnO gas sensor are 2 s and 8 s, respectively.
 | Fig. 5. Response– recovery time curve of porous ZnO gas sensor to 50-ppm acetone at 320 ° C. |
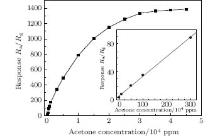
Figure 6 shows the responses of porous ZnO gas sensor to different concentrations of acetone at 320 ° C. It is easy to see that when the concentration is below 300 ppm, there is a linear relation between response and acetone gas concentration. However, the response increases slowly as the acetone concentration is above 20000 ppm, and finally reaches the saturation value at about 3000 ppm. Otherwise, the limit detection to acetone of porous ZnO gas sensor is 0.25 ppm, and the value is 3.8, which is important to develop a new acetone sensor with a high response and workability.
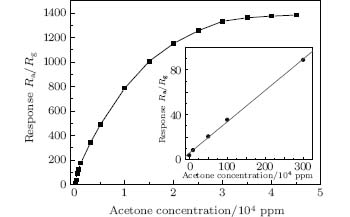 | Fig. 6. Response values of porous ZnO gas sensor to different concentrations of acetone at 320 ° C, the insert shows the calibration curve in the range of 0.25– 300 ppm. |
Compared with the reported articles, the sensor based on hedgehog-like porous ZnO presents advanced sensitivity to acetone. The sensitivity of acetone sensors based on α -Fe2O3, [18] WO3, [19] Ag-TiO2, [20] and ZnO[21] to 100-ppm acetone is about 16, 13, 4, and 3.5, respectively. In our work, the sensor based on hedgehog-like porous ZnO is about 35.5, which is 2.2, 2.73, 8.86, and 10.14 times larger than those of α -Fe2O3, WO3, Ag-TiO2, ZnO, respectively. The result reveals that the sensor based on hedgehog-like porous ZnO shows an excellent acetone sensing property.
Figure 7 shows the response of porous ZnO gas sensor to 50 and 100-ppm acetone, ethanol, toluene, butane, hydrogen, ammonia, carbon monoxide and methane at 320 ° C, respectively. We can see from the figure that, the response of porous ZnO gas sensor to 100-ppm acetone is 35.5, which is 5 times larger than that to 100 ppm ethanol, which has the greatest impact on acetone among the interference gases, indicating the good selectivity of porous ZnO gas sensor. As shown in Fig. 7, the response values to different gases are different, which may be due to the characteristics of materials. The species and activities of adsorbed oxygen on the surface are not the same in different materials. For a certain material, different gases have different optimal operating temperatures.[22, 23] Therefore, the responses of different gases are inconsistent at the same temperature, which reflects the selectivity.
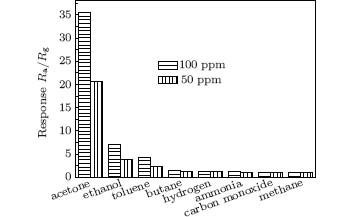 | Fig. 7. Responses of porous ZnO gas sensor to 50 and 100 ppm different gases at 320 ° C. |
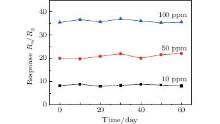
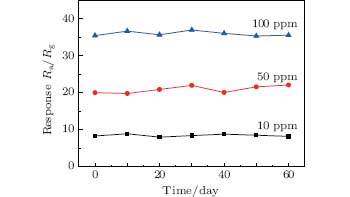
The long-time stability of porous ZnO gas sensor has also been measured and shown in Fig. 8. It can be seen that the sensors exhibit nearly constant sensor signals to 10, 50, and 100-ppm acetone during the tests, confirming the good stability of the sensor.
 | Fig. 8. Long-time stability of porous ZnO gas sensor. |
The sensing mechanism of ZnO can be demonstrated by the capture and release processes of electrons on the surface of ZnO.[24– 26] At first, when ZnO is in air, its surface will be surrounded by oxygen molecules, which will extract electrons from it and be ionized to 
4. Conclusion
In summary, porous ZnO was synthesized by hydrothermal method. The acetone sensing properties were studied in our experiment. The results show that the optimum operating temperature to detect acetone is 320 ° C, at which temperature the response is 35.5 when exposed to 100-ppm acetone. The response and recovery times to 50-ppm acetone are 2 and 8 s, respectively. The lowest detecting limit to acetone is 0.25 ppm, and the response value is 3.8. Moreover, the sensors also exhibit excellent selectivity and long-time stability to acetone. The porous ZnO has the potential to make the practical acetone gas sensor.
Reference
| 1 |
|
| 2 |
|
| 3 |
|
| 4 |
|
| 5 |
|
| 6 |
|
| 7 |
|
| 8 |
|
| 9 |
|
| 10 |
|
| 11 |
|
| 12 |
|
| 13 |
|
| 14 |
|
| 15 |
|
| 16 |
|
| 17 |
|
| 18 |
|
| 19 |
|
| 20 |
|
| 21 |
|
| 22 |
|
| 23 |
|
| 24 |
|
| 25 |
|
| 26 |
|