Applicability of the vortex-glass model for the single crystal Tl0.4K0.41Fe1.71Se2*
Cite this Article
Yu Yi, Wang Chun-Chang, Wang Hong, Li Qiu-Ju, Zhang Chang-Jin, Pi Li, Zhang Yu-Heng. Applicability of the vortex-glass model for the single crystal Tl0.4K0.41Fe1.71Se2* . Chinese Physics B, 2014, 24(1): 017401 
Permissions
Applicability of the vortex-glass model for the single crystal Tl0.4K0.41Fe1.71Se2*
Corresponding author. E-mail: onlyyuyi@mail.ustc.edu.cn
Project supported by the National Natural Science Foundation of China (Grant Nos. 11404002, 11404003, and 11074001) and the Scientific Research Foundation for the Returned Overseas Chinese Scholars, and the “211 Project” of Anhui University, China (Grant No. J01001319-J10113190007).
Abstract
We measure the current–voltage ( I– V) characteristics for the single crystal of Tl0.4K0.41Fe1.71Se2 with the superconducting transition temperature ( TC) around 30.5 K, under a 10 T magnetic field applied perpendicular and parallel to the ab plane. We find that the shapes of the I– V isotherms are very different from the description by the vortex-glass (VG) model. Combining theoretical calculations and analysis of the ρH⊥ ab– T and ρH∥ ab– T data, we give an explicit discussion over the suitability of the VG model for the A0.8Fe2Se2 superconductors, and point out the possibility of the material acting as a convenient platform for re-examination and further study of the complex vortex behaviors in the layered superconductors.
Keyword:
74.25.F–; 74.62.En; 74.20.Rp; 74.70.Xa; iron-based superconductor; vortex-glass model; flux flow; pinning
1. Introduction
The iron-based superconductors have drawn great attention since their discovery, [1] especially because of their transport properties. Some iron-based superconductors display good potential for practical applications, e.g., the superconductivity of A0.8Fe1.7Se2 series possess excellent sustainability under high magnetic field. Thus, it is especially important and necessary to study the vortex dynamics of the iron-based superconductors to obtain better application.
As we know, the vortex dynamics of a traditional s-wave superconductor can be well described by the Kim– Anderson model.[2, 3] While the vortex behavior of cuprate superconductors usually fit the vortex-glass (VG) model.[4, 5] The VG model suggests a phase transition from the vortex liquid phase to the vortex solid phase once the temperature drops below TM, where TM is defined as the vortex glass transition temperature. The suitability of the VG model has been testified in various superconductors such as YBCO, [6, 7] Tl2Ba2CaCu2O8, [8] and MgB2.[9] However, there have been arguments over the suitability of the VG model for iron-based superconductors recently.[10] To study the vortex dynamics of iron-based superconductors, we choose a typical layered compound Tl0.4K0.41Fe1.71Se2 single crystal as the subject.
In this paper, we fabricate high-quality Tl0.4K0.41Fe1.71Se2 single crystals. We examine I– V curves of Tl0.4K0.41Fe1.71Se2 single crystal around TC under a magnetic field as high as 10 T, yet have trouble understanding it with the vortex glass model. We give explicit and reasonable explanations of the phenomenon.
2. Experiment
Single crystals of Tl0.4K0.41Fe1.71Se2 are prepared through the self-flux method. The details have been reported elsewhere.[11] The crystals are shiny on the surface and easy to cleave off the mixture. The sample dimensions are measured to be 5× 7.17× 0.05 mm3. The superconductive transition width is within 0.4 K, reflecting the excellent quality of the single crystal. The intersecting point of linear extrapolating lines from the normal state and the steep transition area gives TC = 30.63 K. The I– V and ρ – T tests under less than 300 K are taken using a four-probe method on a PPMS device (Quantum Design), with various magnetic fields applied perpendicularly and parallel to the sample. The current flow is confined within the ab plane of the sample.
During the I– V measurement, the sample’ s surrounding temperature might be raised due to Joule heating. In order to limit this temperature lift, on one hand, the shape of the sample is chosen properly to obtain a rather small resistance; on the other hand, the maximum of current is strictly controlled (below 200 mA). All the curves used in the final scaling have temperature ranges within 0.1 K. Measurements on several different samples from the same batch lead to similar results.
The angle between the sample and the magnetic field is decided as follows. We apply a 1 T field to the sample and find the middle point of the superconductive transition. Then we fix the temperature to this point, and precisely measure the resistivity while the angle is changed from 0° to 360° . Angles at which the resistivity values reach extrema correspond to the orientations where the field is applied perpendicularly and parallel to the ab plane.
3. Results and discussion
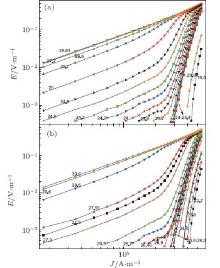
The E– j isotherms under the magnetic field of 10 T are presented in Fig. 1. We calculate the glass correlation length ξ 0[16] to decide whether to use the quasi-two-dimensional (2D) or the 3D scaling. We obtain a value of 970 Å under 10 T (our result of ξ 0 gradually increases with increasing field, as reported previously), which is certainly large enough to indicate the 3D behavior. According to the vortex-glass theory, one should be able to get the power exponent law of E versus j near TM, i.e., E(j, T) ≈ j(z+ 1)(d− 1), where z is the dynamic critical exponent, d is the dimension, and TM is defined as the vortex-solid melting transition temperature. From empirical law, we know that U(j) ∝ 1/jμ , where U(j) is the thermal activation energy, while μ is the power exponent. When j → 0, the activation energy U(j), i.e., the potential barrier, increases to infinity. Thus, the linear resistivity (ρ lin) vanishes upon the appearance of a vortex-glass phase when the temperature drops below TM. We might define the vortex correlation length ξ M and relaxation time τ M as 
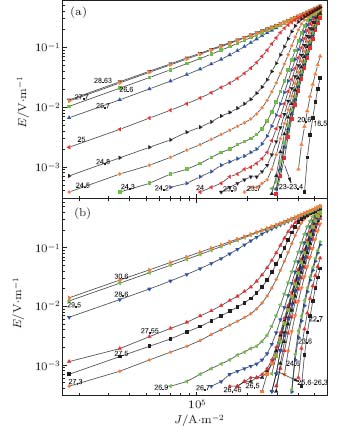 | Fig. 1. The j dependence of E in double logarithmic coordinate. (a) E– j curves measured at various temperatures under a 10 T magnetic field applied perpendicularly to the ab plane. (b) E– j curves measured at various temperatures under a 10 T magnetic field applied parallel to the ab plane. |
 |
and
 |
we should be able to complete the scaling for the two magnetic field orientations.
As can be seen from Fig. 1, it is difficult to find an absolute straight line in the logarithmic coordinate, as predicted by the VG model. There is no existence of the absolute “ vortex liquid phase” and “ vortex solid phase” that the VG theory predicts, and thus no proper TM value to perform the universal scaling. This clearly indicates that in this case, the VG theory is unable to describe the vortex dynamics of Tl0.4K0.41Fe1.71Se2.
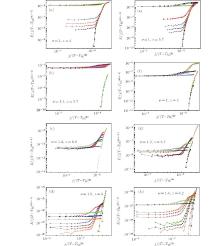
We try ergodic TM values in our measuring interval, and adjust the values of the two exponents z and ν . However, it is still unable to obtain a decent scaling for present data. Some of the best scaling results available are shown in Fig. 2. One can see that when the TM value decreases, the curves begin to display severe disorder in the high-dissipation region. On the other hand, obvious divergence emerges in the lower branch when TM value increases. It is worth mentioning that the temperature lift due to the Joule heating becomes severe at low temperature. In order to exclude the possibility that proper TM values might exist at temperatures lower than the measuring ranges, we also try to scale with TM at low temperatures down to 4 K, without decent results. The results at 4 K are shown in Figs. 2(d) and 2(h). This clearly indicates that in this case, the VG theory is unable to describe the vortex dynamics of Tl0.4K0.41Fe1.71Se2.
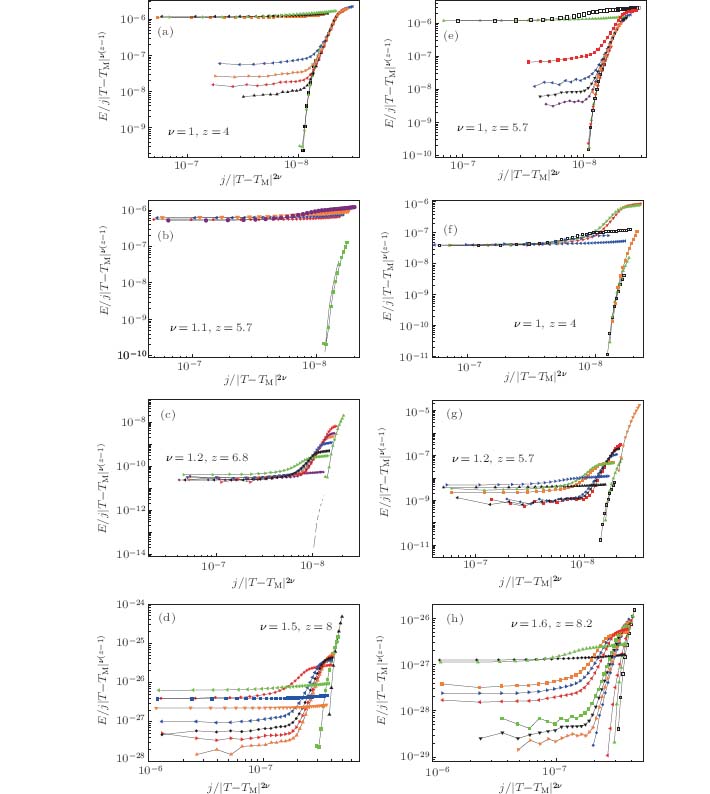 | Fig. 2. The best scaling obtained with TM set as (a) 25 K, (b) 23.7 K, (c) 22 K, (d) 4 K under a 10 T magnetic field applied perpendicularly to the ab plane. The best scaling obtained with TM set as (e) 28 K, (f) 26.2 K, (g) 25 K, (h) 4 K under a 10 T magnetic field applied parallel to the ab plane. |
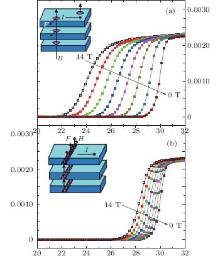
The reason could be retraced to the establishment of the VG theory. Without different treatments for the different layers of the compounds, the VG theory was built to describe the cuprates, which could be treated as homogeneous anisotropic superconductors. However, the Tl0.4K0.41Fe1.71Se2 single crystal might not be the case here. The Tl0.4K0.41Fe1.71Se2 compound has a layered structure with intercalating Tl(K) layers and FeSe layers. The FeSe layers are superconductive, while the Josephson junction region (Tl(K) layers) could also be superconductive as a result of the proximity effect. However, the superconductivity is very weak compared to the strong superconductive FeSe layers, and therefore, much easier to undergo the transition to the normal state. Could such a compound still be treated as a homogeneous one? In order to clarify this, we measured the temperature dependence of resistivity under different magnetic fields perpendicular and parallel to the ab plane, as shown in Fig. 3.
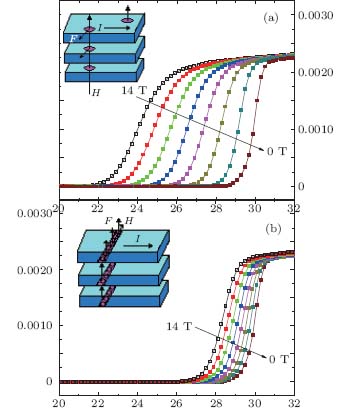 | Fig. 3. Temperature dependence of the resistivity for Tl0.4K0.41Fe1.71Se2 single crystal under magnetic field of μ 0H = 0, 2, 4, 6, 8, 10, 12, 14 T applied (a) perpendicularly and (b) parallel to the ab plane. |
Similar curves have been seen in the case of Bi2Sr2CaCu2O8; [12] the broadening in the low-temperature region was well explained by the flux creep behavior, within the framework of the Anderson– Kim flux creep model. Zeldov et al. relates the broadening to the existence of a logarithmically shaped flux line potential well, [13] as he did to YBa2Cu3O7 films.[14] For the alternative, Chen et al. described the phenomenon with the bipolaron theory.[15] For the present data, the pinning is not as strong as in cuprates, and the pinning force could be overshadowed by the driving force under high magnetic fields. Therefore, sole consideration of the flux creep behavior is insufficient, and the effects of flux flow motion must be included. It could be easily observed that the resistivity display dramatic contrasting behaviors with different field orientations, as a result of the material’ s structure and vortex mechanisms. Take the curves corresponding to the 14 T field for example, 

On the other hand, when the field is applied parallel to the ab plane, an orthogonal elongated lattice of elliptical vortex strings forms. Here the FL is perpendicular to the ab plane, thus the vortex must cross the Josephson junction region. In this case, the weak inter-layers, i.e., the Josephson junction region would act as barriers which hinder the motion of the vortex. At low temperatures, the strong pinning overshadows the FL, thus the vortex cannot climb over the barrier. With ascending temperature, the thermal fluctuation offers extra energy, which leads to the recovery of the superconducting layers into the normal state. Thus, what we see is a sudden and sharp transition, in great contrast with the slow recovery in the H ⊥ ab-plane case.
One thing that has to be particularly noted for Tl0.4K0.41Fe1.71Se2 is that its superconducting shielding volume is very small, which only composes 20%– 30% of the total volume. Its inhomogeneity exists not only between different orientations, but also amongst the same layer. Abundant experimental evidence has proven the AxFe2− δ Se2 series to be a phase-separated system.[17– 19] Take the compound KxFe2− δ Se2− y for example, four phases in all have been detected, including the parent compound KFe2Se2 with 


As we could see from above, the Tl0.4K0.41Fe1.71Se2 superconductor is not a homogeneous material at all, the two distinct types of layers display two totally different superconductive phases. Whether the vortices (vortex) have (has) to cross the Josephson Junction region makes a huge difference. Considering the important role the Josephson junction region plays in the superconductor’ s recovery process, its composition of the two different types of layers cannot be treated as the simple anisotropy in a homogeneous compound as the VG theory does. In contrast with the case in Tl0.4K0.41Fe1.71Se2, the difference between the Josephson junction region and strong superconductive layers could almost be ignored in some HTSCs, e.g., Bi-based cuprates (BSCCO). Except for the tail effect caused by the flux creep, its temperature dependence of resistivity behaviors are almost identical under different field orientations.[21] As predicted by the VG theory, its I– V curves could be neatly scaled.[22]
From another perspective, the reason why the VG model cannot explain our experiment results could be understood mathematically. As the VG theory gives
 |
where ν ≤ 1 in the VG theory, while ν = 1/7, 3/2, 7/9, 1/2 in the collective pinning model, and A is irrelevant to j. Thus, we have ln E ∝ − A/jν in the logarithmic coordinate. The curvature of the model is easy to obtain
 |
Once the value of A is fixed, the curvature would not be able to change its sign for the same isotherm. Consequently, the model is unable to describe the isotherms, which change curvature signs between T− and T+ in our experiment.
4. Conclusion
In conclusion, we report the measurement of current– voltage characteristics for our high-quality Tl0.4K0.41Fe1.71Se2 single crystal. We choose varying TM values and adjust scaling exponents accordingly in the hope of obtaining a universal scaling. However, we cannot find a proper isotherm for TM as the VG model predicts, also the ln E– ln j curves cannot be scaled neatly into two branches. Through analysis of the temperature dependence of resistivity under fields with different orientations, we find one major difference between A0.8Fe1.7Se2 and HTSCs. In the A0.8Fe1.7Se2 compound, the strong superconductive FeSe layers and the Josephson junction region (Tl(K) layers) display two distinct types of superconductive phases, as they behave entirely differently from each other in the compound’ s recovery from the superconductive state to the normal state. Thus, it would be improper to treat it as a simple homogeneous anisotropic superconductor as the VG theory does; while HTSCs fit well into this approximation, which enables them to be nicely described by the VG model. Thus, we propose that the series of A0.8Fe1.7Se2 superconductors might provide a new convenient platform to study the complex vortex behaviors in the layered superconductors and perfect the existing models, or even build up new ones.
Reference
| 1 |
|
| 2 |
|
| 3 |
|
| 4 |
|
| 5 |
|
| 6 |
|
| 7 |
|
| 8 |
|
| 9 |
|
| 10 |
|
| 11 |
|
| 12 |
|
| 13 |
|
| 14 |
|
| 15 |
|
| 16 |
|
| 17 |
|
| 18 |
|
| 19 |
|
| 20 |
|
| 21 |
|
| 22 |
|