


Critical deflagration waves leading to detonation onset under different boundary conditions*
Cite this Article
Lin Wei, Zhou Jin, Fan Xiao-Hua, Lin Zhi-Yong. Critical deflagration waves leading to detonation onset under different boundary conditions* . Chinese Physics B, 2014, 24(1): 014701 
Permissions
Critical deflagration waves leading to detonation onset under different boundary conditions*
Corresponding author. E-mail: linweiqy@163.com
Corresponding author. E-mail: zj706@vip.sina.com
Project supported by the National Natural Science Foundation of China (Grant No. 51206182).
Abstract
High-speed turbulent critical deflagration waves before detonation onset in H2–air mixture propagated into a square cross section channel, which was assembled of optional rigid rough, rigid smooth, or flexible walls. The corresponding propagation characteristic and the influence of the wall boundaries on the propagation were investigated via high-speed shadowgraph and a high-frequency pressure sampling system. As a comprehensive supplement to the different walls effect investigation, the effect of porous absorbing walls on the detonation propagation was also investigated via smoke foils and the high-frequency pressure sampling system. Results are as follows. In the critical deflagration stage, the leading shock and the closely following turbulent flame front travel at a speed of nearly half the CJ detonation velocity. In the preheated zone, a zonary flame arises from the overlapping part of the boundary layer and the pressure waves, and then merges into the mainstream flame. Among these wall boundary conditions, the rigid rough wall plays a most positive role in the formation of the zonary flame and thus accelerates the transition of the deflagration to detonation (DDT), which is due to the boost of the boundary layer growth and the pressure wave reflection. Even though the flexible wall is not conducive to the pressure wave reflection, it brings out a faster boundary layer growth, which plays a more significant role in the zonary flame formation. Additionally, the porous absorbing wall absorbs the transverse wave and yields detonation decay and velocity deficit. After the absorbing wall, below some low initial pressure conditions, no re-initiation occurs and the deflagration propagates in critical deflagration for a relatively long distance.
Keyword:
47.40.Rs; 47.40.Ki; 47.40.–x; critical deflagration waves; wall boundary condition; zonary flame; pressure waves
1. Introduction
Over the last few decades, even well-designed laboratory-scale experimental and numerical studies were concentrated on the most common approach for detonation onset, deflagration to detonation transition (DDT), [1– 11] testing a wide range of initial and boundary conditions (with spiral or other obstacles, etc.[1– 11]). In those studies, the non-steady, turbulent, and chemically reactive DDT process was found to be an important yet unresolved problem, which has attracted considerable research interest. The pioneering work with excellent schlieren high-speed pictures on the DDT, which boosted the DDT study, was carried out by Urtiew and Oppenheim.[12] According to Lee’ s research, [13, 14] the DDT process for a whole detonation initiation could be divided into two phases: the initial flame acceleration phase and the onset of detonation phase. Since the flame acceleration involves all mechanisms that are sensitive to different initial and boundary conditions, it seems nearly impossible to have a universal theory to describe the whole acceleration process.[14] On the other hand, sufficient evidence from the previous studies indicates that the deflagration velocity has to reach some quasi-steady critical value which is relatively repeatable before the DDT abrupt. Therefore, formulating a theory from the critical deflagration state is more feasible.
In the DDT or common detonation propagation, the unstable turbulent deflagration involves numerous instability mechanisms that subsequently contribute to the acceleration.[1– 14] These mechanisms approximately include the factors that increase the burning rate (or energy release rate). As a result, any instability mechanism (such as thermo-diffusion instabilities, acoustic instabilities, Richtmyer– Meshkov– Markstain instabilities, and Taylor instabilities[15– 21]) that can increase the flame area or mixing between the fresh unburned mixture and the reactant product is likely to promote the acceleration.[11]
To date, few researchers have addressed the critical deflagration characteristics just before the DDT initiation. One common approach is to study the deflagration acceleration process[1– 9] in tubes or PDEs[10, 11] with obstacles or spirals, which accelerate the flame propagation. Nonetheless, it is a totally rough way since it involves many parameters for the deflagration acceleration. An alternative is to focus on the combustion and the shock stage downstream of a perforated plate, [14, 22, 23] which is relatively quasi one dimensional. The critical deflagration usually sustains itself for some time before run-up, thus the final critical deflagration behavior is readily observed. This is of great importance for understanding the transition to the DDT.
In this paper, the adjusted critical deflagration waves propagated under optional rigid rough, rigid smooth, or flexible wall boundary conditions, afterwards their shocks and turbulent flame interaction behaviors and the influence caused by the wall boundaries were investigated using shadowgraph and a PCB high-frequency pressure capturing system. Additionally, the effect of the absorbing wall boundary was tested on varying detonation propagations. Thereby the physical phenomenology and the mechanisms of the critical deflagration waves that lead to detonation onset under different boundary conditions can be clarified in a much clearer manner.
2. Apparatus and method
The test device (as shown in Fig. 1) consisted of a circular detonation channel and a square detonation combustion chamber. The circular detonation channel (1850 mm long × 32 mm inner diameter) had a schelkin spiral assembled inside to accelerate the DDT process. In analogy, the square chamber was 1000 mm long and had a 40 mm × 40 mm nominal square cross-section, with a diaphragm for sealing at the exit. The roughness inside was controlled by design and machining so that it was rigid smooth in principle. In addition, two glass windows (128 mm long × 40 mm high) were assembled on both flanks of the chamber for shadowgraph. In order to have an adequate comparison of pre-detonation or critical deflagration propagation, three kinds of replaceable wall boundary conditions, rigid rough, rigid smooth, flexible walls, and their combinations were equipped in the internal surfaces of both the upper and the lower walls, perpendicular to the windows and with the same length as the window section. Moreover, a high-speed shadowgraph system and a PCB high-frequency pressure sampling system were employed to observe the detailed characteristics of this so-called quasi detonation phase-critical deflagration. From the arrival time intervals of two neighboring PCB transducers, the average velocity could be derived, which is the velocity of the critical deflagration.
 | Fig. 1. The sketch of experimental apparatus. |
As a supplement understanding of the detonation/deflagration transition, the porous absorbing wall effect on the detonation propagation was studied. Since only the detonation wave has a cellular structure, for the porous absorbing wall investigation, a rectangle smoke foil strip was attached on the bottom wall to record the cellular structure variation.
The experimental process was carried out as follows: firstly we vacuumed the apparatus; and then, we filled the apparatus with H2– Air mixture of required equivalence ratio via two synchronous high-accurate mass flow controllers; after 5 min standing, we ignited the circular channel by a high-energy spark plug, and afterwards the square cross section chamber was able to be ignited via a violently combustible hot jet or detonation jet, depending on the working condition. Once firing, the high-speed shadowgraph system was simultaneously triggered to record the whole process across the observation windows, and the pressure sampling system captured the pressure. Simultaneously, the smoke foil inside could also record the cellular variation.
3. Results and discussion
3.1. Critical deflagration propagating through rigid rough wall versus smooth wall
For an intuitional comparison, two different walls were used respectively as the upper and the lower walls. Experiments were first conducted in the square cross-section chamber. A special rough stainless steel block and a smooth quartz glass block were used as the upper and the lower walls, perpendicular to the observation window I, forming a rigid rough wall and a rigid smooth wall.
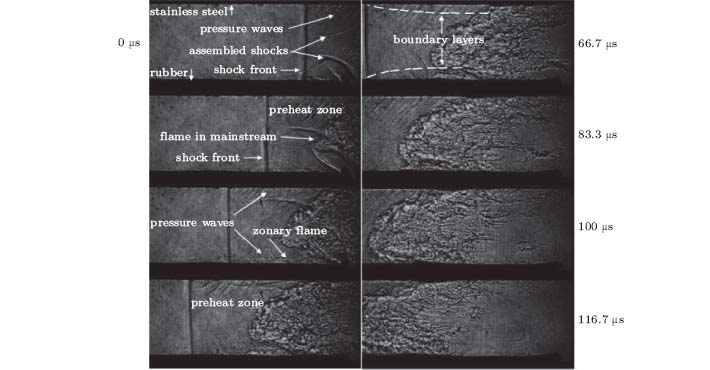
A sequence of high-speed shadowgraph images of the critical deflagration propagation stage are shown in Fig. 2. This is observed from window I at an initial pressure of 43 kPa for stoichimetric H2 and air mixture. A leading shock front compresses the unburned mixture ahead and a fast turbulent flame closely follows, engendering a preheated zone — a compressed and heated pocket of unreacted mixture adjacent ahead to the flame. At 0 μ s (not the real time, but a referenced time), in the vicinity of the upper and the lower walls between the leading shock wave and the turbulent flame, a series of pressure waves emerges from the rigid walls symmetrically, this results from the compression and heat effect by the shock front and the turbulent flame. Later at 16.7 μ s, a strip of zonary flame seemingly occurs in the boundary layer of the upper stainless steel wall, and is completely separate with the mainstream turbulent flame. However, the zonary flame just begins to grow at 50 μ s near the lower wall of smooth quartz glass. At this point, the upper combustion has merged into the mainstream flame, while near the lower wall, the zonary flame just emerges at about 110 μ s. For the image at 33.3 μ s, the turbulent flame in the mainstream propagates closely, 55 mm away from the leading shock front. Thus, it seems that the rougher wall boundary condition is helpful to the DDT.
 | Fig. 2. Shadowgraph images with an initial pressure of 43 kPa, stoichimetric H2 and air, rigid rough wall versus smooth wall. |
The image at 66.7 μ s qualitatively presents the sketch of approximate boundary layers at this moment, which have certain thickness near the no slip walls. Just behind the leading shock wave, boundary layers occur and provide lower speed and higher temperature zones. Besides the boundary layers, the pressure waves also play a positive role due to compression and heating. All these factors are conducive to the spontaneous combustion, and thus the zonary flame arises from the wall surface and diffuses into the preheat zone and the mainstream flame. Specifically, the stainless steel and the quartz glass both have relatively large rigidity, while the former has larger roughness than the latter, therefore forms a thicker and rougher boundary layer. In Fig. 2, the pressure waves adjacent to the two rigid walls are approximately the same, so the zonary flame occurs from the upper rigid rough wall. Once the zonary flame merges into the mainstream and is close enough to the leading shock front, the positive feedback between the pressure waves and the reaction grows rapidly and will finally steepen into a strong shock coupled with the reaction zone, forming the overdriven detonation wave.
In the case above, the local average velocities could be calculated from the shadowgraph images, because we have known the shooting speed of the high-speed camera and the scale of the window. The leading shock front and the subsequent turbulent flame propagate at relatively high speeds, the average velocity of the shock front propagating through window I is around 1180 m/s, which is about 60% of the theoretical CJ detonation velocity (VCJ = 1959.1 m/s) at that given initial pressure.
Table 1 lists the estimated average propagation velocities of the mainstream turbulent flame front in the deflagration process shown in Fig. 2. During 16.7– 33.3 μ s, the turbulent flame propagates at a relatively high speed, and then it decreases a bit, which is caused by the assembled shock; during 66.7– 83.3 μ s, the flame speed rises again because the zonary flame permeates into the mainstream flame. After 83.3 μ s, the flame front speed stabilizes at approximate 840 m/s. Overall, the average velocity of the mainstream turbulent flame front during the whole process is about 926.8 m/s, approximately 47% of VCJ. Therefore, the average velocities of the shock front and the mainstream flame are around 60% VCJ and 47 % VCJ, which confirms that the deflagration is a critical one.
| Table 1. The propagation velocity of the flame front in mainstream during the critical deflagration, with an initial pressure of 43 kPa, stoichimetric H2 and air, rigid rough wall versus smooth wall. |
Similar tests were repeated around 43 kPa to search the critical deflagration condition and the corresponding characteristic. Even though the initial pressure only differed by 0.1 kPa, two distinguishing phenomena were observed (Fig. 3). Figure 3(a) shows a state not reaching the critical deflagration and figure 3(b) shows an already formed detonation, catching up with the leading shock front.
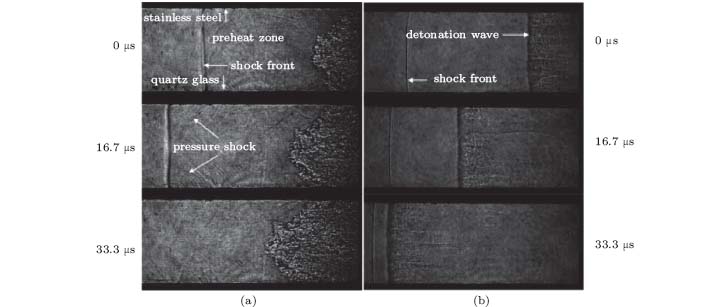 | Fig. 3. Shadowgraph images with initial pressures of (a) 42.9 kPa and (b) 43.1 kPa, stoichimetric H2 and air, rigid rough wall versus smooth wall. |
In Fig. 3(a), the turbulent flame in the mainstream is away from the leading shock front, a bit farther than that in Fig. 2. The approximately symmetric pressure waves also arise in the preheated zone adjacent to the upper and the lower walls, but much closer to the shock front. Nevertheless, no spontaneously burning zonary flame rises from the preheated boundary layer or pressure waves, because the leading shock wave and the subsequent series of pressure waves are not strong enough to trigger the combustible flow in the preheated zone. In Fig. 3(b), the leading shock front is followed by an overdriven reaction front, propagating at a velocity about 2112 m/s, so the reaction zone is able to catch up with the leading shock rapidly and couple into a new self-sustained detonation wave. In this case, before entering the observation window I, the overdriven detonation has already formed. Meanwhile, the shock front is weak to engender pressure waves.
3.2. Critical deflagration propagating through rigid wall versus flexible wall
In Fig. 2, those two walls are rigid enough for wave reflection, so the pressure waves appear to touch the walls after originating in the boundary layers. The earlier emergence of the zonary flame on the upper wall indicates that the wall roughness would influence the formation of the zonary flame. For a further study on the effect of the wall rigidity on the formation and the development of the zonary flame, a medium rough rubber sheet, possessing a relatively more flexible wall boundary than the rigid stainless steel, was pasted on a long lower wall cavity perpendicular to the window section I. Since the rigid upper wall and the flexible lower wall both have certain roughness, then the rigid and the flexible walls were concurrently obtained.
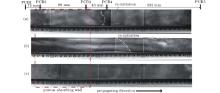
For the same initial pressure of 43 kPa, the corresponding shadowgraph images are presented in Fig. 4. Obviously, a series of pressure waves on both the upper and the lower walls emerges from 0 to 16.7 μ s. However, if compared with those on the lower wall, the pressure waves are stronger on the upper rigid wall. Sparse and short pressure waves occur on the flexible rubber wall. This shows that the pressure wave strength is related to the wall rigidity. The rigid wall is beneficial to the wave compression and reflection, which is the reason why the pressure waves on the upper wall are seemingly darker and longer than those on the lower wall. At 33.3 μ s, the zonary flame is observed only near the lower wall, which means that, under the same conditions, the flexible rubber wall possesses larger roughness which can lead to a thicker boundary layer. A sketch of the boundary layer is drawn at 66.7 μ s. Even though the pressure waves on the lower wall are weaker, the thicker boundary layers there play a more crucial role in zonary flame auto-ignition. While operating, the flexible wall of the rubber sheet should be attached on the lower wall cavity tightly and flatly, avoiding a serious deficit by elasticity.
 | Fig. 4. Shadowgraph images with an initial pressure of 43 kPa, stoichimetric H2 and air, rigid wall versus flexible wall. |
In the window section I, the leading shock front propagates at a relatively stable velocity of about 1123 m/s, nearly 57% of VCJ. The average velocities of the mainstream flame front between different time intervals are listed in Table 2.
| Table 2. The propagation velocity of the mainstream flame front during the critical deflagration, with an initial pressure of 43 kPa, stoichimetric H2 and air, rigid wall versus flexible wall. |
When the leading shock enters window I, two assembled shocks form on both the upper and the lower walls after the shock front. With their expansion, they interfere with the mainstream flame front, thus the surface of the flame is distorted by the sweep of the assembled shocks at 16.7 μ s, and the average velocity of the interval 0– 16.7 μ s is larger than that of other intervals. The average flame velocity in the observed process achieves 958 m/s, which is about 49 % of the theoretical CJ detonation velocity. Though the velocities in the mainstream seem a little slower than that of the shock front, if the zonary flame is included, the flame is getting closer to the shock front during the critical deflagration, and then abruptly runs up to a detonation wave.
3.3. Detonation waves propagating through porous absorbing walls
The case in subsection 3.2 indicates that the wall rigidity can influence the formation of the pressure wave and the strength of the pressure wave reflection. Similar to the pressure waves, the transverse wave is a kind of compressed wave, and a detonation wave needs the transverse wave reflection effect of the wall boundary to self-sustain. Motivated by this, an adverse case is studied. Apart from the rigid or flexible wall mentioned above, the porous absorbing wall was tested for deflagration and detonation propagation. The absorbing means that once a wave touches the porous wall, the wave will go into the porous structure. Other than focusing on the critical deflagration stage before run-up, three fully developed detonation waves of different initial pressures propagating through the porous absorbing walls, and the smoke foils, and the pressure transducers were used to record the propagation characteristics.
The physical sketch shown in Fig. 5 lists the parameters of the porous absorbing material, which is selected to make the absorbing wall. It is a steel wire mesh (diameter of steel wire is 0.23 mm) with 50 meshes per square cm. The absorbing wall was made of 15 layers of this mesh and placed into the inner side cavity of both the upper and the lower walls, perpendicular to the window I. This flat porous absorbing wall had a volume of 5 mm × 120 mm × 40 mm (width × height × length).
 | Fig. 5. Porous absorbing wall: (a) picture, (b) sketch of the structure. |
In the experiment, we varied the equivalence ratio and the initial pressure of the experimental H2– air combustible mixture, and made sure to obtain a self-sustained detonation wave in the square chamber through a detonation jet provided by the circular tube. Afterwards, as the detonation wave propagates through the porous absorbing section, for different initial mixture conditions, the recorded cellular structure in smoke foils would exhibit three kinds of typical characteristics. That is corresponding to the following three smoke foils cases shown in Fig. 6, i.e., short-haul attenuation and re-initiation, significant attenuation and re-initiation, complete fail.
 | Fig. 6. Smoke foil records of detonation wave propagating through porous walls with different initial conditions: (a) stoichimetric H2 and air, 101 kPa; (b) 3H2 + O2 + 3.76 N2, 50 kPa; (c) stoichimetric H2 and air, 50 kPa. |
Figure 6(a) denotes the case of short-haul attenuation and re-initiation. As the detonation wave propagates through the porous absorbing walls (zone between dashed dotted lines), the self-sustained detonation wave decays since the transverse waves go into the absorbing walls and hardly reflect. Thus, the cellular size in the smoke foil undergoes such a process: regularly propagates in one or two cells, and gets larger and sparser. After passing the absorbing walls, re-initiation occurs in the form of overdriven detonation, so the cell size becomes very tiny and then recovers to the normal cell size. In Fig. 6(a), starting from the position near the ruler scale of 23.5 cm, the triple-point trajectories become thicker, which indicates that the induction zone between the leading shock front and the reaction zone becomes thicker and the shock and the reaction zones are getting decoupled. When the combustion propagates into the rigid steel wall again at the scale of 31 cm, decoupling quasi-detonation soon runs up into re-initiated detonation, the wave reflection and the transverse wave play a part in the re-initiation.
Compared with Fig. 6(a), the process of detonation decay and re-initiation in Fig. 6(b) is similar but more obvious. Originally, after entering the porous absorbing section, the cellular structure gradually becomes larger and completely disappears at the position around the scale of 21 cm. The triple-point trajectories remain the shape of “ < ” in the middle of the mainstream field near the scale of 24.5 cm. This quasi detonation state continues for a certain distance, even though the combustion passes the absorbing section. A strip of thick triple-point trajectory is observed starting from the scale of 29 cm. Soon afterwards, a hot spot forms from the wall and an over-driven cellular structure of detonation wave occurs downstream at the scale of 34 cm, gradually evolving to a steadily self-sustained state. Comparing case (b) with case (a) and ignoring the stoichiometric ratio, we find that the initial pressure in case (b) is nearly half of that in case (a), thus the former needs a longer distance for re-initiation.
In Fig. 6(c), once the detonation wave arrives at the absorbing section, its cellular structure disappears rapidly in a short distance, since the transverse waves are absorbed by the porous wall, and the detonation wave propagating along the absorbing section completely fails, without trend of re-initiation. The initial pressure in case (c) is just half of that in case (a), therefore the detonation wave is easily attenuated by the porous absorbing walls. Because the initial pressure of the mixture in case (c) is not that high and the channel is not that large, when the transverse wave is absorbed by the porous absorbing walls, the generation of new cells in the center is not enough to compensate for the attenuation on the transverse wave near the wall, which leads to the fact that the central cells are affected by the absorbing boundary and the detonation entirely fails.
Besides the smoke foil records, the pressure histories of the above three typical cases were measured by PCB pressure transducers, and they are shown in Fig. 7. Based on the time intervals of the pressure transducers along the testing channel, the average velocities of the detonation wave between two neighboring pressure transducers are calculated and presented in Table 3. The peak values of P2 (measured by PCB2, 14 mm away from the absorbing wall inlet) and P1 (before entering the wall section) are the pressures of regular detonation, and the average velocities of them in the three cases are all close to the CJ detonation velocities, i.e., 1913.6 m/s, 1914.3 m/s, and 1876.6 m/s, respectively. Thus, the detonation wave will propagate for one or two cells before decay. In Fig. 7, for case (a), the peak of P3 is a little lower than that of P1 and P2, which means that the detonation wave undergoes decay to a certain extent. P4 is much higher than P3, because re-initiation occurs right before PCB4 and lasts even to PCB5. Nevertheless, according to the average velocities in Table 3, the average velocity between P2 and P3 across the absorbing section does not decay much, since the detonation wave still sustains for some distance before severely decaying. For case (b), the pressure peaks of P3 and P4 decrease to a value significantly lower than those of P1 and P2, and then the pressure at P5 raises again to be larger than that at P1 and P2 of regular detonation. Re-initiation occurs between P4 and P5. Table 3 shows, from the absorbing section, the average velocities in case (b) continue decaying, from 1669.6 m/s to 1325.5 m/s. After PCB4, the detonation wave re-initiates. As for case (c), the fact that P3, P4, and P5 are less than P1 and P2 indicates that the detonation entirely fails, and the average velocities in Table 3 are always dropping. The deflagration drops from 1325.5 m/s to an average velocity of 1108.6 m/s (56.5% VCJ), however the latter between P4 and P5 sustains for 392 mm. It means that after the detonation is ended, the deflagration in the smooth tube could propagate in relatively critical deflagration for a relatively long distance.
 | Fig. 7. Pressure histories of the detonation propagating through porous absorbing walls with different initial conditions: (a) stoichimetric H2 and air, 101 kPa; (b) 3H2 + O2 + 3.76 N2, 50 kPa; (c) stoichimetric H2 and air, 50 kPa. |
| Table 3. The average velocity (in units of m/s) of the detonation wave between two neighboring PCB pressure transducers with different initial conditions. |
As shown in Figs. 6, 7 and Table 3, generally, the pressure data, the average velocities, and the recorded evolutions of the cellular structure agree well. When passing through the porous absorbing section, the detonation waves in all these cases have to suffer attenuation on intensity and velocity to certain extents. For a specific porous absorbing wall, the detonation could propagate through with nearly no decay at a relative high pressure. As the initial pressure decreases, the decay becomes very remarkable and the re-initiation distance gets longer. When the initial pressure is lower than a critical one, the detonation wave decays, the velocity deficit occurs, and no re-initiation arises. The attenuation on the detonation waves by the absorbing wall is mainly due to the attenuating effect of the absorbing wall on the transverse waves.
4. Conclusion
This paper experimentally studied the high-speed turbulent critical deflagration wave state before detonation onset and the influence of the wall boundaries on propagation. The optional rigid rough, rigid smooth, flexible, and porous absorbing walls were used in a square cross section channel for test. By summarizing the analysis mentioned above, conclusions can be drawn as follows.
(i) With regard to the apparatus in this paper, at the initial pressure of 43 kPa (stoichimetric H2 and air mixture), the critical deflagration process was observed: the leading shock and the closely following turbulent flame front travel at a speed of nearly half the CJ detonation velocity. Meanwhile, a series of pressure waves arises in the preheated zone overlapped with the wall boundary. The compression and heating effect could cause a zonary flame, which then merges into the mainstream turbulent flame.
(ii) Among the optional rigid rough, rigid smooth, and flexible walls, the roughness and the rigidity play an important role in the growth of the critical deflagration. The rigid rough wall could boost the boundary layer growth and the pressure wave reflection most, which contributes to the formation of the zonary flame and the DDT.
(iii) Comparing the detonation wave propagating through the rough rigid steel wall versus the flexible rubber wall, even the flexible wall lacks a mechanism for the pressure wave reflection and leads to less and weaker pressure waves merging in the preheated zone, the flexible wall also brings out a faster boundary layer growth than the rigid rough wall, which plays a significant role in the zonary flame formation.
(iv) As the detonation wave propagates through porous absorbing walls, the porous absorbing walls absorb the transverse waves and cause the detonation intensity to decay and yield velocity deficit. For a specific porous absorbing wall, at a relatively high pressure, the detonation is able to propagate through it with nearly no decay. As the initial pressure decreases, the decay becomes very remarkable. There exists a limit pressure below which the detonation wave decays, the velocity deficit arises, and no more re-initiation occurs. Whereafter the deflagration could propagate in the smooth tube for a relatively long distance.
Reference
| 1 |
|
| 2 |
|
| 3 |
|
| 4 |
|
| 5 |
|
| 6 |
|
| 7 |
|
| 8 |
|
| 9 |
|
| 10 |
|
| 11 |
|
| 12 |
|
| 13 |
|
| 14 |
|
| 15 |
|
| 16 |
|
| 17 |
|
| 18 |
|
| 19 |
|
| 20 |
|
| 21 |
|
| 22 |
|
| 23 |
|