Corresponding author. E-mail: yansz@mail.tsinghua.edu.cn
Project supported by the National Natural Science Foundation of China (Grant No. 11272171), the Beijing Natural Science Foundation, China (Grant No. 3132030), and the Education Ministry Doctoral Fund of China (Grant No. 20120002110070).
An experimental method of measuring the real contact area of transparent blocks based on the principle of total internal reflection is presented, intending to support the investigation of friction characteristics, heat conduction, and energy dissipation at the contact interface. A laser sheet illuminates the contact interface, and the transmitted laser sheet is projected onto a screen. Then the contact information is acquired from the screen by a camera. An improved Otsu method is proposed to process the data of experimental images. It can compute the threshold of the overall image and filter out all the pixels one by one. Through analyzing the experimental results, we describe the relationship between the real contact area and the positive pressure during a continuous loading process, at different loading rates, with the polymethyl methacrylate (PMMA) material. A hysteresis phenomenon in the relationship between the real contact area and the positive pressure is found and explained.
The surface of an object that appears smooth is actually made up of numbers of micro-asperities.[1] When two surfaces are in contact, the interconnecting micro-asperities form the real contact region that determines the physical properties of the contact interface, such as friction characteristics, heat conduction, and dissipation of energy. Therefore, the approach of measuring the real contact area is very important for understanding the contact mechanism of two solid surfaces and furthering tribology theories.
As the research on rough surface contacts plays an important role in areas of tribology, heat transfer, and contact mechanics, many theoretical studies have been undertaken in this field. Hertz proposed the Hertz contact theory, providing a solution to the problem of elastic contact without friction or adhesion.[2] Greenwood and Williamson developed a model for the rough surface contact. The advent of this G– W model had a significant impact on the area of rough contact modeling. The G– W model assumes the micro-asperities as identical spherical asperities with a Gaussian distribution of heights, and employs the Hertz contact theory to solve each asperity in contact independently.[3] An important assumption in the G– W model is that the contact of micro-asperities is independent, which is only tenable in lightly loaded and small deformation conditions. Whitehouse and Archard made an attempt to bridge this gap. They proposed the W– A contact model based on the G– W model, and the W– A model took into account that the curvature radius of a micro-asperity is associated with the height of that micro-asperity.[4] Chang's group extended this research, and presented the CEB contact model, treating micro-asperities as an elasto– plastic material. The volume conservation is taken into consideration in the CEB model during plastic deformation. The numerical results of this model are different from those of the purely elastic or purely plastic model.[5] Zhao proposed a contact model describing the transition from elastic to elastic-plastic to fully plastic deformation. Mathematical manipulation was used to smooth the transition process of the three types of deformation.[6]
All the models above predict a linear relationship between the real contact area and the contact pressure. Some researchers used finite element analysis to simulate the contact of rough surfaces in different deformation states.[7, 8] The simulation results also show a linear relationship between the real contact area and the positive pressure.
The experimental research on the real contact area is far from systematic and sufficient, compared with the adequate theoretic studies. In the early 1980s, Kragelsky published a review of the achievements in the experimental study of contact.[9] In the experimental research area, several different methods using electrical, optical, or ultrasonic techniques have been used to measure the real contact area. Among these methods, the optical one that uses the total internal reflection principle to measure the real contact area has many advantages, such as reliable and accurate measurement, and visible results.[9– 13]
The present paper presents an optical experimental method for measuring the real contact area of a transparent material to better understand the rough surface contact mechanism and enrich the knowledge of the dynamic behavior of the contact phenomenon. The total internal reflection method and an improved Otsu method[14] are applied. The experimental method can be used to explore the properties of the real contact area in different situations. This paper is structured as follows. Section 2 presents the experimental principles, the actual experimental set-up, and the post-processing method. Section 3 provides three cases of the experimental method with polymethyl methacrylate (PMMA) material, presents the experiment results, and proves the feasibility of the method. Section 4 concludes the paper.
The technology roadmap in Fig. 1 outlines the experimental method. The interface of two transparent blocks is illuminated with a laser sheet under a positive load in different conditions, such as the continuous loading and unloading process, contact surfaces of different roughness, and transparent blocks of different materials. The transmitted laser sheet projects the contacting surfaces onto a screen, presenting the contact information of the interface. Then we acquire the contact information from the screen by taking photos. All the images are processed by the improved Otsu method to digitize the contact information. Combining the digitized contact information with the experimental conditions, we obtain the experimental results.
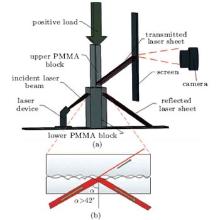
The technique for measuring the real contact area of transparent materials utilizes the total internal reflection principle, and the interface contact conditions can be observed between two contacting transparent blocks by collecting the images formed by the transmitted laser sheet. Figure 2(a) is a schematic diagram of the experimental set-up, which presents the working conditions of the experiment. Transparent PMMA is used as an example in this paper. The basic mechanical properties of PMMA are given in Table 1.
| Table 1. Mechanical properties of the PMMA material. |
There are many interconnecting micro-asperities between the upper PMMA block (10 mm× 50 mm× 100 mm) and the lower one (20 mm× 50 mm× 150 mm). The other areas between the surfaces are of course filled with air. In this case, a red laser sheet illuminates the contact interface in the direction shown in Fig. 2(b). According to the law of refraction,
 |
where α is the total internal reflection angle, n is the refractive index of the optically thin medium to vacuum, and n1 is the refractive index of the optically denser medium to vacuum. The refractive index of the PMMA material to the air is 1.49. The total internal reflection angle of the PMMA material to air can be calculated to be 42° . The incidence angle at the surface of the lower PMMA block must be larger than the total internal reflection angle of PMMA to air (α > 42° ). If there is no upper block, all of the incident laser sheet should reflect at the surface of the lower block according to the principle of total internal reflection. When two PMMA blocks are in contact, the total internal reflection will not happen at the interconnecting micro-asperities. Figure 2(b) presents the contact situation at the interface. The incident laser sheet has been divided into two parts. One part is transmitted through the interface at the interconnecting micro-asperities, and the other part is reflected at the surface because of the total internal reflection. The transmitted part is displayed on the screen, as shown in Fig. 2(a).
In the actual set-up, the red laser sheet is produced by a 200 mW red line laser module. The positive load is provided by an electronic universal testing machine (EUTM), which provides a positive pressure ranging from 0 N to 20 kN at a constant loading rate in the vertical direction, and the loading/unloading rate is set in the interval [0.001, 500] mm/min. All experiments are conducted in a dark environment to eliminate the interference of stray light. Before loading, we adjust the laser path as in Fig. 2 and ensure that the illuminated zone is in the middle of the interface. The width of the illuminated area can be adjusted according to the needs of the study. In the process of loading, a digital single lens reflex (DSLR) camera is used to record the image formed by the transmitted light on the screen. All the photos are captured from the screen continuously. In the process of taking pictures, we keep the DSLR in the manual mode; the aperture, shutter speed, and focal length must remain the same.
Typical images taken by the DSLR are shown in Fig. 3. The images exhibit the contact texture of the blocks. It can be observed that the images are filled with light and dark spots, in which the light part is formed by the transmitted laser sheet and the dark areas are attributed to the reflection of the laser beam at the surface of the lower PMMA block. As shown in Fig. 3, the dark area is obviously reduced with the increase of the positive pressure in the loading process and gets larger during the unloading process. The dark area in the loading process is larger than that in the unloading process under the same pressure. All the images are subsequently processed with the improved Otsu method.
The image can be regarded as one m × n pixel matrix A, each element of which corresponds to a certain gray value (0– 255),
 |
To deal with A, a basic method is to choose a fixed threshold value a, and compare the gray value of each pixel to a. As the image consists of bright target points and a dark background, the Otsu method as an efficient image segmentation algorithm[14] has been used to obtain the best threshold value of such an image. After comparing the element of A with a certain threshold a, we can obtain a binary matrix C,
 |
 |
The elements 0 and 1 of C represent the dark and the bright pixels, respectively. Thus the image data is classified into targets and backgrounds based on the Otsu method. The original image and the image processed by the Otsu method are shown in Fig. 4.
 | Fig. 4. Comparison between the original image and the processed image: (a) original image, (b) image processed by the Otsu method. |
As shown in Fig. 4, the Otsu method can carry out the binarization of the image data, but the details of the image cannot be recognized and divided by only using the Otsu method. Since the screen of the experiment is not a specular surface, the light that enters the lens includes the diffuse reflection part from the screen. So impurities and noise exist in the images recorded by the camera. To remove the noise, an improved Otsu method has been used to process the image for recognizing the details of the image data. The improved Otsu method computes the threshold of the overall image and filters out all the pixels one by one. The first step is to find the best threshold value of the overall image a by the Otsu method. Next, expand A to an (m + 2) × (n + 2) matrix AE by the mirroring method as
 |
In order to express the algorithm conveniently, define an (m + 2) × (n + 2) matrix E to represent AE,
 |
Deal with the 3 × 3 submatrix of E to filter the pixel element of the image
 |
Add all the elements of Eij together and obtain the average value ẽ ij,
 |
Then compare the pixel element eij to the average value ẽ ij and the threshold value a to obtain the elements bij of the binary matrix B,
 |
where λ is a complexity coefficient to adapt to different environmental situations according to the experimental demands. All the elements of the pixel matrix A have been processed by the procedure mentioned above, and the binary matrix B can be obtained as
 |
The original image and the image processed by this improved Otsu method are shown in Fig. 5 (λ = 0.7). The detail of the image data has been recognized and divided by the improved Otsu method.
The total number of bright pixels can be calculated by
 |
The number of all pixels in the image can be counted by
 |
And NR/NA denotes the ratio of real contact area AR to apparent contact area AA
 |
As a result, the real contact area can be computed by
 |
Since the Otsu threshold is appropriate when the distinction between the target and the background of the image is clear, we can use the image that is recorded under the maximum pressure to obtain the threshold value a and deal with the series of images with a fixed a by the improved Otsu method.
A series of experiments was carried out using the method mentioned above, varying the loading situations. The experiments verified the feasibility of the method and obtained several contact rules of the PMMA material. The results and proper analysis of the experiments are presented in this section.
The measuring method mentioned above was performed on two PMMA blocks with smooth surfaces as shown in Fig. 2. The experiment was carried out three times. The positive pressure used in the experiments ranged from 0 to 3 MPa, and the loading rate was 0.05 mm/min. Figure 6 gives three loading and unloading cycles of the real contact area and the positive pressure. The experimental results show that the growth of the real contact area slows as the positive pressure grows. In the experiment, the maximum value of the positive pressure is 3 MPa, which is far lower than the tensile strength of the PMMA material (50 MPa). Thus, in the elastic range, the real contact area increases with increasing positive pressure, while the growth rate of the real contact area slows with increasing load.
The results in Fig. 6 also show the significant hysteresis phenomena in the curve of Ā R− PF. Under the same positive pressure, the real contact area in the unloading process is larger than that in the loading process. As the sizes of the two experiment blocks are different, the displacement along the contact surface caused by the Poisson expansion is not the same. Thus there is relative displacement and energy consumption between the contact surfaces. In consequence, the Poisson expansion may cause the hysteresis phenomena.
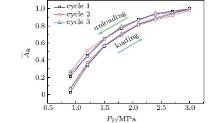 | Fig. 6. Real contact area Ā R (a normalized value of AR/ARmax) versus positive pressure PF (F/AA) for three loading and unloading cycles. |
To prove this interpretation, another set of experiments was prepared in which two new PMMA blocks of the same size, material, and surface properties were used, and the loading velocity was 0.2 mm/min. In this case, the deformation of each of the blocks caused by the Poisson expansion is the same. So the tiny relative movement does not occur between the surfaces of the two PMMA blocks, and the effect of the Poisson expansion is removed. However the hysteresis phenomenon still existed on the curve of Ā R− PF, as shown in Fig. 7. Obviously, the Poisson expansion is not the major factor that causes the hysteresis phenomenon.
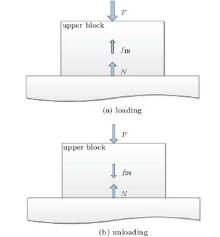
After excluding the Poisson expansion as the major reason for the hysteresis phenomenon, we focused on the material character of the PMMA. PMMA is a polymer material. In polymer materials, hysteresis exists between stress and strain. During the mechanical deformation of a polymer material, relative motion occurs among the polymer chains, which causes a change of the internal force within the polymer body, and we define the resultant force of the internal force as the nominal internal friction fIN that exists in the whole process of loading and unloading, impedes the deformation of the polymer material and dissipates energy.[15]
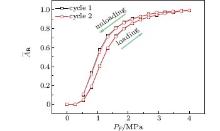 | Fig. 7. Real contact area Ā R versus positive pressure PF for two loading and unloading cycles with surfaces of the same size. |
Because of the nominal internal friction, the positive force measured by the force sensor differs from the supporting force at the contact interface. Force analysis has been made to the interface in the process of loading and unloading. As to the upper PMMA block, it is under the joint action of the positive force (including the gravity), the supporting force from the lower PMMA block, and the nominal internal friction within the upper PMMA block, as shown in Fig. 8.
The direction of the nominal internal friction in the loading phase is opposite to that in the unloading phase. Because the entire loading and unloading process is carried out under nearly uniform linear motion, ignoring the inertial force caused by the tiny movement of the block and regarding the movement of the blocks as an equilibrium state. For the upper block, the equilibrium equation can be obtained through the force analysis
 |
where F(t) is the positive force from the top, fIN (t) is the nominal internal friction, and N(t) is the supporting force from the lower PMMA block. The magnitude given by the force sensor equals the positive pressure F(t), but the value of the real contact area is related to the variation of the supporting force N(t). From Eq. (15), it can be concluded that F(t) is larger than N(t) during the loading phase, so the loading Ā R - PF curve should move left to eliminate the effect of the nominal internal friction if we want to obtain the loading curve of Ā R− PN, where PN is the supporting pressure calculated by N/AA. Similarly, F(t) is smaller than N(t) during the unloading process, so the unloading part of the Ā R− PF cycle should move right.
In order to verify the explanation, an experiment was designed to create the equilibrium state and get rid of the effect of the nominal internal friction. The positive force ranged from 0 N to 10 kN, and 10 samples were taken during the process. We stopped loading at the time of sampling, and recorded the data when the force sensor gave out a stable number. Then we compared the results to that with continuous loading, as shown in Fig. 9.
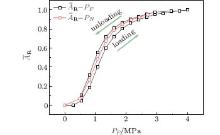 | Fig. 9. The Ā R− PF cycle of continuous loading process and Ā R− PN curve of loading process with static phases. |
After eliminating the effect of the nominal internal friction, the curve of Ā R− PN is just between the cycle of Ā R− PF. Thus the experimental result verifies the explanation of the hysteresis phenomena.
Another set of experiments was carried out with different loading rates to explore the relationship between the real contact area and the loading rate. The loading rate used in the experiment was 0.2 mm/min and 0.3 mm/min. The positive force ranged from 0 to 15 kN. The surfaces of the upper and the lower PMMA blocks were the same size. The experimental results are presented in Fig. 10. As shown in Fig. 10, at the same positive pressure, the cycle with the lower loading rate has a larger contact area. If the other conditions of the experiment are the same, the difference of the contact time affects the size of the real contact area. The lower loading rate provides the surfaces more time to contact fully. Therefore, it is important to take the effects of the contact time into consideration when doing research in the real contact area.
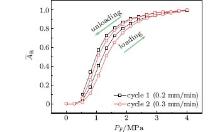 | Fig. 10. Real contact area and positive pressure curves at different loading rates. |
Also, the same series of experiments was carried out with blocks made of optical glass. The results were quite similar to those with the PMMA material.
We developed an experimental method to measure the real contact area of a transparent material for exploring the contact mechanism between two rough surfaces. An improved Otsu method was proposed to process the images, which can take both the whole photo and the local details of the image into account. The method to measure the real contact area is based on the total internal reflection principle and the improved Otsu algorithm.
The experimental method was verified to be feasible through a series of experiments. The real contact area of two PMMA blocks has been measured successfully. Through the experiment, several conclusions can be drawn as follows. The real contact area increases with increasing positive pressure, but at the same time, the growth rate of the area decreases; the contact area at higher loading rates is smaller than that at lower loading rates at the same positive pressure; the curve of the relationship between the real contact area and the positive pressure displays an obvious hysteresis in the process of continuous loading and unloading, and the hysteresis is the result of the nominal internal friction within the PMMA blocks and the extension of contact time. Through the experiment, it is found that the surface of the block is a randomly rough surface, and the experimental study of the real contact area should pay more attention to its properties and phenomena, rather than the exact value.
The experimental method is proposed to explore the properties of the real contact area. It will help us to obtain a better understanding of the rough surface contact mechanism and enrich the knowledge of the dynamic behavior of frictional contact.
| 1 |
|
| 2 |
|
| 3 |
|
| 4 |
|
| 5 |
|
| 6 |
|
| 7 |
|
| 8 |
|
| 9 |
|
| 10 |
|
| 11 |
|
| 12 |
|
| 13 |
|
| 14 |
|
| 15 |
|


