Effect of pump-1 laser on Autler–Townes splitting in photoelectron spectrum of K2 molecule

Effect of pump-1 laser on Autler–Townes splitting in photoelectron spectrum of K2 molecule |
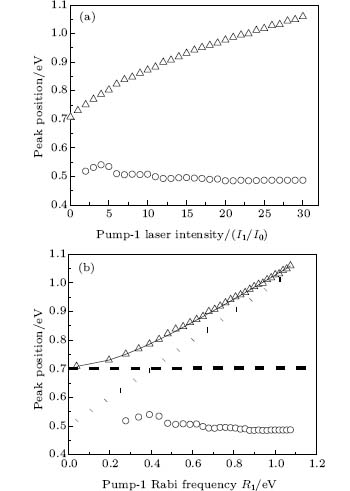
| Fig. 7. Peak positions for the spectra in Fig. 6 versus a pump-1 laser intensity I 1 and b pump-1 Rabi frequency R 1 . Also shown is the result using the dressed-state formalism curve shown by solid line. The dashed straight lines and dotted straight lines indicate the asymptotic behaviors for R 1 #cod#x226A; R 2 and R 1 #cod#x226B; R 2 . All the other parameters are the same as those in Fig. 6 . |
 |