Real-space observation of individual skyrmions in helimagnetic nanostripes
Jin Chi-Minga), b), c) , Du Hai-Feng†a), b) 
Real-space observation of individual skyrmions in helimagnetic nanostripes |
|
Jin Chi-Ming
|
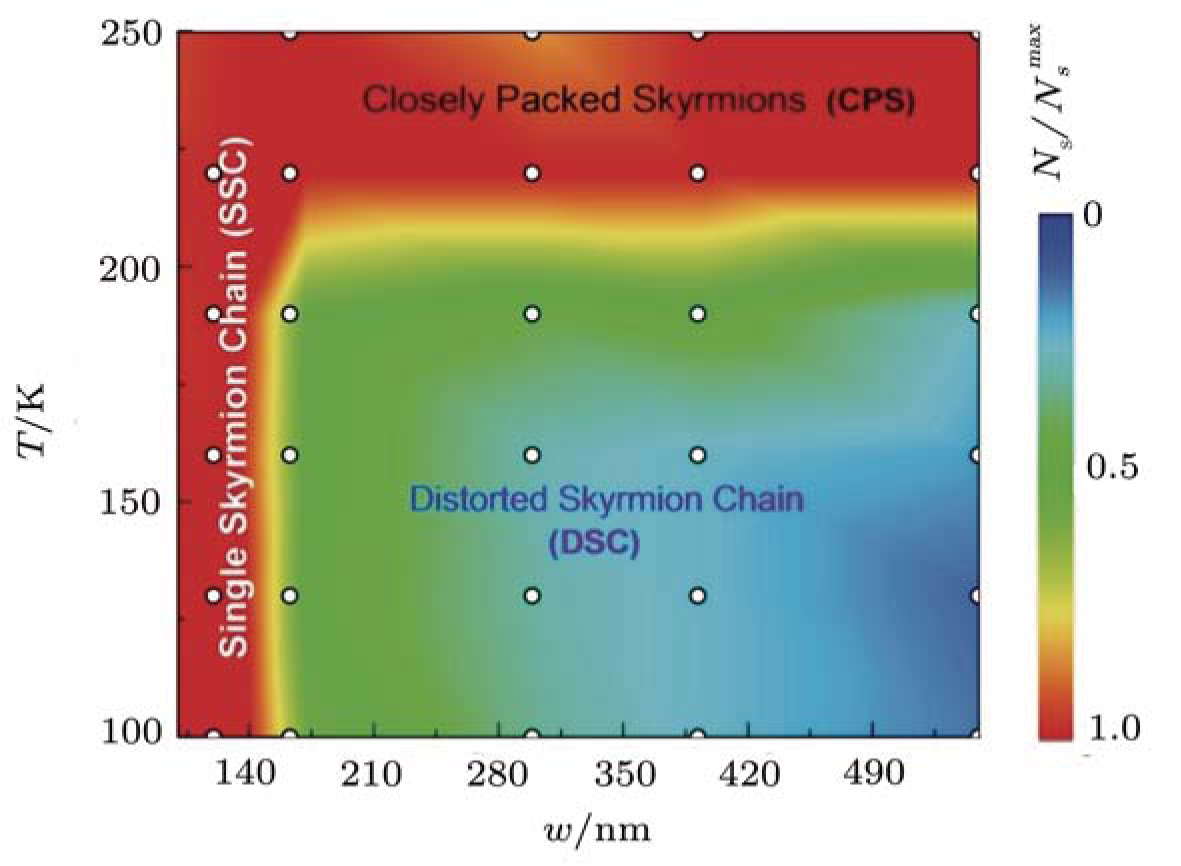
| Sample width dependence of the skyrmion arrangement in the temperature ( T )–width ( w ) diagram. The open dots are data points from the Lorentz TEM measurements. From these data, a colored map is constructed to show the normalized skyrmion density, defined as , with N s the actual number of skyrmions at each temperature and the maximum number of skyrmions that can be accommodated in the nanostripe. Image is taken from Ref. [ 26 ]. |
| |