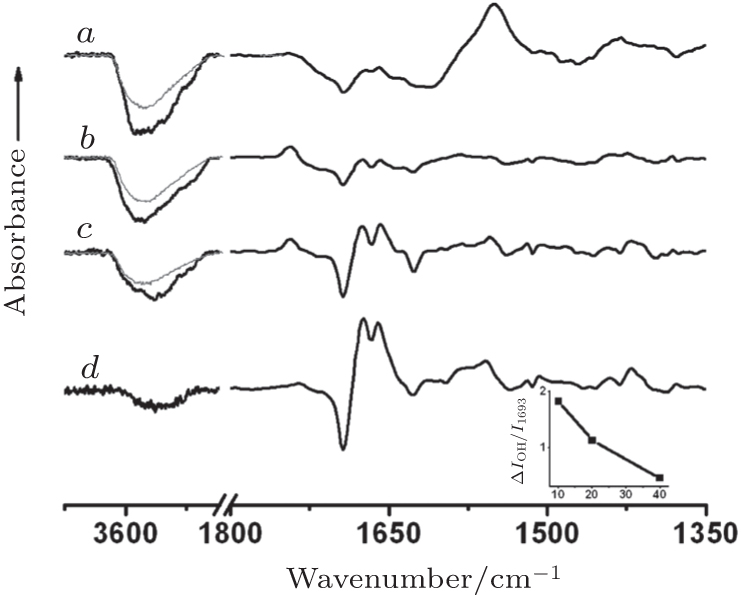
| The potential-induced surface-enhanced infrared adsorption (SEIRA) difference spectra of cyt c -containing (black curve) and blank films (grey curve) CL_PC-DT(10) (curve a ), CL_PC-DT(20) (curve b ), CL_PC-DT(40) (curve c ), and Cyt c -MUA (curve d ) in 10-mM PB (pH 7), with the reference potential −0.1 V and the sample potential 0.35 V (curve a ), 0.4 V (curve b ), 0.5 V (curve c ), and 0.1 V (curve d ). The arrow corresponds to absorbance Δ A of 5 × 10⁻⁴. Inset: the ratio Δ I O−H/ I 1693 versus 1-dodecanethiol (DT) concentration, where Δ I O−H is the difference in the intensity of negative peaks at ∼3500 cm−1 between the complexes Cyt c -CL_PC-DT and CL_PC-DT, and I 1693 is the intensity at 1693 cm−1. CL_PC: cardiolipin-phosphatidylcholine bilayer, MUA: 11-mercaptoundecanoic acid. |