


A computational modeling study on the helium atmospheric pressure plasma needle discharge
[Qian Mu-Yang†a)  , Yang Cong-Ying
b) , Liu San-Qiua) , Wang Zhen-Donga) , Lv Yana) , Wang De-Zhenc) ]
, Yang Cong-Ying|
|


†Corresponding author. E-mail: qianmuyang@ncu.edu.cn
*Project supported partly by the National Natural Science Foundation of China (Grant No. 11465013), the Natural Science Foundation of Jiangxi Province, China (Grant No. 20151BAB212012), and in part by the International Science and Technology Cooperation Program of China (Grant No. 2015DFA61800).
A two-dimensional coupled model of neutral gas flow and plasma dynamics is employed to investigate the streamer dynamics in a helium plasma needle at atmospheric pressure. A parametric study of the streamer propagation as a function of needle tip curvature radius and helium gas flow rate is presented. The key chemical reactions at the He/air mixing layer which drive the streamer propagation are the direct ionization via collision with electrons, the Penning effect being not so crucial. With increasing the gas flow rate from 0.2 standard liter per minute (SLM) to 0.8 SLM, however, the emissions resulting from reactive oxygen and nitrogen species change from a solid circle to a hollow profile and the average streamer propagation velocity decreases. Air impurities (backdiffusion from ambient air) in the helium jet result in a significant increase in the streamer propagation velocity. Besides, with decreasing the tip curvature radiusfrom 200 μm to 100 μm, the electron avalanche process around the near-tip region is more pronounced. However, the spatially resolved plasma parameters distributions (electron, helium metastables, ground state atomic oxygen, etc.) remain almost the same, except that around the near-tip region where their peak values are more than doubled.
Recently, non-thermal atmospheric pressure plasma (APP) has received considerable attention due to their practical applications in the field of plasma medicine, material processing, and pollution control.[1– 5] To address the specific requirements of various applications, a range of different types of non-thermal APP sources have been reported.[6– 9] Plasma needle as a typical non-thermal APP source, plasma discharge usually generates in a gap (mm range) between the powered needle tip (∼ 100 μ m in diameter) and the cathode surface.[8, 9] The sharpened tip is driven by different power sources, including kHz ac, RF, microwave, pulsed dc, and He or Ar is typically used as the source gas to sustain the stable plasma.
With deepening research into the non-thermal APP, researchers pay more and more attention to the detailed generation mechanism and exact features of this peculiar plasma. For instance, several research groups demonstrated that plasma jets are not continuous but discrete bullet-like plasma luminous volumes travelling at speeds of 104 m/s– 106 m/s.[10– 14] Based on experimental and modeling studies, [15– 18] it is commonly accepted that the “ bullets” are ionization waves, which are quite similar to cathode-directed streamers. And, these plasma “ bullets” are hollow taken by using an intensified charge coupled device (ICCD) once it emerges as a propagating streamer in the open air. Over the hollow “ bullet” in the plasma jet of He thereare various opinions but up to now no consensus has been reached. Sakiyama et al.[15] compared the light emission measurements with a one-way coupled model with local field approximation, concluding that the Penning effect must play an important role in the formation of the hollow bullets. However, by turning the Penning reactions on and off in their modes, Naidis, [19, 20] and Naja et al.[21] have shown that the Penning ionization is not essential for the bullets propagation and their hollow shape formation. Furthermore, Chang et al.[22] reported that the annular structure of the plasma plume in ambient, in the case of He, is not due to the Penning effect on the He/air interface. To date, the mechanisms of the acceleration behavior of the plasma bullets have achieved considerable progress. It was concluded that there are two main reasons for the acceleration of the plasma bullets in open air.[23, 24] One is due to the diffusion of N2, which leads to Penning ionization and finally leading to the acceleration of the bullets. Another one is due to the change of the permittivity of the medium surrounding the plasma plume.
As mentioned above, the backdiffusion of N2, in other words, the gas flow rate of source gas exerts significant influence on streamer propagation. Several experimental studies have been carried out to investigate the effect of gas flow rate on APP discharge characteristics, such as jet length, [25, 26] distributions of long-lifetime active species in the discharge tube, [13] and gas temperature.[27, 28] Besides, it is important to note that the streamer is driven by the high electric field in our APP needle discharge, unlike the bullets in the open air (afterglow region) discussed above. Consequently, the metallic needle tip radius should play a role in the streamer propagation. Therefore, the dependence of APP needle discharge dynamics on the gas flow rate and curvature radius of the needle tip is discussed in this paper. The purpose of this paper is to take a step in this direction.
In this paper, we propose a multi-species, self-consistent, two-dimensional axially symmetric plasma model which incorporates detailed helium– air finite-rate plasma chemistry. In this model, air is taken to mean a mixture of nitrogen (79%) and oxygen (21%). The effects of the helium gas flow rate and the curvature radius of the needle tip on the dynamics of the streamers are performed. Several important results are obtained and briefly summarized. Penning ionization and charge exchange reactions seem to play no significant role in streamer propagation. With increasing He gas flow rate from 0.2 SLM to 0.8 SLM, the solid circle emission shapes from oxygen and nitrogen can be made into hollow profiles and the average streamer propagation velocity decreases. Besides, with decreasing the needle tip curvature radius from 200 μ m to 100 μ m, the spatially resolved plasma radical distributions remain almost the same, except that around the near-tip region their peak values are getting to be twice or more.
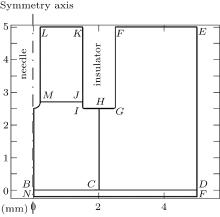
Our model consists of a coupled set of models: a neutral gas fluid model and a plasma dynamics model in two-dimensional cylindrical coordinates. More specially, steady state equations are solved with the neutral gas flow, whereas we solve time-dependent equations with the plasma discharge dynamics. The schematic diagram of the plasma needle and the simulation domain is shown in Fig. 1. The simulation domain in this study is similar to that previously reported by Sakiyama et al.[29] The simulation domain (5 mm× 5 mm) corresponds to the neutral gas model and the smaller region ABCHIJM (2 mm× 2.5 mm) to the plasma dynamics model, which is a part of the neutral gas simulation domain. The needle tip (identified by the points AMLin Fig. 1) is a semi-sphere with a radius 0.2 mm or 0.1 mm (0.2 mm in Fig. 1). The total length of needle is 2.5 mm. The needle is concentric with an insulator tube, which has an inner radius of 1.5 mm and an outer radius of 2.5 mm. The dielectric constant of the insulator is 5ε 0 (ε 0 is vacuum permittivity). The edges of the insulator tube (points I and G in Fig. 1) are rounded with a curvature radius of 50 μ m. The needle tip is flushed with the end of tube. The cathode dielectric is simplified as a planar quartz plate (BDPN in Fig. 1). The gap distance between the needle tip and the cathode surface is fixed at 2.5 mm. The thickness of the quartz plate is 0.2 mm with relative permittivity 5 unless otherwise stated. The electrical potential is zero at the backside of the quartz plate (NP in Fig. 1), where a grounded metal plate is assumed to be attached. A 4.0-kV positive dc voltage is applied on the needle tip. Besides, an external RC (R = 2 kΩ , C = 1 pF) circuit is assumed to be added to the plasma discharge, which is used to prevent the discharge from arcing. The voltage is assumed to be a square wave ‘ pulse’ , i.e., the peak voltage is applied instantaneously at the beginning of the simulation and remains constant for the simulation duration. The pure He gas flows into the domain from the boundary between the needle and the insulator tube (LK in Fig. 1).
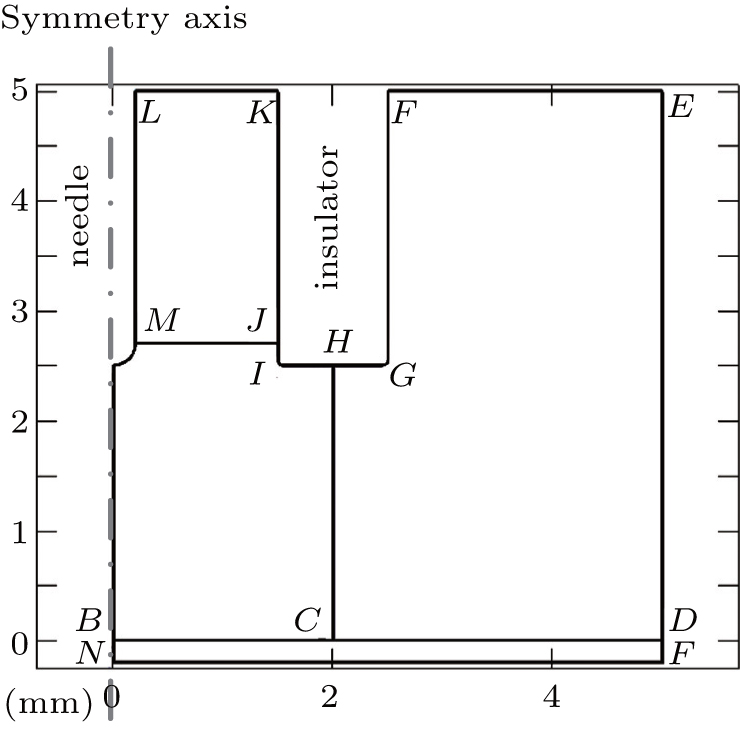 | Fig. 1. Side view schematics of the plasma needle and the simulation domain. |
The governing equations for the neutral gas model consist of the total mass continuity equation, Navier– Stokes equation, and convection– diffusion equation as follows:


where u = (u, w) is the velocity field, ρ is the gas density at the standard state (helium 0.1664 kg/m3, air 1.293 kg/m3), p is the pressure, η is the dynamic viscosity (helium 1.94× 10− 5 Pa· s and air 1.82× 10− 5 Pa· s), D is the diffusion coefficient (helium in air 1.82× 10− 5 m2/s), ci is the molar concentration of air or helium (mol/m3), and F = (0, 0, − ρ · g) is the body force field (buoyancy, g the gravity constant). The boundary conditions are summarized in Table 1. The velocity distribution of the helium at the inlet (LK in Fig. 1) is given by a fully developed laminar flow (i.e. Poiseuille flow) with 0.2 SLM or 0.8 SLM. The pressure at the exit (DE and EF) is fixed at 1 atm (1 atm = 1.01325× 10⁵ Pa) and the gas temperature is 300 K. No-slip velocity is applied on the solid surfaces of the needle (AML in Fig. 1), the dielectric tube (FGIK in Fig. 1) and the treated surface (BCD in Fig. 1). The hydrodynamic flow/mixing by plasma and photo-ionization mechanisms are not considered in this model, and background pre-ionization is assumed instead. The initial electron and ion densities in the gas are considered to be uniform to 107 cm− 3.
| Table 1. Boundary conditions for the neutral gas model. The symbols (A– M) correspond to the vertexes in Fig. 1. ur and uz are r and z components of the velocity field, respectively. n is the normal vector to the boundary. |
The plasma dynamics model is based on the classical fluid model, which is governed by the continuity equations with the drift– diffusion approximation, the electron energy conservation and Poisson’ s equation are as follows:


where subscript i, e, and He indicate the i-th species, electrons, and helium gas, respectively. Γ is the flux in the drift– diffusion approximate, Ri j is the j-th reaction rate corresponding to Table 3, q is the charge, μ is the mobility, E is the electric field, ϕ is the potential and ε is the mean electron energy. Δ E and Kinel are the energy loss to inelastic collisions and the corresponding reaction rate, respectively. ε 0 is vacuum permittivity.
The boundary conditions for the particle flux at the needle, the insulator and the treated surface are given as follows:


where e, i, m, and ε indicate the electrons, ions, metastables, and electron energy, respectively. Ti and Tg are the ion and background gas temperature. In this paper, we take Ti = Tg = 300 K. n is the normal vector pointing toward the surface and γ is the second electron emission probability. The secondary electron coefficient is 0.05 in this model. The surface charge accumulation is considered on the dielectric surface. α s and 
The self-bias potential at the surface of the quartz plate is calculated by Gauss’ s law:

where D1 and D2 are the electric displacement at the two sides of the dielectric surface, Ji · n and Je · n are the normal component of the total ion current density and total electron current density on the cathode surface, respectively. σ s is the net surface charge accumulated on the dielectric surface. The boundary conditions are summarized in Table 2.
| Table 2. Boundary conditions for the plasma dynamics model. The symbols (A– M) correspond to the vertexes in Fig. 1. Subscripts e, i, and m indicate electron, ions, and metastables, respectively. |
The plasma chemistry considered in this model consists of 17 different species (e, He, He+ , 


| Table 3. Helium– air chemistry reactions used in this model. |
The electron transport coefficients (mobility and diffusivity) are evaluated using the Boltzmann solver in advance, [33] while the transport coefficients applied for the ions and radical species are taken from Refs. [34]– [36]. The generalized Einstein relation is used to include the effect of high electric field for ion diffusivity. The radical species diffusion coefficients follow the assumption of binary diffusion in helium. It is important to note that the ionization and transports parameters for electrons in helium– air mixtures are governed by the values of reduced electric field and air mole fraction. According to previous studies, [19, 20] the electron ionization reaction coefficient is nearly independent of the air mole fraction (< 1%). Therefore, in our case, as the gas flow rate is high enough (i.e. > 0.5 SLM), the influence of air on the electron impact reaction rate and electron transports parameters is negligibly small. On the other hand, as the gas flow rate is low (at 0.2 SLM), the effect of the large air concentration on electron impact reaction rate cannot be neglected anymore.
All the governing equations given above are solved by COMSOL with the finite element method. First, we solve Eqs. (1)– (3) in order to obtain a steady state fluid flow field of the neutral gas. Then the flow field results are coupled to the time-dependent solver, which is applied to solve the plasma dynamic Eqs. (4)– (7). The free triangle mesh method is used to discretize the governing equations. The plasma domain requires a more refined, but more localized, mesh than neutral simulation. Close to the needle tip and the treated surface, the maximum mesh size is 1 μ m and the mesh size increases following a geometric progression to 10 μ m and is kept constant in the discharge gap (ABCHIJM in Fig. 1). The mesh constructed to resolve the neutral gas fluid model consists of 13221 cells. On the other hand, the mesh constructed to describe the plasma dynamic model consists of 298530 cells and the total number of degree of freedom is 2361412.
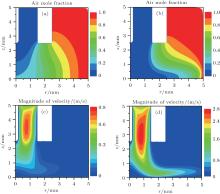
The mixing layer is an important feature to determine the plasma needle discharge, since it defines the spatial region where cross reactions between helium and air species can occur. Figure 2 shows the distribution of air mole fraction and the magnitude of velocity at 0.2 SLM and 0.8 SLM, respectively. Helium flows downward along the channel between the needle and the insulator tube from the inlet (z = 5 mm) to the cathode surface (z = 0 mm). The fluid velocity becomes mostly radial near the stagnation point at the cathode surface. The gas concentration distribution is mostly determined by a balance between the convective flow of He and backdiffusion of ambient air from the surroundings. As can be seen in Fig. 2(b), as the gas flow rate is 0.8 SLM, the higher gas flow rate leads to rapid decreasing of air mole fraction in the discharge gap. However, with decreasing the gas flow rate to 0.2 SLM, a significant increase in air concentration is observed, especially at larger radial and smaller axial positions, as shown in Fig. 2(a). Figures 3(a) and 3(b) show the axial and radial (z = 0.65 mm) distributions of the air mole fraction, respectively. It also demonstrates that backdiffusion against the convective transport is more pronounced at larger radial and smaller axial positions. Besides, as the gas flow rate increases from 0.2 SLM to 0.8 SLM, air mole fraction at point r = 0 is found to decrease rapidly, from 0.204 to 0.003 (shown in Fig. 3(a)).
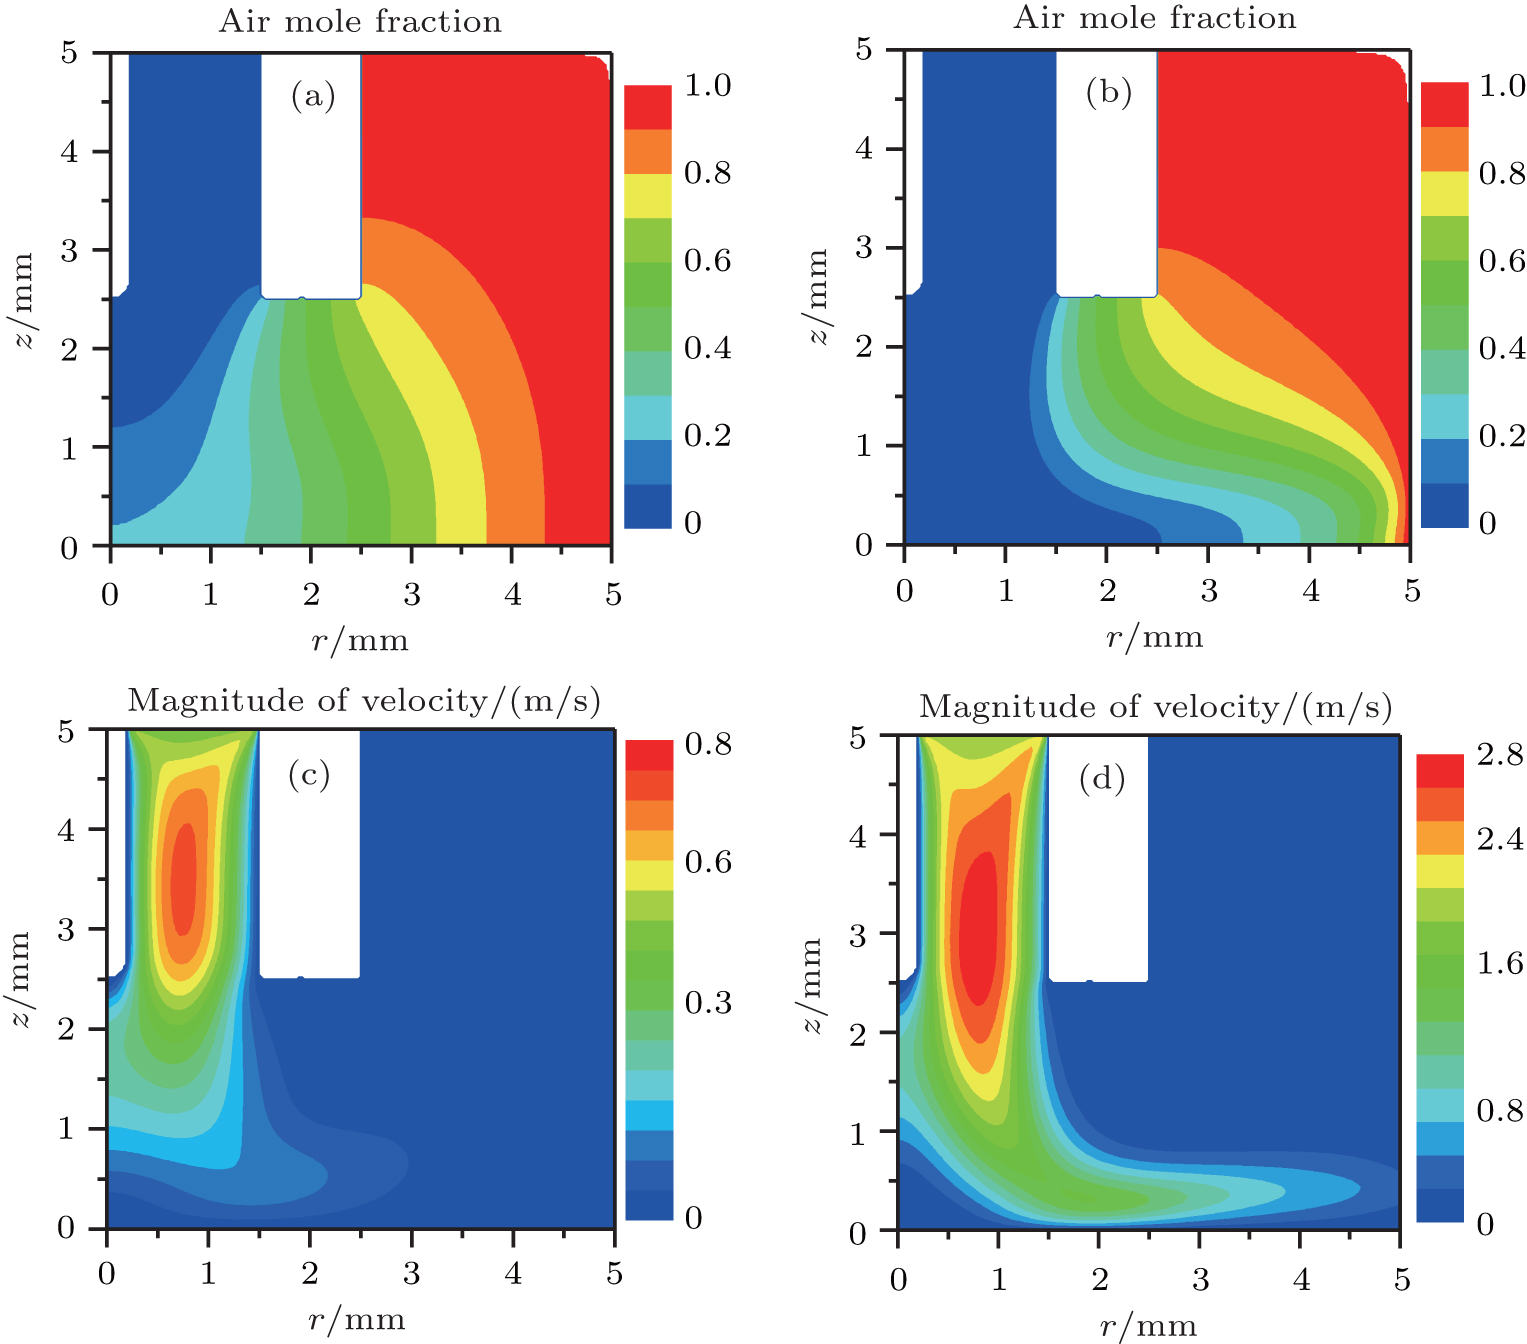 | Fig. 2. Air mole fraction at (a) 0.2 SLM, (b) 0.8 SLM, and the corresponding magnitude of velocity at (c) 0.2 SLM, (d) 0.8 SLM. |
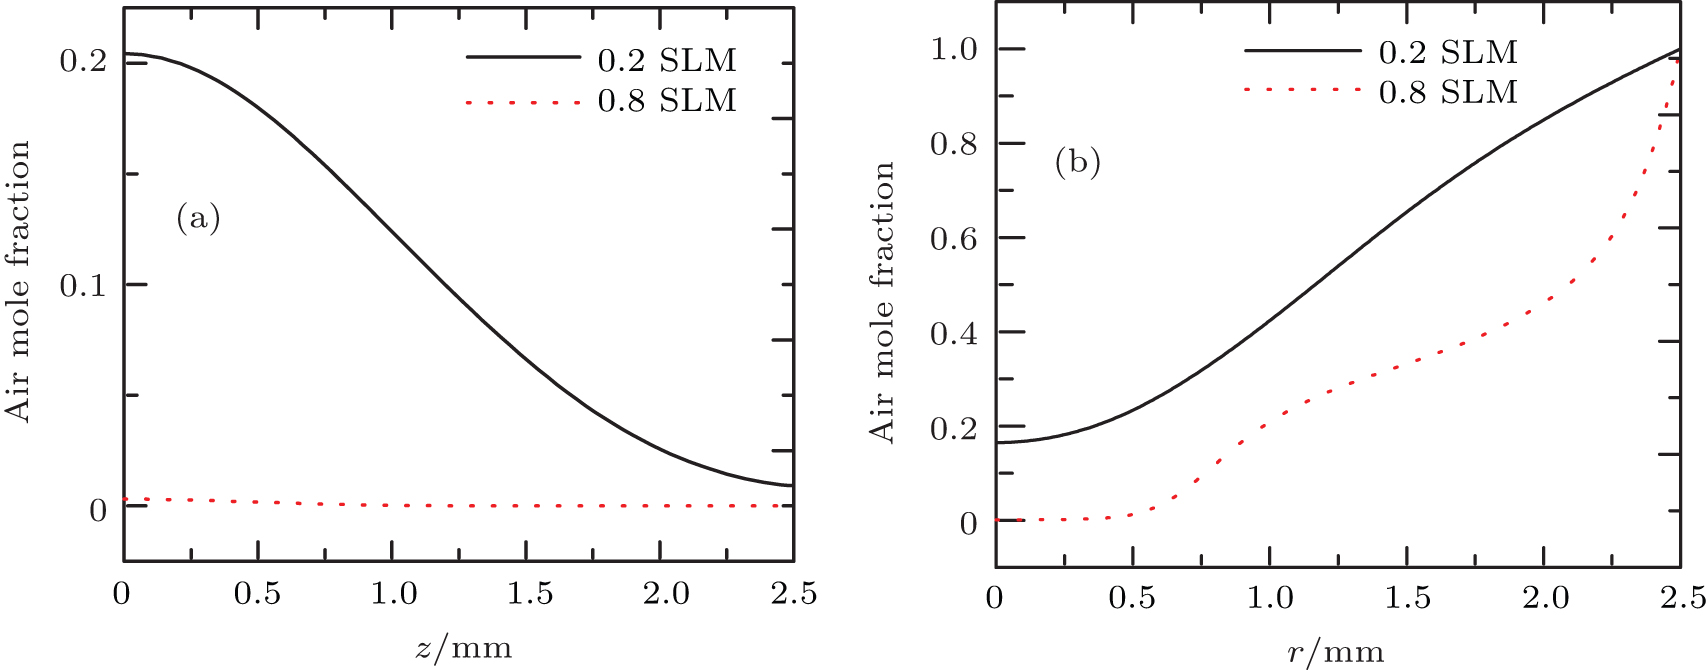 | Fig. 3. (a) The axial and (b) radial (z = 0.65 mm) distributions of the air mole fraction, respectively at 0.2 SLM, and 0.8 SLM. |
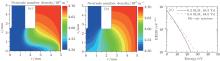
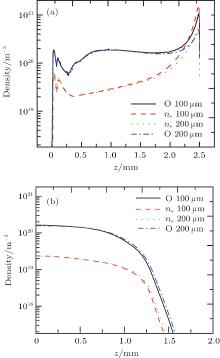
Figures 4(a) and 4(b) show the number densities of He– air gas mixture at 0.2 SLM, and 0.8 SLM, respectively. Obviously, the number densities are on the order of 1025 m− 3 at both gas flow rates. Moreover, as the gas flow rate increases from 0.2 SLM to 0.8 SLM, the densities of gas mixture illustrated in Fig. 4 are in good agreement with the results shown in Fig. 2. In particular, coefficients concerning electrons depend on the electron energy distribution function (EEDF), which is in general not Maxwellian but varies significantly depending on the discharge conditions. In our work, the reduced electric field E/N (ratio of the electric field strength to gas mixture number density) is determined to be 63.5 Td (0.2 SLM) and 64 Td (0.8 SLM), and the degree of ionization is set to be 10– 4. Based on these input parameters (reduced electric field and air mole fraction), the corresponding EEDFs calculated by the BOLSIG+ are plotted in Fig. 4(c), respectively. Expectedly, the EEDFs are induced to deviate slightly from Maxwellian distribution function. Furthermore, curves tend to have a slightly steep downward slope with the decreasing gas flow rates. In other words, an excess of air molecule in the helium has a negative effect on electron temperature. As will be discussed later, the large amount of impurities air creates loss pathways for electron energy via electron collisions with these N2 and O2 molecules. Therefore, the obtained EEDFs are applied to calculate the electron transport and rate coefficients using the Boltzmann solver in advance.
 | Fig. 4. Number densities of He– air gas mixture at (a) 0.2 SLM, (b) 0.8 SLM, and corresponding EEDFs calculated by the BOLSIG+ . |
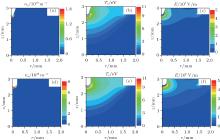
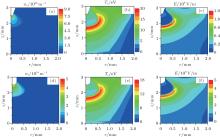
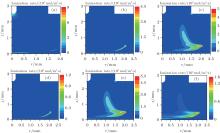
In this subsection, the gas flow rate is fixed at 0.2 SLM, and we focus on building the relationship between the needle tip radius and the discharge dynamics. Typical plasma characteristics parameters (electron density, electron temperature, and electric field) at 2.5 ns with tip radius 100 μ m (Fig. 5(a)– 5(c)) and 200 μ m (Figs. 5(d)– 5(f)) are shown in Fig. 5. For better visualization of the plasma dynamics domain, we plot distributions in the smaller region (ABCHIJM in Fig. 1). For a given applied voltage, during the first 2.5 ns, the electron avalanche takes place at the near-tip region, where the strong electric field is produced by a small radius of curvature. Besides, these plasma parameters at the condition of tip radius 100 μ m are larger than those at 200 μ m. The more sharpened needle tip is favorable to produce an enhanced local electric field (see Fig. 5(c) and 5(f)), causing pronounced electron avalanches, resulting in nearly doubled electron density (see Fig. 5(a) and 5(d)). However, the radial dimensions of the streamer are found to be smaller with a sharpened needle tip, which may be due to the smaller excited needle electrode area. These plasma parameters at 4.5 ns are also plotted in Fig. 6. At this time, the electric field and electron temperature located at the streamer head are almost the same, as shown in Figs. 6(e) and 6(f). These interesting simulation results imply that the local enhanced electric field caused by the sharpened needle tip is confined to the nearby small semi-sphere region. Fig. 7 shows the radial (z = 0.65 mm) and axial density distributions of electron and ground state atomic oxygen at 10 ns with tip radius 100 μ m and 200 μ m, respectively. It further confirms that the spatially resolved plasma parameters distributions have little change with the tip radius, except that near the needle tip their peak values are getting to be twice or more.
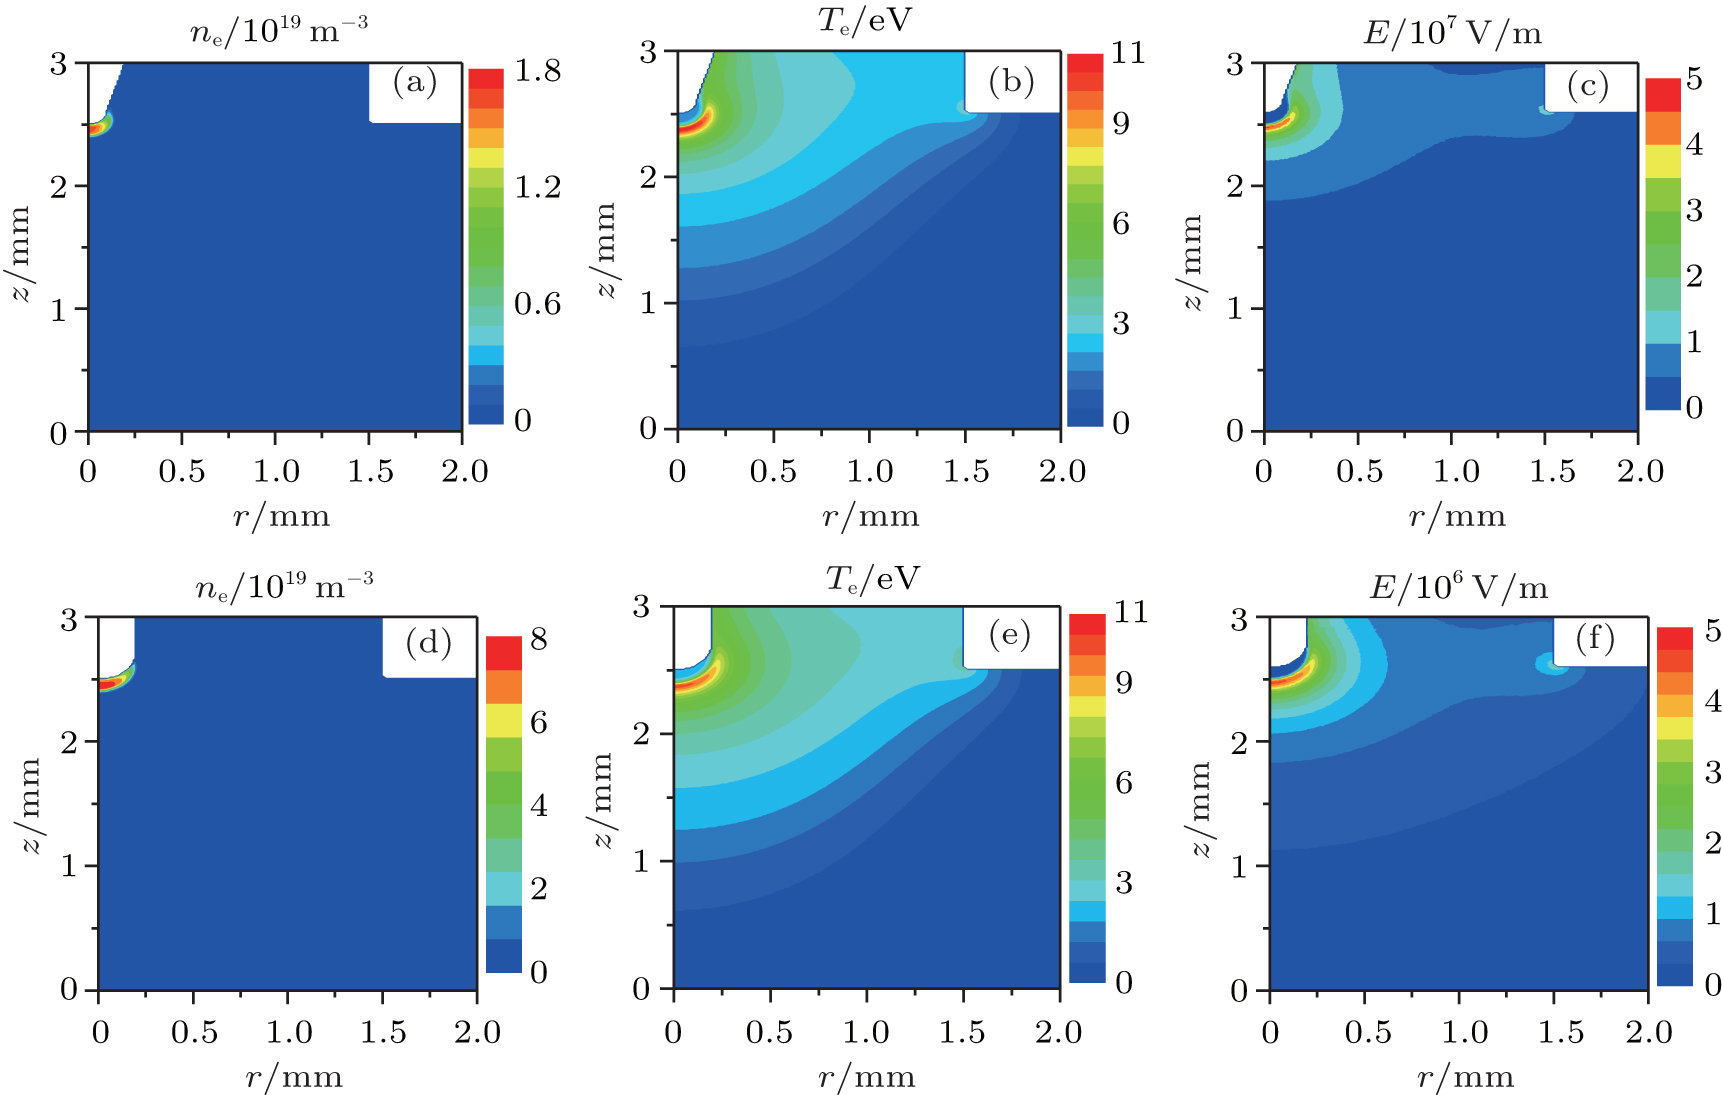 | Fig. 5. Typical streamer propagations with needle tip radius 100 μ m (panels (a)– (c)) and 200 μ m (panels (d)– (f)) at 2.5 ns after the start of the 4.0 kV pulse. |
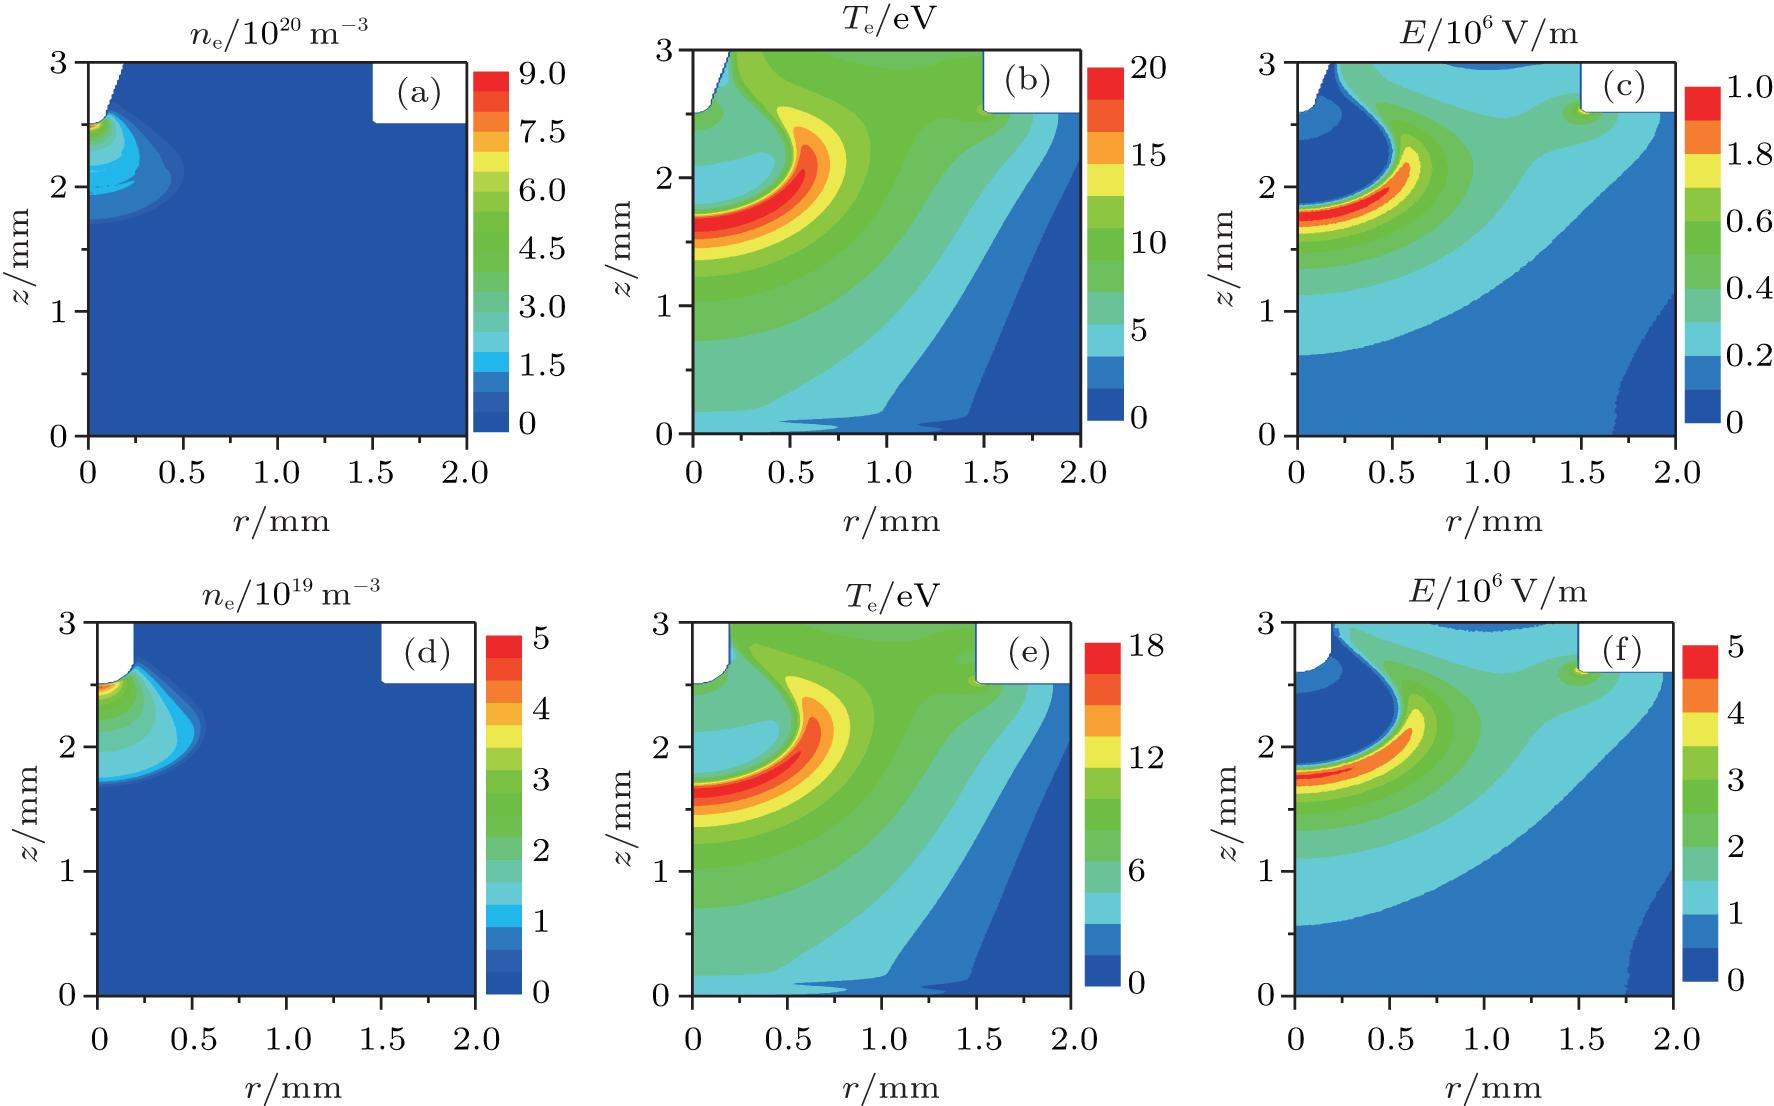 | Fig. 6. Typical streamer propagations with needle tip radius 100 μ m (panels (a)– (c)) and 200 μ m (panels (d)– (f)) at 4.5 ns after the start of the 4.0 kV pulse. |
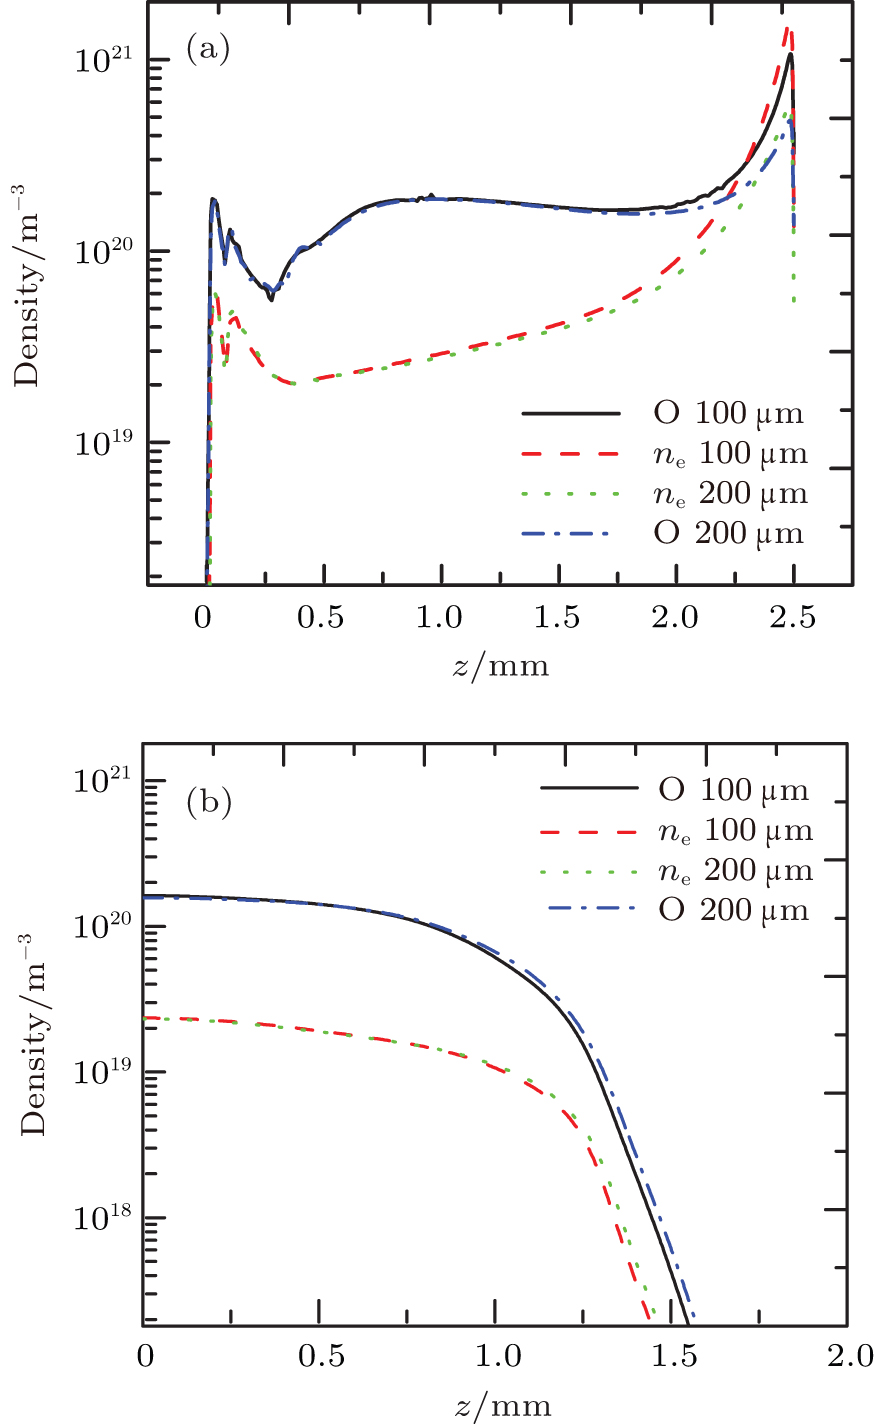 | Fig. 7. (a) The axial and (b) radial (z = 0.65 mm) density distributions of electron and ground state atomic oxygen at 10 ns with tip radius 100 μ m and 200 μ m, respectively. |
Note that the discharge gap and applied voltage are fixed at 2.5 mm and 4.0 kV, respectively, in this work. Besides, the helium gas flow rate is kept at the constant 0.2 SLM, in other words, the neutral gas density distribution is also kept constant. Then, we can make a conclusion that the mean reduced electric field (E/N) remains the same as the tip radius varies, which is usually used to indicate the uniformity of plasma-delivered reactive species. Therefore, with decreasing tip curvature radius from 200 μ m to 100 μ m, the spatially resolved plasma parameters distributions remain almost the same, except that around the near-tip region their peak values are getting to be twice the original values or more.
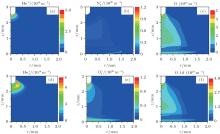
In this subsection, the tip radius is kept constant at 200 μ m. As shown in Figs. 2 and 3, we can see two distinctive patterns of air mole fraction profile at gas flow rate 0.2 SLM and 0.8 SLM. It is meaningful to reveal the effect of gas flow rate on streamer dynamics. Figures 8 and 9 show the density distributions of He+ , 


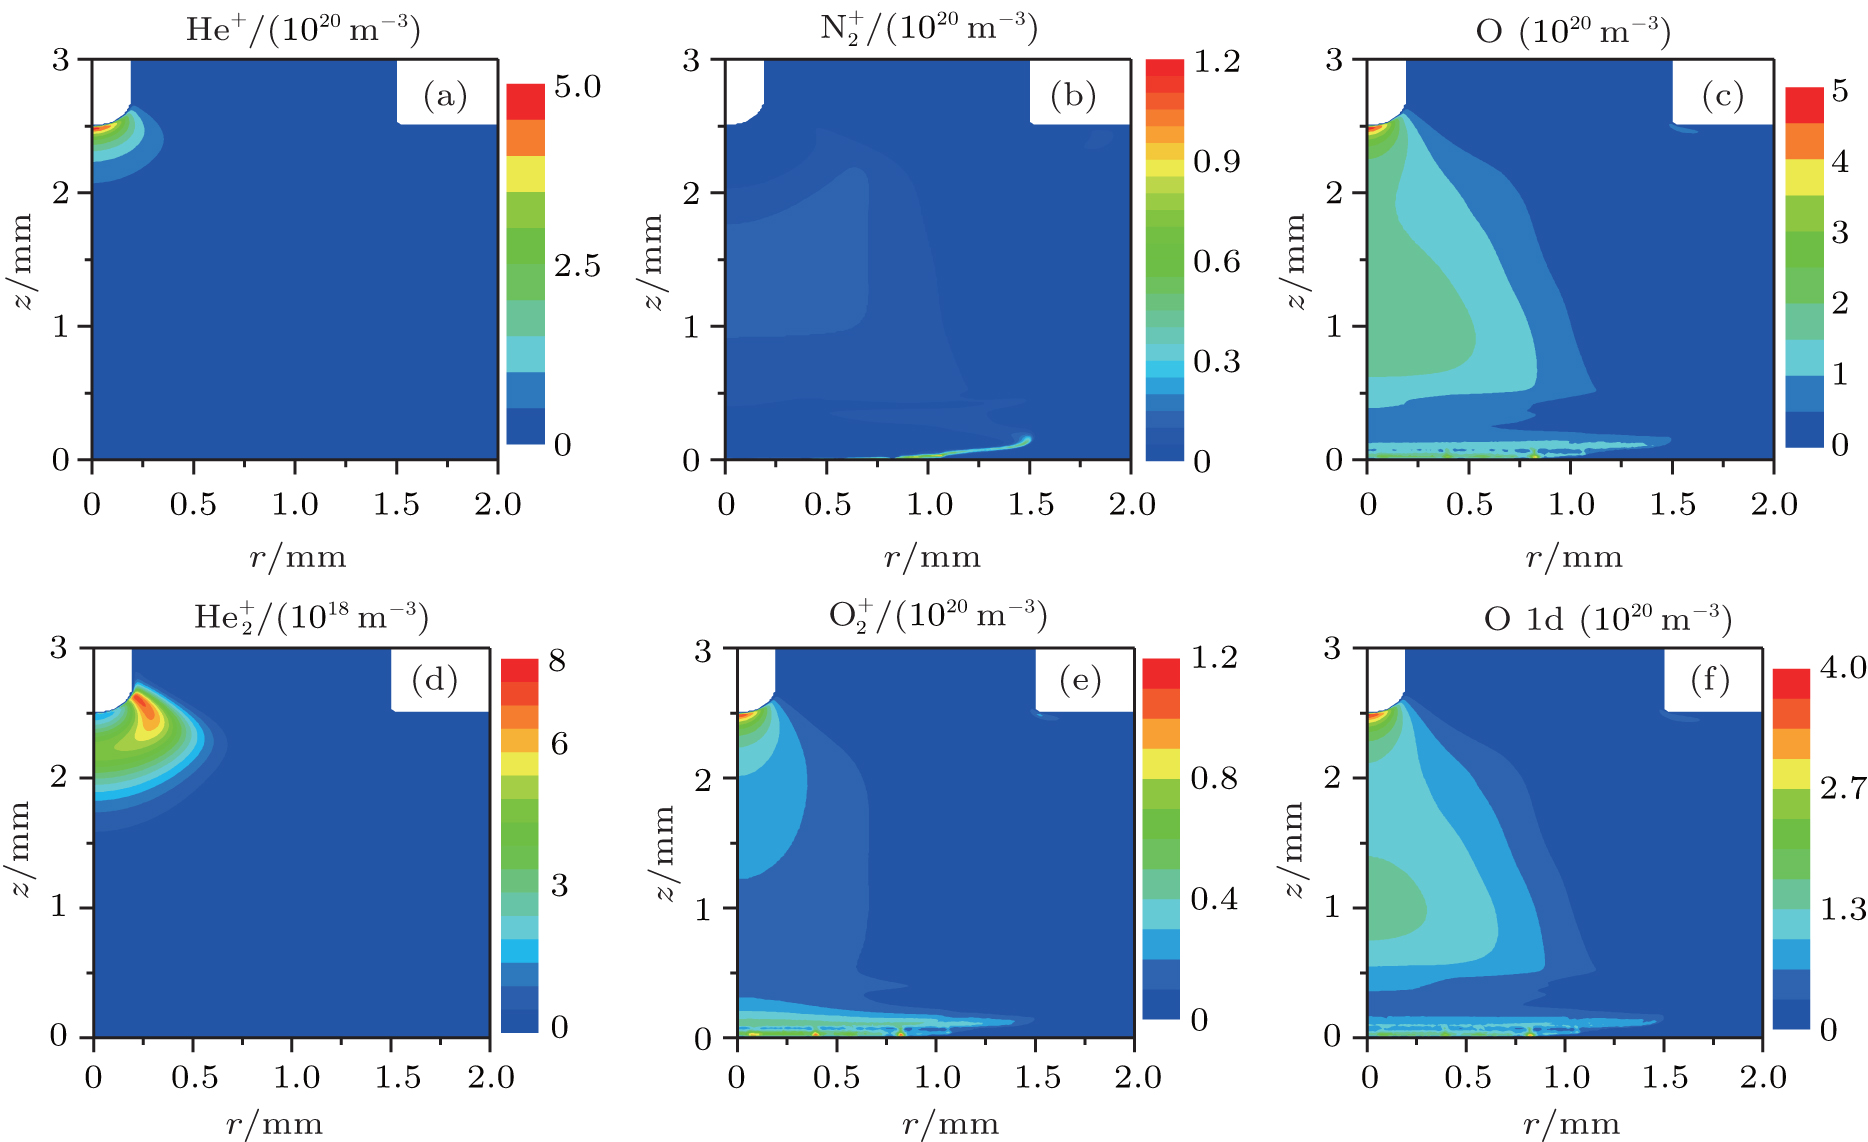 | Fig. 8. Density distributions of needle plasma species at 10 ns and 0.2 SLM. |
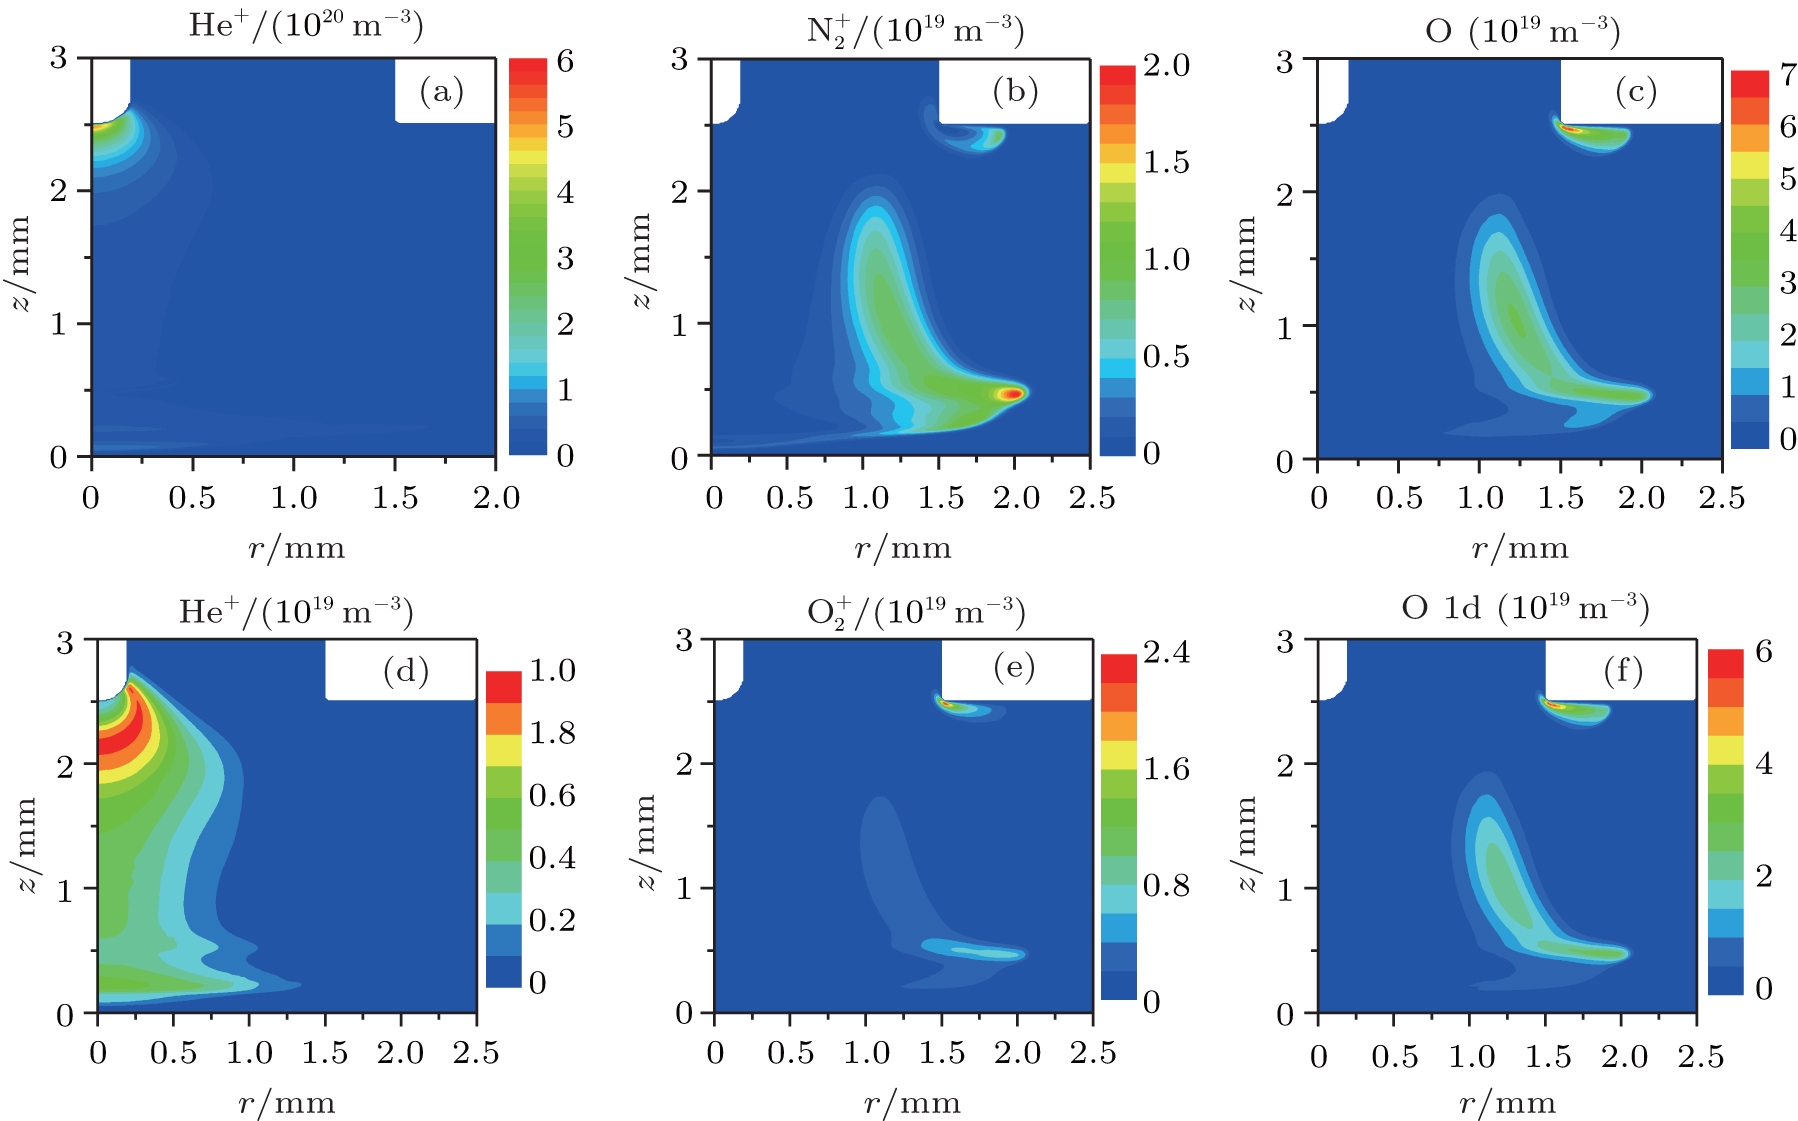 | Fig. 9. Density distributions of needle plasma species at 10 ns and 0.8 SLM. |
Sakiyama et al.[37] reported the gas flow dependence of ground state atomic oxygen near the cathode surface using two-photo absorption laser-induced fluorescence spectroscopy in APP RF needle discharge. In more detail, a circular density distribution was observed at 0.5 SLM, whereas the profile turned to a ring at 1.0 SLM. Although the RF needle discharge mechanism is quite different from our dc needle discharge, our model reproduces the two distinctive ground-state atomic oxygen density profiles that appear to be qualitatively similar to the measured results.
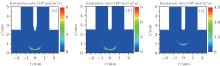
The ionization rate is usually used to predict the streamer propagation. Therefore, we plot the total ionization reaction rates in Fig. 10. As can be seen in Figs. 10(a) and 10(b), it also demonstrates that the streamer propagation has little change with the tip radius. However, as the gas flow rate increases to 0.8 SLM, the average streamer propagation velocity decreases, as shown in Figs. 10(b) and 10(c). As mentioned above, it is concluded that the additional N2 in the air stimulates the Penning ionization, which facilitates the volume ionization and hence, accelerates the propagation of the plasma bullet. As shown in Fig. 3, as the gas flow rate increases to 0.8 SLM, the air mole fraction at r = 0 is observed to decrease rapidly, from 0.204 to 0.003. Therefore, our simulation results are in good agreements with previously reported results.[19– 21]
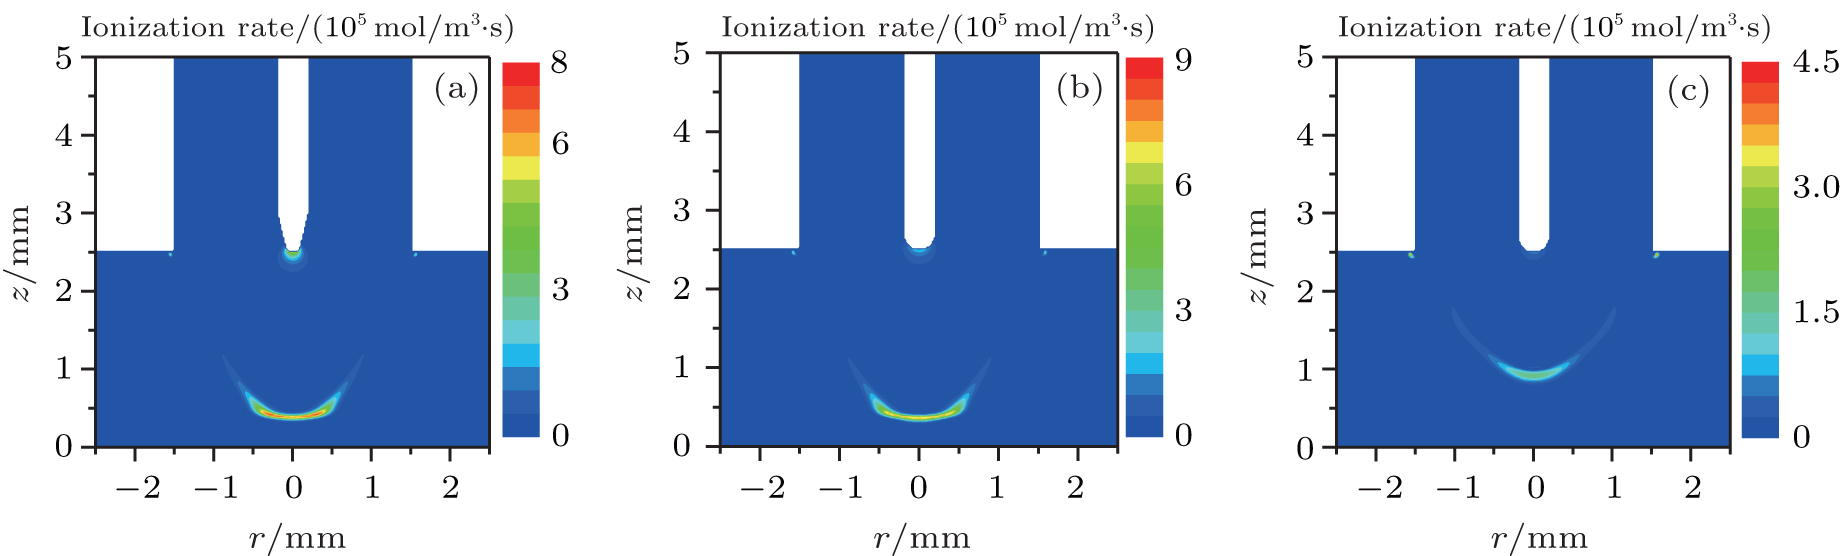 | Fig. 10. The total ionization rates (including R3– R6, R29, R36, R46– R49 in Table 3) of plasma needle discharge at 6.5 ns, (a) 0.2 SLM and tip radius 100 μ m; (b) 0.2 SLM and tip radius 200 μ m; and (c) 0.8 SLM and tip radius 200 μ m. |
Figures 11 and 12 show the plots of important contributions to the total ionization rate at 0.2 SLM and 0.8 SLM, respectively. The electron impact ionization of helium and helium metastables concentrates in the streamer head (Fig. 11(a)). Besides, the ionization rates of O2 and N2 by electron also clearly dominate in the streamer head (Fig. 11(b) and 11(d)). The peak ionization rates occur simultaneously on-axis. We notice that the ionization rate of N2 is slightly higher than that of the other case, therefore, 

 | Fig. 11. Ionization reaction rates distribution at 6.5 ns and 0.2 SLM. (a) Helium related (R3– R6 in Table 3), (b) ionization of O2 by electron (R29), (c) Penning ionization of O2 by He* and    |
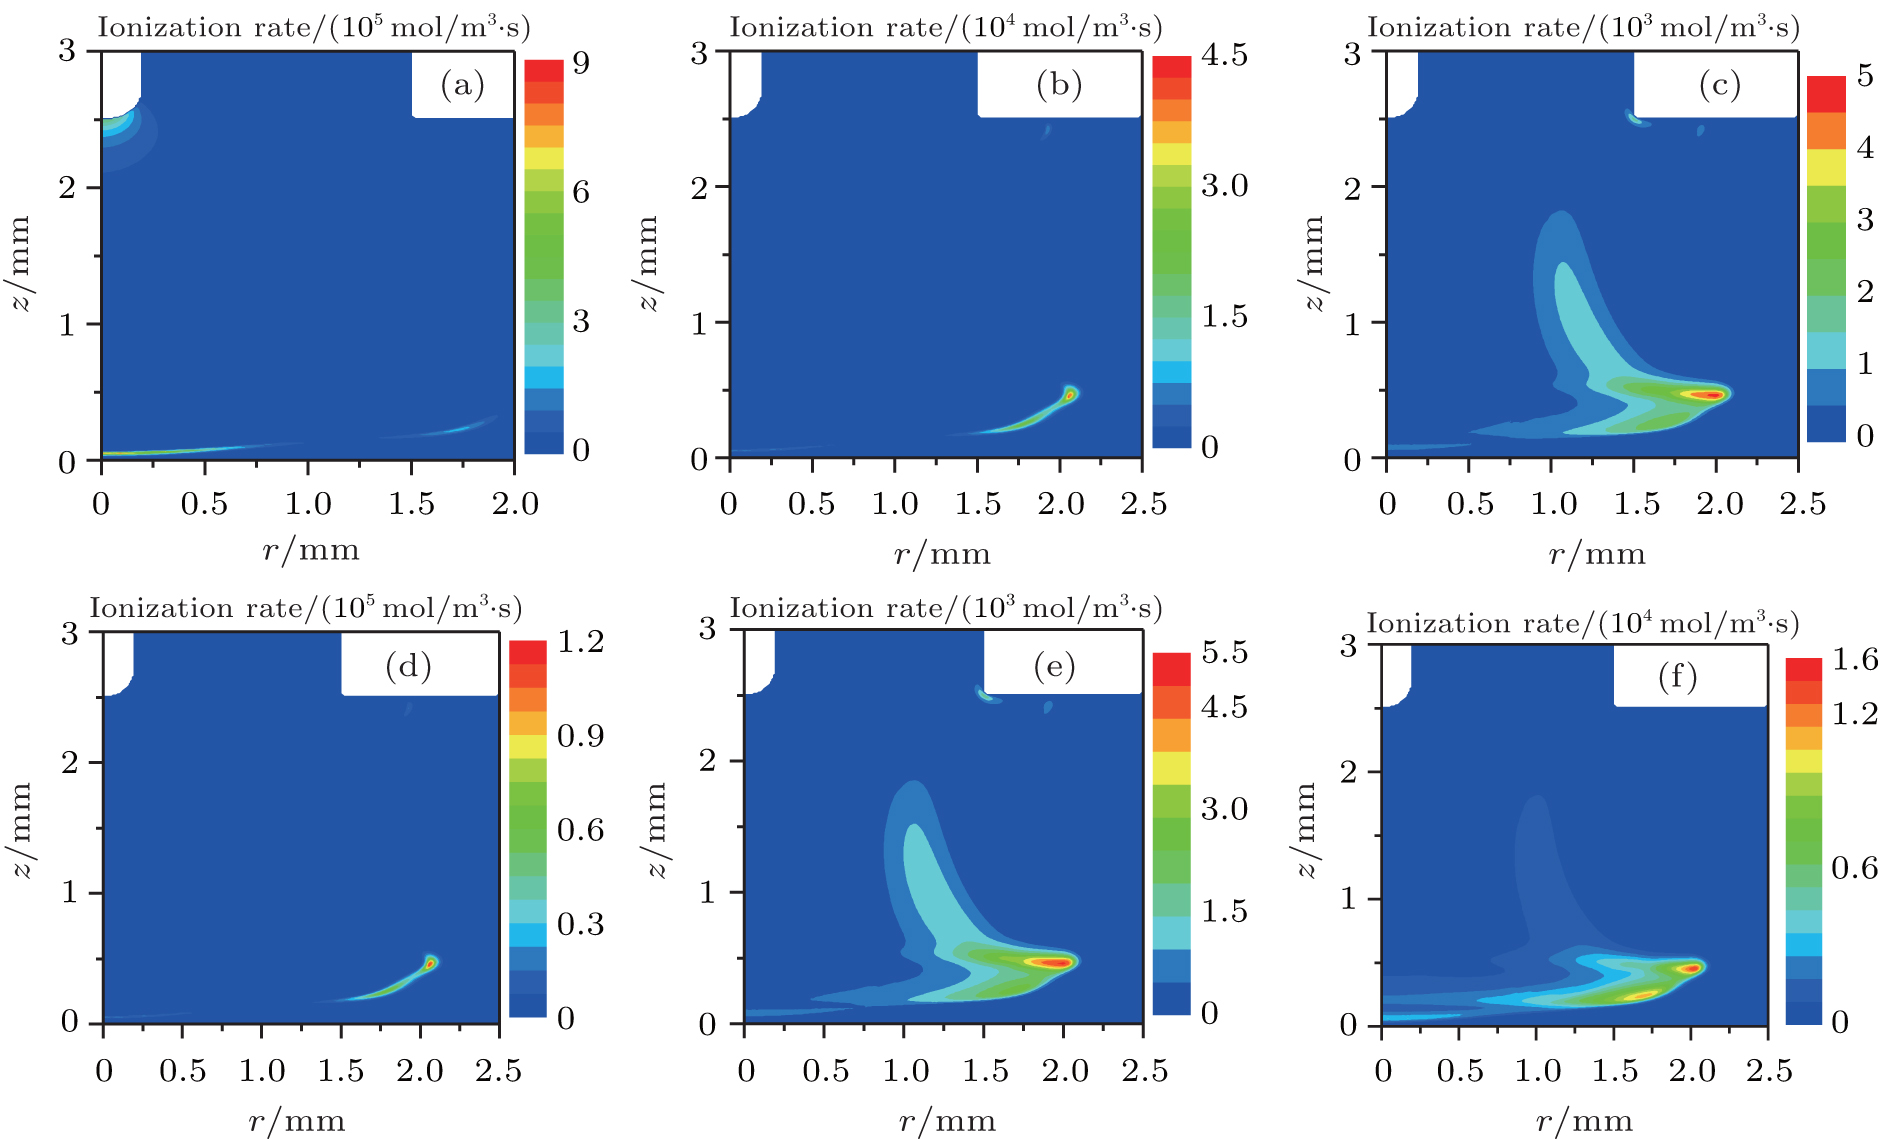 | Fig. 12. Ionization reaction rates distribution at 10 ns and 0.8 SLM. (a) Helium related (R3– R6 in Table 3), (b) ionization of O2 by electron (R29), (c) Penning ionization of O2 by He* and    |
A single streamer discharge mechanism of the helium atmospheric pressure plasma needle has been studied numerically in a two-dimensional axisymmetric model. It is found that the needle tip curvature radius has little effect on the streamer dynamics, except that around the near-tip region the peak densities of plasma parameters are getting to be twice the value or more. It is also concluded that gas flow rate plays an important role in streamer propagation. Air impurities stimulate the Penning ionization and cause a significant increase in the streamer propagation speed. Besides, Penning ionization reactions also have an impact on streamer propagation but not to as big as electron-impact ionizations. With increasing the gas flow rate from 0.2 SLM to 0.8 SLM, the emissions resulting from reactive oxygen and nitrogen species change from solid circle to hollow shapes, which are contributed to the large radial concentration gradient of air impurities concentration.
| 1 |
|
| 2 |
|
| 3 |
|
| 4 |
|
| 5 |
|
| 6 |
|
| 7 |
|
| 8 |
|
| 9 |
|
| 10 |
|
| 11 |
|
| 12 |
|
| 13 |
|
| 14 |
|
| 15 |
|
| 16 |
|
| 17 |
|
| 18 |
|
| 19 |
|
| 20 |
|
| 21 |
|
| 22 |
|
| 23 |
|
| 24 |
|
| 25 |
|
| 26 |
|
| 27 |
|
| 28 |
|
| 29 |
|
| 30 |
|
| 31 |
|
| 32 |
|
| 33 |
|
| 34 |
|
| 35 |
|
| 36 |
|
| 37 |
|