

Solvation of halogen ions in aqueous solutions at 500 K–600 K under 100 atm
[Shen Haoa), b) , Hao Tinga), b) , Zhang Feng-Shou†a), b), c)  ]
]
]
|
|


†Corresponding author. E-mail: fszhang@bnu.edu.cn
*Project supported by the National Natural Science Foundation of China (Grand Nos. 11025524 and 11161130520), the National Basic Research Program of China (Grant No. 2010CB832903), and the European Commission’s 7th Framework Programme (FP7-PEOPLE-2010-IRSES) (Grant No. 269131).
Structural properties of the pure water and halogen solutions at high temperatures and pressures are studied by using the molecular dynamics simulations and quantum molecular simulations. The related characters are calculated as functions of temperature and pressure. The results show that the hydrogen bonded networks become looser as temperature increases, with the collapse of the traditional tetrahedral structure. It is similar to the concentration-dependent collapse in the NaCl solutions. However, adding other halogen elements has no further effects on the already weakly bonded water molecules. At the phase changing points, the process of hydration is evident for the bigger ions, so that the bigger the ion is, the smaller a cluster is formed.
The hydration processes of biological molecules, the formation of ion clusters, and the chemical reactions in aqueous media, especially for the solutions at high temperatures and pressures, are all intimately associated with water.[1– 7] It is generally considered that the key roles in both biophysical and biochemical processes of water, either the solvation of polar and ionic substances or the repulsion of hydrophobic materials, are all determined by the hydrogen bonding ability. Therefore, the studies on the dynamical characters and microstructures of ionic solvation are very important and intriguing. Many experiments and theoretical studies have been reported on the physical and chemical natures of the hydration processes.[8– 10] A series of water models and the corresponding functions of phase transitions are also proposed.[11, 12] However, the mechanisms behind their behaviors and functions are still poorly investigated.
As a solvent, its own unique nature and characteristics affect the solvation of ions and biological molecules.[13, 14] Corresponding researches on the hydration of DNA, proteins have also been revealed in detail.[15– 19] Compared to other simple organic liquids, water has more complex phase diagrams, in that a number of triple points and one, probably two, critical points can be found.[20– 23] Critical water, [24– 26] near the critical point of the phase diagram, is such a special fluid that many strange properties, such as the decrease of dielectric constant, the special density change, and the coexisting phases, are all observed.[27] A slight change of the temperature or pressure may shift the phase of the system from one state to another. Therefore, the relationship between ions and water molecules at extreme conditions is of theoretical and experimental importance. Since the halogen elements are one of the most important singly charged anions, most of the experiments and theoretical studies of their solutions are focused on the vapor and gas– liquid mixture phase. A thorough investigation of the changes of water structure and hydration processes of halogen elements at the phase changing points is desperately needed.
Molecular dynamics (MD) simulation, one of the classical computation methods, [28] allows one to relate macroscopic to microscopic phenomena. In our present work, the hydration processes and cluster formation have been extensively studied by using the MD simulation, [29, 30] especially for its temperature-dependent properties.[31] The anomalous properties of water are also partly illustrated.[32, 33]
In our MD simulations the SPC water model is used.[34] 256 water molecules and 8 pairs of ions, NaF, NaCl, NaBr or NaI, are contained in the system, respectively. The corresponding concentration is 1.74 M, which is smaller than the corresponding saturation concentrations. The ensemble for the systems is NPT, revealed by using the Noosé – Hoover method. The time step for the simulations is 0.1 fs, with the simulation time of 5 ns. The pressure for the simulations is 100 atm (1 atm = 1.01325× 10⁵ Pa), which is the same order of magnitude with the critical point: 220 atm.
Table 1 lists the parameters for the SPC water model and ions. The parameters for ions are determined by Smith and Dang.[35] For different particles, the parameters were treated by σ mn = (σ m + σ n)/2 and 
| Table 1. Parameters of the SPC water model and ions in the MD simulations. |
The intermolecular energies in the MD simulations for all particles are shown as,

in which

is the electrostatic interaction, where q is the charge of the atom, ε 0 the vacuum permittivity, ε the relative permittivity, and the rmn the distance between atom m and n. The other one,

is the Lennard-Jones interaction, where ε and σ determine the energy and distance scale, respectively.
In our MD simulations, the parameters used are empirical and whether it is possible to correctly describe the hydration processes at extreme conditions is still under consideration. Since the development of Density Function Theory (DFT) and its application in current computer simulations, the quantum molecular (QM) method is developed as an instrument to explore the properties of liquids.[36, 37] Therefore, comparative analysis between the MD simulations and QM simulations would judge the accuracy of the MD simulations and, further, shed light on the improvement of force field parameters for better describing the bulk water solutions.[38] In the QM simulations, the CP2K code is employed.[39] The self-consistent-charge density-functional tight-binding method (SCCDFTB) is used for the systems.[40, 41] The exchange– correlation energy function is expanded to the second order via using the SCCDFTB method. The reference density is calculated by 

Comparisons of the results from the QM and MD simulations are shown in Figs. 1(a) and 1(b). The inset of Fig. 1(a) is the density against the simulation time, averaged over the adjacent steps in the QM simulations (at 298 K under 1 atm). After 8.2 ps the system reaches equilibrium and the density of the system is basically around 0.96 g/cm3, which is closer to that of the real water, 1.00 g/cm3. This result is better than that of the density function theory together with BLYP or PBE (the density of the system is 0.75 g/cm3 for BLYP and 0.88 g/cm3 for PBE).[42]
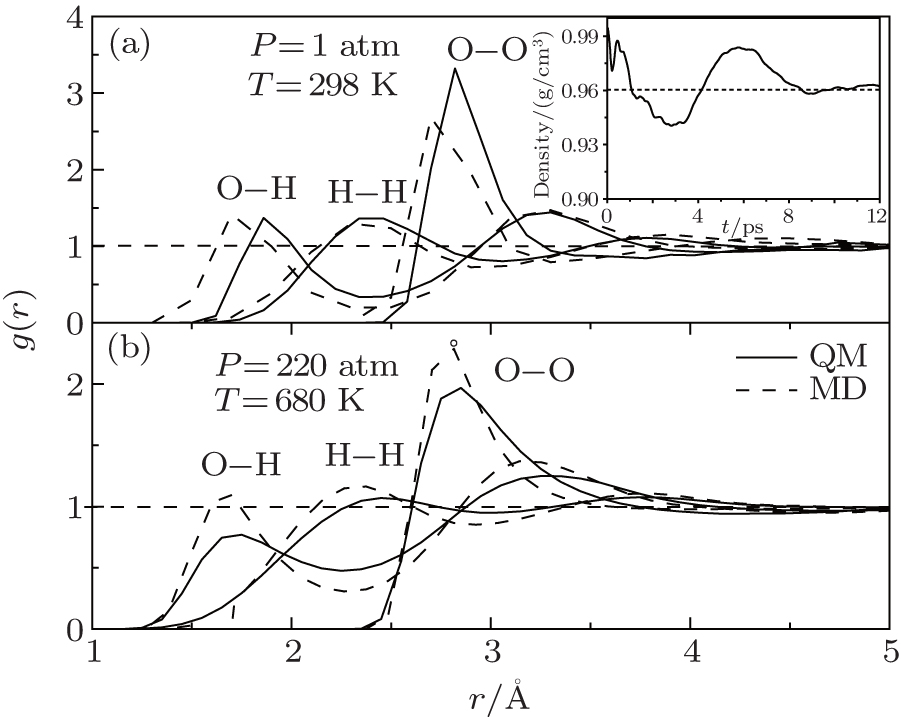 | Fig. 1. RDFs of O– O, O– H, H– H in the QM and MD simulations at room temperature and pressure (a) and at critical point (b). The density in the QM simulations is shown in the inset of panel (a). |
The Radial Distribution Functions (RDFs) of the QM simulations are derived from the trajectories between 8.2 ps and 12 ps. As shown in Fig. 1(a), the position of the RDF peak for O– H is about 0.1 Å larger than that in the MD simulation, in accordance with the larger O– O distance (O– H· · · O) and the lower density of around 0.96 g/cm3. This is because that parts of the long-term weak interactions are hard to be included in the QM method.[39, 40] However, for the hydrogen bond, the second peak of g(r)OH (H– O· · · H), the results in both the QM and MD simulations are nearly the same.
For a system at high temperature and pressure: 220 atm and 680 K, the RDFs via using the two methods are almost coincidence as shown in Fig. 1(b). The density of the systems is changed from the initial 1.00 g/cm3 to just 0.26 g/cm3. The RDF peaks are also lower and broader compared to that at the room temperature and pressure. Furthermore, the second peaks of g(r)OO almost disappear, indicating that the hydrogen bonds between water molecules become looser.
Actually, the dispersion part of long-term weak interaction is not significant at high temperatures and pressures. This is the main reason for the special properties such as a low dielectric constant, and large ions clusters in these specific conditions[43, 44] and so do almost overlapped curves. Through the comparative analysis, the corresponding distributions at high temperature and pressure are descried consistently and the two methods are both suitable for mimicking the bulk water at high temperatures and pressures though the cost is expensive for the former one.
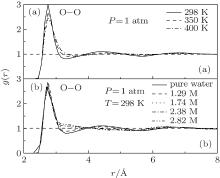
RDFs of O– O in pure water and NaCl solutions are calculated and shown in Fig. 2, respectively. The value of the first peak in Fig. 2(a) decreases from 3.1 to 2.5 monotonously when the temperature increases from 298 K to 400 K, with the decreased coordinated molecules from 3.25 to 3.08. Consequently, the decrease of the surrounding coordinated water molecules results in the diminish of the number of the hydrogen bonds. This is in agreement with the decreased second RDF peaks of g(r)OO in Fig. 2(a) and g(r)OH in Fig. 1(a), respectively.
 | Fig. 2. RDFs of O– O in pure water (a) and NaCl solutions (b). |
Figure 2(b) is the g(r)OO of water molecules in sodium chloride solutions under different concentrations at 298 K under 1 atm. For the concentration of 1.74 M, the RDF peak at 4.5 Å almost disappears. Regarding the concentration of 2.38 M or 2.82 M, the reduction of the second peak is more significant. The position of the second peak in pure water solution is approximately 1.7 times to that of the first peak, indicating the existence of the typical tetrahedral liquid of water molecules.[13] However, in our present work, the second peak is extended from 4.5 Å to 6 Å as concentration increases, especially for the concentration of 2.82 M that the position of the second peak is nearly 2 times that of the first peak. It is already the typical Lennard-Jones liquid with the spherical symmetry structure. Surprisingly, the first peak of g(r)OO in each case is hardly affected. Consequently, adding NaCl or increasing the temperature can both largely affect the bulk structure of water solution, however, the first hydration shell frame in NaCl solutions is largely reserved. It seems that what the ions strongly influence is the bulk H-bonds networks rather than the water molecules in the hydration shell. This is different from the structure changes when decreasing the polarity of water molecules.[19]
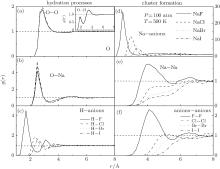
In order to investigate the effects of halogen elements at high temperatures and pressures, the hydration processes and cluster formation at 500 K under 100 atm are explored. As shown in Fig. 3(a), the g(r)OO and g(r)OH in these simulations almost coincide, in that replacing the chloridion by other different halogen elements has no further effects to the already weakly bonded water molecules. However, the hydration processes of Na+ are different in each case that the RDF peak in the NaF solution is the lowest and getting bigger when the size of anion is bigger. For the hydration of halogen elements in Fig. 3(c), both the positions of the first and second shells increase gradually with the atomic number. In short, there are no further effects to the bulk water structure by adding different halogen elements and the hydration of the cations and anions are regularly distributed.
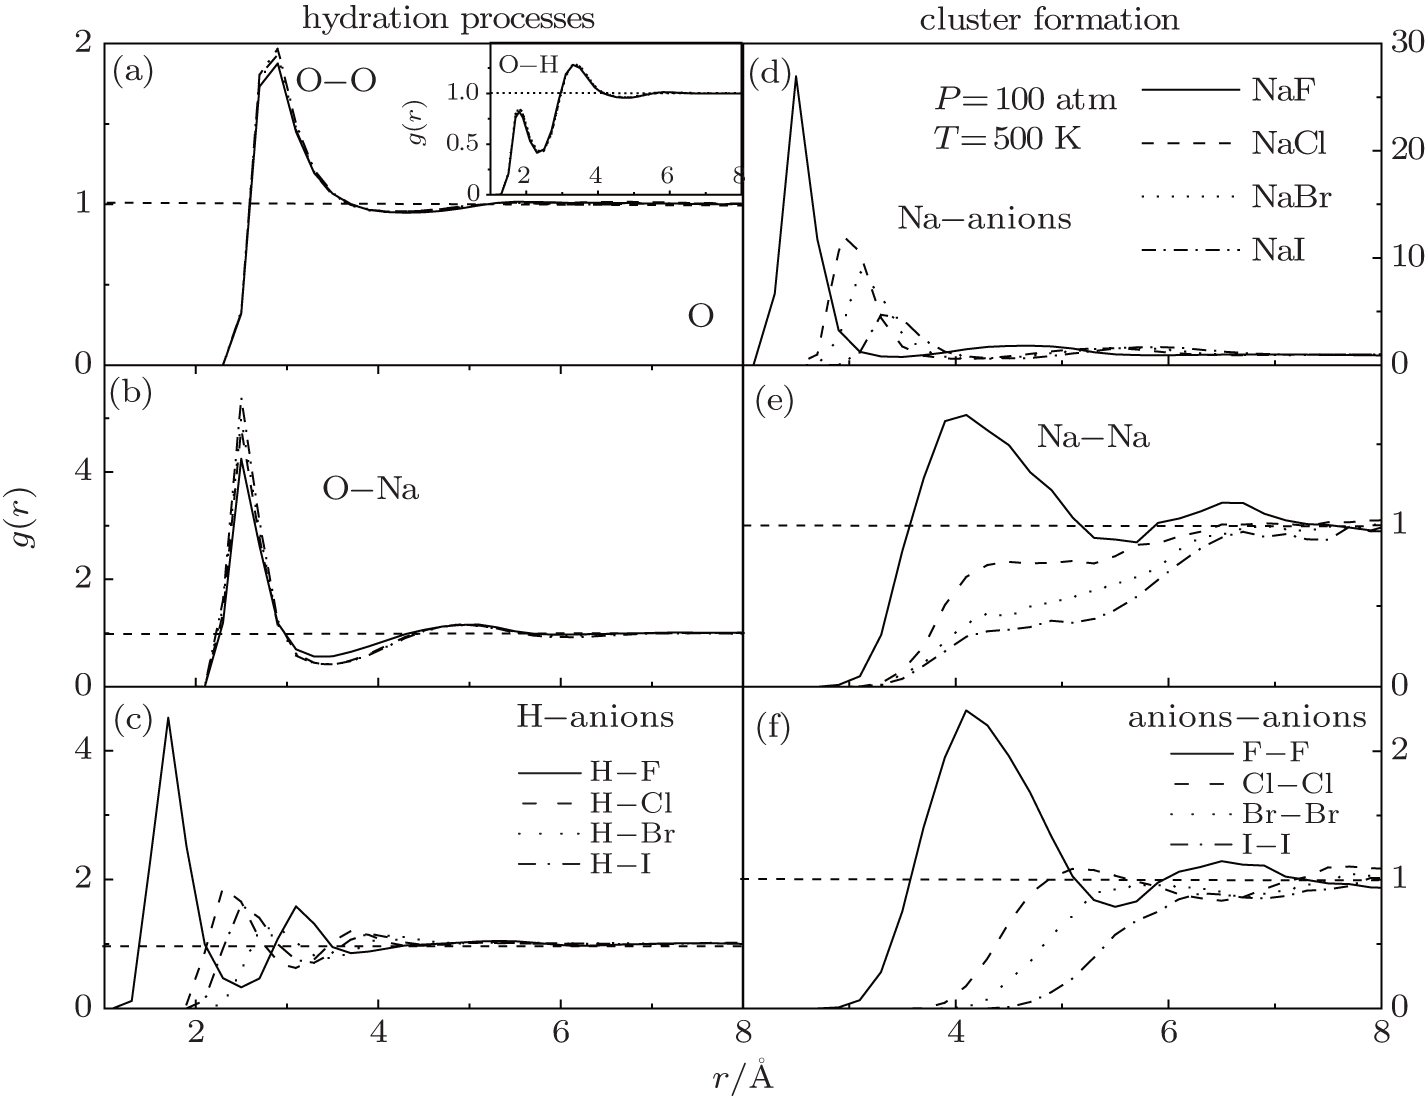 | Fig. 3. RDFs of O– O (a), O– Na (b), H– anions (c), Na– anions (d), Na– Na (e), anions-anions (f) in different solutions: NaF, NaCl, NaBr, NaI, under 100 atm at 500 K. |
Figure 3(d) is the RDFs between the Na+ and the halogen elements in different solutions. The values of the first and second peaks gradually decrease when the atomic number increases. Compared to the oxygen of water molecular, the Na+ is more preferable to be interacted with the halogen, especially for F− . However, when the atomic number increases, the force for hydration (Fig. 3(b), Fig. 3(c)) is comparable with the force for cluster formation (Fig. 3(d)). The halogen elements are therefore ‘ robbed’ by the water molecules. The structured cluster is also significant in the NaF solution that the values of the peaks are biggest for both g(r)NaNa and g(r)anionsanions in Figs. 3(e) and 3(f). On the contrary, the RDF peaks in other solutions are all less than 1, reflecting a lower probability for forming clusters.
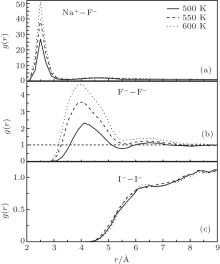
For a better understanding, RDFs of Na– F, F– F, I– I in NaF and NaI solutions under 100 atm at 500 K, 550 K, and 600 K are shown in Fig. 4. The solutions are all controlled at liquid state by increasing or decreasing the temperature abruptly near by the phase changing point. Regarding Fig. 4(a), the value of g(r)NaF is extremely high at 600 K, above the phase changing point of water. The corresponding coordination number of Na– F is near 1.0, so that almost all the solvents are bonded. The big clusters in these conditions are shown in Fig. 5 that parts of the clusters are already precipitated.
 | Fig. 4. RDFs of Na– F (a), F– F (b) in NaF solutions, and I– I (c) in NaI solutions under 100 atm at 500 K, 550 K, and 600 K, respectively. |
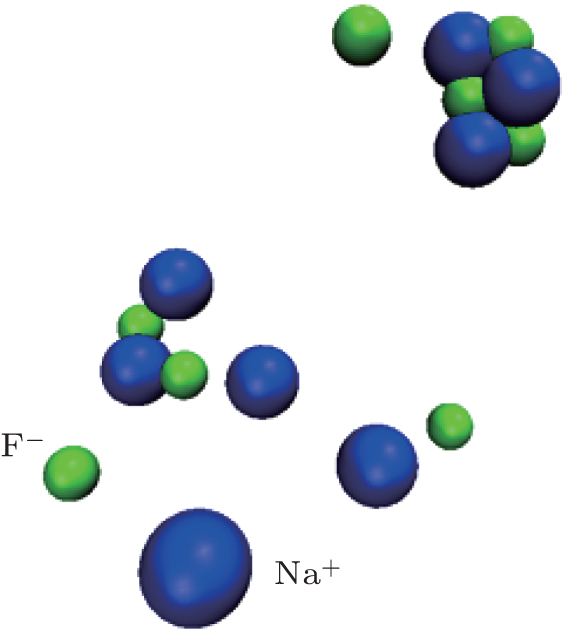 | Fig. 5. Clusters of Na+ and F− in NaF solution at 600 K under 100 atm. The water molecules are ignored for clearity. |
However, the situations are different for the bigger solvents. When the g(r)FF in Fig. 4(b) significantly increases from 2.3 to 4.8 as the temperature increases to 600 K, the cluster formation is hardly seen in the NaI solution. The same results can be found in the NaBr solution that no increase of its RDF peak is found as the temperature increases. It seems that the smaller ions are more likely to cluster together at the phase changing point, suggesting the existence of the solvent precipitation in these solutions.
In summary, we have presented the MD and QM simulations of the pure water under high pressures and temperatures. The QM simulation at ambient condition is consistent with the MD simulation, convinced that the MD simulation method is suitable for a water system at high pressures and temperatures. The corresponding characters of pure water and NaCl solutions are investigated by using radial distribution functions and coordination numbers.
Both adding NaCl and increasing temperature can affect the bulk water structure. However, no further effects to the already weakly bonded water molecules are found by adding different halogen ions. The hydration of the ions are regularly distributed, suggesting the non-dominated role to the change of the bulk water structure.
At the phase changing point, the hydration force of sodium is comparable with that for cluster formation in NaI solution. Therefore, the sodium ions in NaBr or NaI solutions are more easy to be ‘ robbed’ by the water molecules. Meanwhile, the sodium ions in NaF solution are more inclined to be clustered together, suggesting the existence of the solutes precipitation in such conditions. As to the impact of salt to the structure of water at high temperature and pressure, whether there is a synergistic effect is still not concluded, and the detailed mechanisms should be more complicated. Nonetheless, the impact of salt should be limited for the already weakly bonded water molecules at high temperature and pressures. In addition, the force field and the related parameters should be further improved for these extreme conditions in the future.
| 1 |
|
| 2 |
|
| 3 |
|
| 4 |
|
| 5 |
|
| 6 |
|
| 7 |
|
| 8 |
|
| 9 |
|
| 10 |
|
| 11 |
|
| 12 |
|
| 13 |
|
| 14 |
|
| 15 |
|
| 16 |
|
| 17 |
|
| 18 |
|
| 19 |
|
| 20 |
|
| 21 |
|
| 22 |
|
| 23 |
|
| 24 |
|
| 25 |
|
| 26 |
|
| 27 |
|
| 28 |
|
| 29 |
|
| 30 |
|
| 31 |
|
| 32 |
|
| 33 |
|
| 34 |
|
| 35 |
|
| 36 |
|
| 37 |
|
| 38 |
|
| 39 |
|
| 40 |
|
| 41 |
|
| 42 |
|
| 43 |
|
| 44 |
|