In situ calibrating optical tweezers with sinusoidal-wave drag force method*
[Li Dia) , Zhou Jin-Huaa) , Hu Xin-Yaoa) , Zhong Min-Chenga) , Gong Leia) , Wang Zi-Qianga) , Wang Hao-Weia) , Li Yin-Meia), b)  ]
]
]
|
|


†Corresponding author. E-mail: liyinmei@ustc.edu.cn
*Project supported by the National Natural Science Foundation of China (Grant Nos. 11302220, 11374292, and 31100555) and the National Basic Research Program of China (Grant No. 2011CB910402).
We introduce a corrected sinusoidal-wave drag force method (SDFM) into optical tweezers to calibrate the trapping stiffness of the optical trap and conversion factor (CF) of photodetectors. First, the theoretical analysis and experimental result demonstrate that the correction of SDFM is necessary, especially the error of no correction is up to 11.25% for a bead of 5 μm in diameter. Second, the simulation results demonstrate that the SDFM has a better performance in the calibration of optical tweezers than the triangular-wave drag force method (TDFM) and power spectrum density method (PSDM) at the same signal-to-noise ratio or trapping stiffness. Third, in experiments, the experimental standard deviations of calibration of trapping stiffness and CF with the SDFM are about less than 50% of TDFM and PSDM especially at low laser power. Finally, the experiments of stretching DNA verify that the in situ calibration with the SDFM improves the measurement stability and accuracy.
Optical tweezers are widely used in single-molecule biology, [1– 3] cytobiology, [4– 7] microrheology, [8] and chemistry.[9, 10] In these applications, the accurate measurement of the optical force exerted on a trapped bead is vital to quantifying all kinds of microprocesses. The force measurement depends on the calibration of trapping stiffness and the measurement of displacement of the trapped bead. The trapping stiffness of optical tweezers can be calibrated by many methods, such as the drag force method, [11] power spectrum density method (PSDM), [12, 13] escape force method, [14] equipartition method, [15] and step response method.[15] Their advantages and disadvantages have been illuminated very clearly.[15] The displacement of the trapped bead can be measured by a charge-coupled device (CCD) camera. However, to obtain the better spatial and temporary resolutions, it is usually detected by a photodetector. When the displacement is measured by a photodetector, the conversion factor (CF) is a key parameter to convert the voltage signal of the photodetector into the displacement of the trapped bead.[16, 17] There are also many methods to calibrate the CF, such as, tracking the position of the bead that adhered to the coverslip, [17– 19] PSDM, [12] and the triangular-wave drag force method (TDFM).[20]
In single molecule assays, the trapping stiffness and CF should be fast and accurately calibrated in situ. Therefore, some of the previously mentioned methods are not appropriate to calibrate optical tweezers in single molecule assays, such as equipartition method, step response method, and tracking the position of the bead that adhered to the coverslip. Besides, the PSDM can quickly and accurately calibrate trapping stiffness and CF at the same time, but it depends on some parameters including bead size, solution viscosity, and temperature. The TDFM can directly perform the calibration in situ, but the high resolution of calibration depends on a long time of calibration process.
Here, we introduce the sinusoidal-wave drag force method (SDFM) to calibrate optical tweezers, especially for in situ calibration. As far as we know, the SDFM has been used to calibrate the trapping stiffness, [15, 21, 22] to measure the instrument noise, [18] and to be combined with power spectrum density to calibrate optical tweezers.[23] What is more, previous researchers used an optical trap of the sinusoidal-wave oscillation to measure the viscoelasticity of a polymer solution[24] or intra- and extra-cellular.[25] However, it is not clear that the calibration of the trapping stiffness of the SDFM should be corrected and the advantage of the SDFM over other methods with the same experiment condition. Furthermore, the SDFM was rarely used to calibrate CF. Here, we demonstrate that the correction of the SDFM is necessary and the SDFM is more appropriate to accurately calibrate the trapping stiffness and CF than TDFM and PSDM especially for low SNR or weak trapping stiffness or low laser power. Our experiments of stretching ds-DNA can verify that the in situ calibration with the SDFM improves the measurement stability and accuracy.
When the parameters of the optical trap are calibrated by the drag force method, the motion of a trapped bead can be described by the Langevin equation.[26, 27] For simplicity, the one-dimensional Langevin equation is


where x(t) is the displacement of the trapped bead departing from the trap center, m is the mass of the trapped bead, η is the coefficient of viscosity, r is the radius of the trapped bead, v is the velocity of fluid, k is the trapping stiffness, and FBrownian(t) is the stochastic Brownian force.
In the SDFM, the chamber is driven by a piezo-stage which moves with the sinusoidal vibration. Then, the solution in the chamber moves as
 |
where y(t) is the position of the solution, T is the cycle of vibration of the piezo-stage, a is the amplitude of vibration of the piezo-stage, b is the offset factor, and v(t) is the flow velocity of the solution. Substitute Eq. (2) into Eq. (1), the steady-state solution of Eq. (1) can be figured out as
 |
where
 |
 |
Here, ω = 2π /T, 
In addition, according to Eqs. (3) and (4), for 

 |
It can be described as xmax = F0/k, where the maximum viscous resistance is F0 = 12π 2η ra/T. The relationship of k = F0/xmax (uncorrected SDFM) was used to calibrate the trapping stiffness of optical tweezers.[21, 22] However, this approximate method will induce a large error for weak trapping stiffness, trapping a bead of a large size or high frequency vibration of the piezo-stage. According to Eq. (4), the corrected trapping stiffness should be
 |
(corrected SDFM). Since β is bigger than ω in most optical tweezer systems, the trapping stiffness calibrated with the uncorrected SDFM is bigger than that with the corrected SDFM.
According to Eq. (3), the trapped bead would be moved in a sinusoidal form after the first few cycles of vibration of piezo-stage. This sinusoidal movement of the trapped bead can be recorded by a CCD camera and a photodetector simultaneously. Then, the amplitude of each signal (ACCD for the CCD signal and APD for the photodetector signal) can be figured out by fitting the signal with a sinusoidal function. The maximum displacement of the trapped bead departing from trap center is xmax = B = ACCD, and the trapping stiffness can be figured out by Eq. (6) or (7) for the uncorrected SDFM or the corrected SDFM respectively. Finally, the conversion factor can be obtained with the form of CF = ACCD/APD.
The TDFM is also usually used to calibrate trapping stiffness and CF. For TDFM, the maximum displacement of trapped bead is
 |
at the same frequency and amplitude of piezo-stage movement, which could be easily figured out by Eq. (1). Therefore, the xmax in the SDFM is about π /2-fold larger than the TDFM in most optical tweezer systems. With the same experiment conditions, the larger the displacement of the trapped bead is, the higher the accuracy of measurement will be achieved. Moreover, for TDFM, the two positions of equilibrium states of the trapped bead are affected by the motion deviation around the inflection points of triangular-wave motion of the piezo-stage. The trapped bead could not hop from one equilibrium position to another without time owing to flow resistance and damped oscillation. These factors will decrease the calibration accuracy of trapping stiffness and CF. Hence, the corrected SDFM has the higher accuracy for trapping stiffness and CF calibration in optical tweezers compared with TDFM.
To directly demonstrate the advantage of the SDFM, the calibrations of optical tweezers with the SDFM, TDFM, and PSDM were simulated. In simulation, the movement of a trapped bead of 2 μ m in diameter was recorded by CCD (30 fps) and photodetector (1 kHz for the SDFM and TDFM, 20 kHz for PSDM) at the same time, and the length of each signal was ten seconds. For the SDFM, the piezo-stage was moved in a sinusoidal motion of periodicity with a frequency of 2.5 Hz and an amplitude of A. For TDFM, the piezo-stage was moved in a trigonal motion of periodicity with a frequency of 2.5 Hz and five amplitudes, i.e., ATDFM = A, 5A/6, 2A/3, A/2, A/3. For the PSDM, the piezo-stage and optical trap remained still. The different signal-to-noise ratios (SNRs) or trapping stiffnesses were used in simulation to simulate the effects of different experiment conditions, such as environmental noise, electronic noise, laser power, and trapping stiffness. The simulation signals of Brownian motion of a trapped bead were generated by Monte– Carlo simulation.[28] Then the simulation signals of the trapped bead were processed by the respective method to calibrate the trapping stiffness and CF. In the SDFM, the signals of the trapped bead were fitted with sinusoidal functions to obtain the signal amplitudes, i.e., ACCD for the CCD camera signal and APD for the photodetector signal. The trapping stiffness was computed by Eq. (7). The conversion factor was CF = ACCD/APD. In TDFM, distances between two equilibrium positions could be figured out by fitting the histograms of the signal with double Gaussian functions, i.e., DCCD for the CCD camera signal and DPD for the photodetector signal. The trapping stiffness could be calculated with Eq. (8) and fitted linearly of DCCD and ATDFM. The slope of a fitted linearly of DCCD and DPD was CF. In the PSDM, the Brownian motion of the trapped bead was recorded by a photodetector. Then, the power spectrum density of this signal was fitted by a Lorentzian function
 |
where D = kBTtemp/γ 0, fc = k/(2π γ 0), γ 0 = 6π η r, kB is the Boltzmann’ s constant, Ttemp is the environment temperature, and f is the frequency.[12] The trapping stiffness could be figured out by k = fc/(2π γ 0) and the CF is β CF. Finally, the mean square errors (MSEs) of calibration of the trapping stiffness and CF were figured out by comparing the simulation results ten times with the presented values. The mean MSE of each situation was figured out by ten MSEs.
To further verify the differences between the uncorrected SDFM and the corrected SDFM and the calibration accuracy of the SDFM, our optical tweezers were calibrated with the uncorrected SDFM, corrected SDFM, TDFM, and PSDM. Our optical tweezers have been described in Refs. [4] and [5]. They were built on an inverted microscope (Olympus IX71, Japan) using a fiber laser (AFL-1064-40-R-CL, Amonics Limited, Hong Kong) with a wavelength of 1064 nm and a nominal outpower of 10 W. The laser beam was expanded to a diameter of 7 mm to overfill the back-aperture of a water immersion objective with a high NA of 1.2 (UPLSAPO, 60× , Olympus, Japan). The tightly focused beam can trap dielectric beads and cells steadily in a chamber. The chamber was moved by a piezoelectric stage (P-545.3R7, PI, Germany). The displacements of the trapped bead were detected by a CCD camera (Photometrics CoolSNAP HQ2, America) and a photodetector (DL100– 7PCBA3, Pacific Silicon Sensor Inc.) simultaneously. The photodetector was placed at the conjugate plane of the back focal plane of the condenser just like the forward back focal plane (BFP) detection scheme.[16, 29, 30]
In our experiments, the sample was diluted into 1– 2 beads in our field view, and the trapped bead was at a depth of 20 μ m. Our experiments were conducted at room temperature 24 ° C, and the coefficient of viscosity was η = 0.911× 10− 3 N· s· m− 2, which needed to be corrected for the proximity of the bead to the cover glass surface.[21]
Suppose A was an amplitude of piezo-stage movement. In the SDFM, the piezo-stage was moving in a sinusoidal motion with an amplitude of A and the signals of the trapped bead were fitted with sinusoidal functions to obtain the signal amplitudes, i.e., ACCD for the CCD camera signal and APD for the photodetector signal. The trapping stiffness was computed by Eq. (6) for the uncorrected SDFM and Eq. (7) for the corrected SDFM. The conversion factor was CF = ACCD/APD. In TDFM, piezo-stage was moved in a trigonal motion with five amplitudes, i.e., ATDFM = A, 5A/6, 2A/3, A/2, A/3. Then, the distance between two equilibrium positions could be figured out with the signals from the CCD camera (DCCD) and the photodetector (DPD). The trapping stiffness could be calculated with Eq. (8) and fitted linearly of the dependence of DCCD and ATDFM. The slope fitted linearly of DCCD and DPD was CF. For the SDFM and TDFM, the calibration was perform within the linear response range of the detector and the linear region of trapping stiffness. In the PSDM, the piezo-stage and optical trap remained still. The Brownian motion of the trapped bead was recorded by the photodetector. Then, the trapping stiffness and CF could be figured out by fitting the power spectrum density of the signal with Eq. (9).
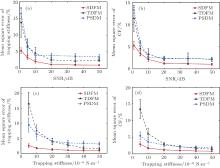
Figure 1 shows the simulation results. Because the high SNR would restrain noise, these methods could get high accuracy with high SNRs. As shown in Figs. 1(a) and 1(b), the MSE of calibration decreases with SNR increasing for all three methods. For all levels of SNRs, the MSEs of the SDFM are much lower than that of TDFM or PSDM. That demonstrates that the SDFM has a higher measurement accuracy and stability at all different SNRs. With the optical stiffness increasing, the MSEs of calibrated stiffness and CF obtained by three methods decrease rapidly as shown in Figs. 1(c) and 1(d). At the same stiffness, the SDFM still performs better compared with TDFM and PSDM. In all cases, the calibration error of trapping stiffness and CF can be as low as 1%, and the error of the SDFM is below 5% even in a harsh experimental environment with a low SNR or weak stiffness. Therefore, the SDFM can calibrate trapping stiffness and CF more accurately.
 | Fig. 1. Simulation results of calibration of trapping stiffness and CF with the SDFM, TDFM, and PSDM. The red solid lines with filled circles are the simulation results of the SDFM, and the black dashed lines with filled triangles are the simulation results of the TDFM, and the blue dash dot lines with empty circles are the simulation results of the PSDM. (a) The calibration accuracy of trapping stiffness versus different SNRs. (b) The calibration accuracy of CF versus different SNRs. (c) The calibration accuracy of CF versus different trapping stiffnesses. (d) The calibration accuracy of CF versus different trapping stiffnesses. |
For five kinds of beads (Thermo scientific, Catalog & Diameter, #4009A, 0.994 ± 0.021 μ m; #4202A, 1.999 ± 0.020 μ m; #4203A, 3.002 ± 0.019 μ m; #4205A, 4.993 ± 0.040 μ m), the trapping stiffness is calibrated with four methods, including the TDFM, PSDM, uncorrected SDFM, and corrected SDFM. In the uncorrected SDFM, corrected SDFM, and TDFM, the frequency of motion of the piezo-stage was 5 Hz. In Table 1, we can find that the results with the corrected SDFM are closer to the calibration results with the TDFM and PSDM than the uncorrected SDFM. The trapping stiffness calibrated with the uncorrected SDFM is larger than the calibration results with the corrected SDFM. Especially, for a bead of 5 μ m in diameter, the error of the mean value is up to 11.25% when the result of the corrected SDFM is regarded as the standard value. The beads of this scale are usually used in experiment.[4, 31] Therefore, the correction of the SDFM is necessary, especially for a bead with a large size.
| Table 1. The trapping stiffnesses of different diameters of bead. |
To demonstrate the advantage of the SDFM over the TDFM and the PSDM, the trapping stiffnesses and CFs were calibrated by the SDFM, TDFM, and PSDM with five different laser powers. The size standard beads (#4202A, 1.999 ± 0.020 μ m) were used in calibration. In the SDFM and TDFM, the amplitude of the piezo-stage (A) was unchanged and the vibrational frequency of the piezo-stage was 2.5 Hz. Therefore, the higher the laser power was, the smaller the displacement of the trapped bead would be. It may reduce the accuracy of calibration at high laser power. For the PSDM, the Brownian movement of the trapped bead was recorded by a photodetector at a frequency of 20 kHz. For each method at a fixed laser power, the trapping stiffnesses and CFs were calibrated with 6 beads. The errors were denoted by standard deviations in percentages. In Table 2, the mean values of trapping stiffness calibrated by these three methods are very close at all different laser powers. The error of calibration with the SDFM is the lowest in these three methods. The error with the TDFM becomes very high with the laser power increasing. The error with the PSDM is high at a low laser power, because the high trapping stiffness can restrain noise. Table 3 demonstrates the calibration results of CF with different laser powers. For the SDFM, the mean values of CF are very stable at all five laser powers and the error of calibration is still the lowest in these three methods. For the TDFM, the error also becomes very high with laser power increasing. For the PSDM, the mean value is unfaithful and the error is a little high at a low laser power.
| Table 2. The trapping stiffnesses of different laser powers. |
| Table 3. The conversion factors of different laser powers. |
Moreover, it is remarkable that the SDFM would spend only about 20% of the time that the TDFM used under the same experimental conditions. The trapping stiffness and CF can be accurately calibrated within just a few seconds for one bead with the SDFM and PSDM. In experiments, the maximum displacement of the trapped bead was less than 0.2-fold of radius. In this range of motion, the change of axial equilibrium position due to the lateral displacement would not affect the calibration accuracy of the drag force method.[32]
Therefore, compared with the TDFM, the SDFM spends much less time, and the calibration results of the SDFM are more stable and have a smaller error. Compared with the PSDM, the calibration results of the SDFM have a better accuracy and stability, especially for a low laser power. Besides, the calibration usually needs to be very rapid for the limit of activity duration of the studied samples especially in biological experiments. Therefore, with the better performance at all different laser powers and the advantage of fast calibration, the SDFM is more suitable for the calibration of optical tweezers in experiments.
In single molecule assays, the rapid calibration is very significant. To illuminate it, the same optical tweezers were used to calibrate the persistence length of a double-stranded DNA molecule (ds-DNA) of 1700 base-pairs in PBS buffer (16 mM Na+ ). In experiment, a ds-DNA tethered two beads with different diameters. The smaller one (carboxyl polystyrene particles, Spherotech, Cat No. CP-30-10, nominal size 3.0– 3.4 μ m) was held in an optical trap and the bigger one (streptavidin coated polystyrene particles, Spherotech, Cat No. SVP-40-5, nominal size 4.0– 4.9 μ m) adhered to the cover glass. When the chamber driven by the piezo-stage moved and the optical trap kept still, the ds-DNA would be stretched. The persistence length of DNA was computed by fitting the experimental force– extension relationship to Marko– Siggia expressions[22]
|
where F is the tension, x is the end-to-end distance of ds-DNA, Lp is the persistence length, L0 is the contour length, kB is the Boltzmann’ s constant, and T is the absolute temperature. The carboxyl coated beads, which were labeled with an anti-digoxigenin antibody by ourselves, were used as handle beads to measure the force– extension relationship of ds-DNA. The average value of CF of this kind of bead is 12603 ± 4207 nm/V (33 beads). This disastrous expected error is up to 33.4 %, which would affect the following experimental results.
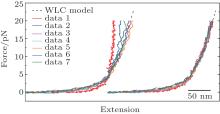
Figure 2 demonstrates the experimental results of the force– extension relationship of the DNA molecule. The trapping stiffness and CF of each bead were calibrated by the SDFM. In the right part of Fig. 2, each curve of force– extension was calibrated with the respective trapping stiffness and CF of each bead. The black dashed line was acquired by fitting the experimental data with a worm-like chain (WLC) model. In the left part of Fig. 2, each curve of force– extension was calibrated with the mean trapping stiffness and CF. In the two cases, it is obvious that the experimental data with respective trapping stiffness and CF of every bead have the better stability and repeatability.
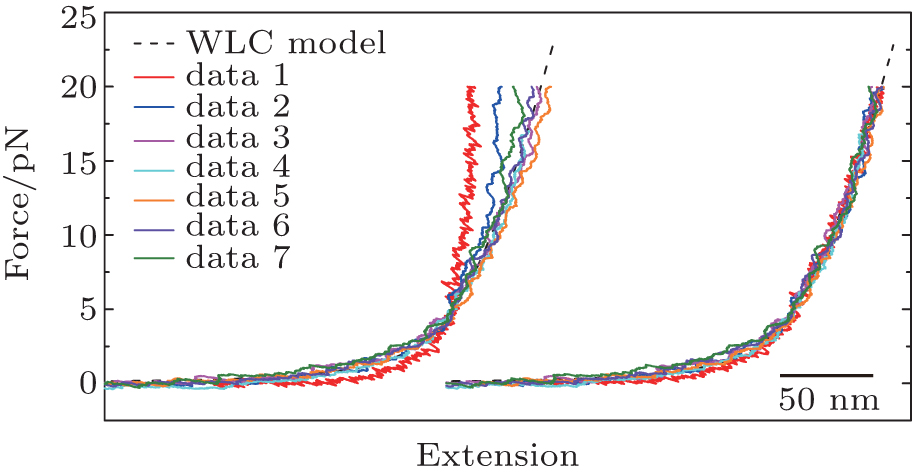 | Fig. 2. The force– extension relationship for a single double-stranded DNA molecule. Left, the colored solid lines are the experimental data of stretching DNA, which is computed with mean trapping stiffness and CF. The black dashed line is the theoretical result of the worm-like chain model. Right, the colored solid lines are the experimental data of stretching DNA, which is computed with the respective trapping stiffness and CF of every bead. The black dashed line is the theoretical result of the worm-like chain model with the same parameters of that in the left. |
To further show the differences between those two cases in Fig. 2, the persistence length of ds-DNA was fitted from force– extension measurements with the WLC model (Eq. (10)). Table 4 shows the persistence length fitted by each curve of force– extension in Fig. 2, in which trapping stiffness and CF were calibrated with each bead or the mean value. The persistence length fitted in the case of the respective CF and respective trapping stiffness is in good agreement with previous findings (10 mM NaHPO4 buffer, pH = 7.0, persistence length 47.4 ± 1.0 nm, [22] and 20 mM NaCl, persistence length 46 ± 5 nm[33]). However, if the mean parameters are used to fit the persistence length, the results are unfaithful and have large errors. In those cases, the effect of CF is dominant. The terrible repeatability of the force– extension relationship in Fig. 2 and the inaccuracy of the persistence length with mean parameters in Table 4 show that the CF and trapping stiffness of every bead need to be calibrated. What is more, the activity duration of the studied samples (usually less than two hours) is generally limited in biological experiments. Therefore, the calibration of trapping stiffness and CF must be very rapid. The SDFM, which spends only a few seconds in calibrating the trapping stiffness and CF of one bead, is suitable to calibrate optical tweezers in these experiments.
| Table 4. The persistence length of ds-DNA. |
In conclusion, the corrected SDFM is introduced in this paper for in situ calibration of trapping stiffness and CF fast and accurately. At first, the theoretical analysis and experiments demonstrate that the correction of the SDFM is necessary, and also verify that the SDFM has better performance in calibration compared with TDFM and PSDM at the same situation. Using the SDFM, the calibration error of the trapping stiffness and CF of the trapped bead can be as low as 1%, and the calibration of the trapping stiffness and CF can be accomplished within just a few seconds for one bead. It can work well even in a harsh experimental environment with a low SNR, weak trapping stiffness or low laser power. Our experiments of stretching ds-DNA show that the SDFM can be used to calibrate optical tweezers in situ and is appropriate to be used in the measurement of single molecule force spectrum. Furthermore, the SDFM can also be used to measure other parameters of optical tweezers, such as the linear response range of the detector. Combined with the power spectrum density analysis, this method can also be adopted to measure bead size with known temperature and coefficient of viscosity.
We are grateful to Dr. Zhong Zhen-Sheng (Nanyang Technological University) for the discussion of data analysis of stretching DNA and Professor Yao Xue-Biao (University of Science and Technology of China) for supplying the basic biochemical devices.
| 1 |
|
| 2 |
|
| 3 |
|
| 4 |
|
| 5 |
|
| 6 |
|
| 7 |
|
| 8 |
|
| 9 |
|
| 10 |
|
| 11 |
|
| 12 |
|
| 13 |
|
| 14 |
|
| 15 |
|
| 16 |
|
| 17 |
|
| 18 |
|
| 19 |
|
| 20 |
|
| 21 |
|
| 22 |
|
| 23 |
|
| 24 |
|
| 25 |
|
| 26 |
|
| 27 |
|
| 28 |
|
| 29 |
|
| 30 |
|
| 31 |
|
| 32 |
|
| 33 |
|