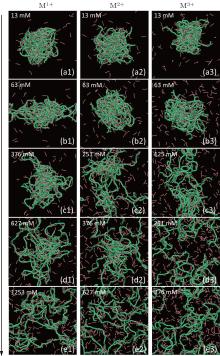
Decondensation behavior of DNA chains induced by multivalent cations at high salt concentrations: Molecular dynamics simulations and experiments*
Jiang Yang-Weia), Ran Shi-Yongb), He Lin-Lib), Wang Xiang-Hongb),c), Zhang Lin-Xia)
Department of Physics, Zhejiang University, Hangzhou 310027, China
Department of Physics, Wenzhou University, Wenzhou 325035, China
Department of Electrical and Electronic Engineering, Wenzhou Vocational and Technical College, Wenzhou 325035, China

Corresponding author. E-mail: wxh@wzvtc.cn

*Project supported by the National Natural Science Foundation of China (Grant No. 31340026), the Natural Science Foundation of Zhejiang Province, China (Grant Nos. Z13F20019 and LQ12E01003), and the Science and Technology Project of Zhejiang Science and Technology Department, China (Grant No. 2014C31147).

Abstract

Using molecular dynamics simulations and atomic force microscopy (AFM), we study the decondensation process of DNA chains induced by multivalent cations at high salt concentrations in the presence of short cationic chains in solutions. The typical simulation conformations of DNA chains with varying salt concentrations for multivalent cations imply that the concentration of salt cations and the valence of multivalent cations have a strong influence on the process of DNA decondensation. The DNA chains are condensed in the absence of salt or at low salt concentrations, and the compacted conformations of DNA chains become loose when a number of cations and anions are added into the solution. It is explicitly demonstrated that cations can overcompensate the bare charge of the DNA chains and weaken the attraction interactions between the DNA chains and short cationic chains at high salt concentrations. The condensation-decondensation transitions of DNA are also experimentally observed in mixing spermidine with λ-phage DNA at different concentrations of NaCl/MgCl2 solutions.

Keyword: 87.15.–v; 36.20.–r; 82.20.Wt; DNA decondensation; salt concentration; multivalent cations; molecular dynamics simulation
1. Introduction

It is well known that living cells naturally master the task of condensing and de-condensing DNA at specific times, such as in cell life cycles making the genetic code available for gene expression, [1] as well as in storing the long DNA structure into a compartment with dimensions on the order of microns.[2] In the gene replication and delivery process, such DNA condensation is an important mechanism for protecting the genetic information from external forces. The details of the mechanism of DNA condensation are helpful to us in understanding how the DNA is organized into chromatin, as well as in the development of gene delivery vehicles.[3, 4]

In the DNA condensation process, DNA undergoes a compact structure in the presence of various agents, such as multivalent cations, [2, 5, 6] alcohol, [7, 8] basic proteins, [9] neutral crowding polymers, [1013] cationic liposomes, and anti-cancer drugs.[14] It is worth noting that the DNA condensation induced by multivalent cations is particularly interesting because the process has many features in common with DNA packaged in vivo.[15] This DNA condensation depends mainly on the valence of the cations. For example, a hexagonal liquid crystalline packaging of DNA has been observed in the presence of polyamines and other multivalent cations.[16] The helix– helix attraction can induce DNA condensation mediated by multivalent ions.[1719] The increase of the salt concentration can strengthen the helix– helix attraction and shorten the stable helix– helix separation distance.[18] Condensation is required for efficient packing and protection of the genome. However, to allow transcription, DNA must be decondensed in part. Therefore, transitions between different degrees of DNA compactization are involved in many biological processes such as transcription, [20] gene silencing, [21] and viral transfection.[22, 23]

Decondensation of DNA is of significant importance in gene therapy or drug delivery. An effective gene therapy or drug delivery means the “ packaging” of DNA by using chemical agents including cationic polymers, multivalent ions, and surfactants, as well as the effective control of DNA release in gene therapy or regulation.[24] Therefore, the release of DNA from DNA/surfactant or DNA/polymer complexes, bearing significant importance as DNA condensation, has also received much attention.[25, 26] Dias et al. reported that anionic surfactants could be utilized to unfold and release DNA molecules previously compacted by cationic surfactants.[27] Studies have shown that the successful decompaction of DNA from the DNA/cationic surfactant complexes is β -cyclodextrin (β -CD) due to the high affinity between β -CD and surfactants.[28] He et al. successfully achieved the decondensation of DNA molecules by introducing triblock copolymer (PEO)20– (PPO)70– (PEO)20 (P123), and it is found that the release of the surfactant from the complex induced by P123 turns DNA conformation from ψ -phase back to B-form.[29]

It is noticed that multivalent cations play an important role in controlling the morphologies of DNA chains in solutions. Muthukumar et al. have determined the electrostatic interactions screening in a salt solution based on the double screening theory for multi-polyelectrolytes.[30, 31] Hsiao et al. have found the salt-induced collapse and re-expansion of highly charged polyelectrolytes.[32] Aninalem et al. have pointed out that the salt concentration has a strong influence on the aggregation structure of DNA/PAMAM dendrimer complexes.[33] As salt concentrations have a strong influence on the phase behaviors of DNA chains in solutions, [34, 35] we will investigate the decondensation behavior of DNA at various concentrations of monovalent, divalent, and trivalent salt cations in the presence of short cationic chains in solutions. Based on the charge distributions around the DNA chains, we provide a possible explanation for the simulation results. In the meantime, similar results are observed experimentally for λ -phage DNA mixing with spermidine in NaCl/MgCl2 solutions. At high salt concentrations, cations can overcompensate the bare charges of the DNA chains and weaken the attraction interactions between the DNA chains and short cationic chains.

2. Computational and experimental methods
2.1. Simulation details

We employ the LAMMPS molecular dynamics package[36] with Langevin dynamics in the NVT ensemble to study the DNA decondensation induced by multivalent cations in the presence of short cationic chains in solutions. Langevin dynamics mimics the viscous aspect of a solvent, accounting for the stochastic effect of solvent and memory effect of friction. The Langevin equation for particle i is followed by

where all particles shared the same mass, m = 1, and U contains the whole energy of the system (U = ULJ + UFENE + Ubending + UCoul), which we will elaborate in the following paragraphs. Here, i(t) and γ are the white noise of the solvent and friction coefficient, which satisfies the fluctuation-dissipation theorem[37]i(t)i(t′ )〉 = 6mγ kBi jδ (tt′ ), where kBT acts as thermal energy. The Coulomb interactions are handled by the particle– particle particle– mesh (PPPM) method[3840] and all the simulation systems are preserved to be of overall charge neutrality. In the simulation, we model the DNA chains by employing the Kratky– Porod worm-like chains, [41, 42] which is widely used in simulations.[43, 44] As a coarse-grained model, we take local stiffness, long-range flexibility, and electronegativity into consideration in the description of the behavior of a DNA molecule. In our coarse-grained model, a DNA chain is made up of N = 200 monomers and each monomer is charged negatively. The number of DNA chains is 10. Meanwhile, each short cationic chain contains 8 monomers, both ends of the cationic short chain are + 3 positively charged, and the number of short cationic chains is 350. At first, DNA chains and short cationic chains are located randomly in a periodic box 100σ × 100σ × 100σ , where σ represents the length unit. Then, various numbers of multivalent cations and monovalent anions are added into the complex, and the concentration of multivalent cations is used to represent the salt concentration, C+ , which varies from 13  mM to 1253  mM, corresponding to the number of cations from 10 to 104. The simulation temperature is fixed at T = 1.0. The friction coefficient and the time step are γ = 1/τ and τ 0 = 0.001τ , respectively, where τ = (mσ 2/ɛ )1/2 is the time unit, in which ɛ acts as Lennard– Jones energy. Each simulation runs for a minimum of 2× 10⁷ steps for the sake of equilibrium.

To prevent overlap between any two monomers, all monomers interact with each other via a purely repulsive truncated and shifted Lennard– Jones potential[45]

where ri j is the distance between the centers of any two monomer centers, σ i j = σ = 1, and ɛ = 1.0kBT, which represent the length scales, as well as the monomer diameter, and Lennard– Jones energy between monomers i and j.

We enforce the connectivity of adjacent monomers on DNA chains via the finite nonlinear extensible elastic (FENE) spring potential[46]

where K refers to the spring constant, ri j is the distance between two adjacent monomers, and l0 works as the limit length of a bond. These parameters are chosen to be K = 30kBT and l0 = 1.5σ , which guarantee the local stiffness.

The bending rigidity of DNA chains is modeled by an angle potential

where ϕ is the angle between two adjacent bond vectors, and Kb is the bending energy constant. Here, Kb = 20kBT is chosen for long-range flexibility.

Multivalent cations may cause localized bending or distortion of the DNA. The Manning’ s counter-ion condensing theory predicted that the DNA condensation occurs in the presence of multivalent cations when about 90% of the negative charge of its backbone is neutralized.[47] Polyamines spermidine, spermine and multivalent cations hexammine cobalt (III) are the most common cations used as condensing agents. Polyamines and spermidine have an orderly morphology, and they are relatively small molecules. Taking spermidine as a reference, we model it as a short cationic chain. The short cationic chains are capped with the positively trivalent charge at both ends. As short cationic chains contain eight monomers, the remaining six monomers are electrically neutral. Moreover, short cationic chains also follow the potential equations  (1)– (3) with ɛ ′ → ɛ , σ ′ → σ , K′ K, , , and θ ϕ . These parameters are chosen to be ɛ ′ = ɛ = 1.0kBT, K′ = K = 30kBT, , and .

In our model, all the charged monomers and ions in the system interact via electrostatic Coulomb interactions

where ɛ 0 is the permittivity of vacuum with relative dielectric constant ɛ r = 2.0, qi and qj are the charges on the two monomers. The reason why we choose a relatively small dielectric constant ɛ r here is that there are the strong electrostatic coulomb interactions between the charged monomers at the relatively small dielectric constants and therefore, it needs few charges in our simulation system. The decrease of dielectric constant means the interaction between the charges, emphasizing the strength of the electrostatic interactions relative to thermal fluctuations. Actually, dielectric constant just defines the energy scale[48] which does not change the relationships between the valences and the concentrations of cations and the degree of DNA decondensation. Technically, if a relatively large dielectric constant such as ɛ r = 10, our simulation system has to consist of many charges such as 5 × 10⁵ and our computer ability restricts such a large simulation system.

2.2. Experimental details

Bacterial λ -phage DNA (0.5  μ g/μ L, 48500 bp) was purchased from New England Biolabs and used without further purification. The conductivity of the water is less than 1 × 10− 6  Ω − 1· cm− 1 after deionization and purification by a Millipore system. Mica was cut into approximately 1  cm− 2 square pieces and the surfaces were freshly cleaved. Spermidine was dissolved in pure water to 1  mM before use. The NaCl solution was prepared with crystal NaCl and pure water, and two concentrations of 200 mM and 2 M are chosen, as well as the MgCl2 solution.

The protocols for sample preparation are as follows. The stock solution of 0.5  μ g/μ L λ -phage DNA was diluted to 2  ng/μ L in the NaCl/MgCl2 solutions at different concentrations. The solvent is 1× TE buffer, which is composed of 10  mM Tris-HCl+ 0.1  mM EDTA, pH  8.0. After 5  min of incubation, 40  μ L 1  mM spermidine was added into 160  μ L DNA solution with different concentrations of NaCl/MgCl2, and the final concentrations of NaCl/MgCl2 are 0 (salt free), 1  mM, 100  mM, 500  mM, and 1  M, respectively. Sample solutions were incubated and gently mechanical shaken at room temperature for 3  min. A 20  μ L liquid of the mixture was deposited onto freshly cleaved mica and incubated for 5  min. Following incubation, 100  μ L Milli-Q water was used to wash the mica surface five times to remove the free and excess molecules. Soon after that, we used a gentle stream of nitrogen gas to dry the mica.

A multi-mode AFM (SPM-960, Shimdzu, Kyoto, Japan) was used to perform the images in tapping-mode. All AFM images shown in this paper were scanned at a size of 2  μ m× 2  μ m with a speed of about 2  Hz. The images were derived from the original data and flattened to improve the contrast grade.

3. Results and discussion
3.1. Simulations of DNA decondensation

Typical conformations of DNA chains at varying salt concentration for monovalent, divalent, and trivalent cations are shown in Fig.  1, and three columns display the DNA decondensation for various salt cations. The first column exhibits the changes of DNA/cationic chain complexes with increasing the concentrations of monovalent cations. In the dilute solution, the salt cation concentrations C+ are below 100  mM, such as 13  mM (Fig.  1(a1)) and 63  mM (Fig.  1(b1)), DNA chains keep the condensation state as the attractive interactions between DNA and cationic chains is strong enough in the complexes, and only a few discrete cationic chains are observed. When C+ increases to C+ = 376  mM (Fig.  1(c1)), the added monovalent cations can weaken the attractive interactions between DNA chains and short cationic chains, which can bring about the conformational changes of the complexes. The condensed DNA becomes loose and more short cationic chains get free of the condensed DNA, which can be regarded as the beginning of the DNA decondensation for monovalent salt cations. Furthermore, the added cations can promote the decondensation of DNA chains, as shown in Fig.  1(d1) of C+ = 627  mM, resulting in more discrete cationic chains. At high salt concentrations, like 1253  mM (Fig.  1(e1)), the electrostatic interactions between the added cations and DNA chains can no longer be ignored. Obviously, the DNA chains stretch and short cationic chains are scattered in the simulation box. For the second column, namely the case of divalent salt cations, the conformations of DNA/cationic chain complexes are almost the same as that of monovalent salt cations at low salt concentrations, such as 13  mM (Fig.  1(a2)) and 63  mM (Fig.  1(b2)). With increasing the salt concentration, the intermediate states of the DNA decondensation process can be clearly observed at the concentrations of C+ = 251  mM (Fig.  1(c2)) and 377  mM (Fig.  1(d2)), and at a high salt concentration of C+ = 627  mM (Fig.  1(e2)), the distributions of short cationic chains and DNA chains become uniform. Compared with the results for monovalent and divalent salt cations, trivalent salt cations greatly accelerate the process of DNA decondensation. The DNA chains are also aggregated at low concentrations with C+ < 125  mM (Fig.  1(c3)). The DNA structure looks loose, and the DNA chains are decondensed partially and completely at the concentrations of C+ = 251  mM (Fig.  1(d3)) and 377  mM (Fig.  1(e3)), respectively. Each DNA chain is shown clearly, and the distributions of short cationic chains and DNA chains are uniform. The DNA chains are decondensed at high salt concentrations, and the valence of salt cations affects the process of DNA decondensation. The higher the valence of salt cation is, the easier the compact DNA chains are decondensed.

Fig.  1. Typical conformations of DNA chains with varying salt concentrations for various cations. From left to right, they are monovalent, divalent, and trivalent cations. Panels (a1)– (e1) correspond to M+ , panels (a2)– (e2) to M2+ , panels (a3)– (e3) to M3 + . The concentrations increase from top to bottom.

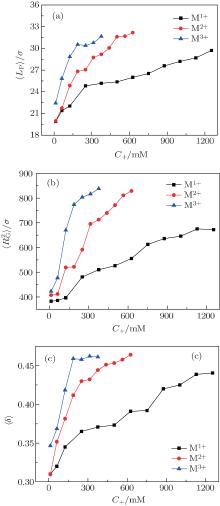
In order to investigate the decondensation processes of DNA chains in more detail, we calculate the average persistence length of DNA chains 〈 LP〉 , the mean-square radius of gyration of DNA chains , and the shape factor of DNA chains 〈 δ 〉 to characterize the statistical properties of DNA chains. In Fig.  2(a), we plot 〈 LP〉 as a function of salt cation concentrations C+ for various multivalent cations. The persistence length is employed to characterize the polymers. It is defined as the average sum of the projections of all bonds ji on bond i in an infinitely long chain.[49] It is given by

where angle θ i is between a vector that is tangent to the polymer at position i and position i − 1, and d represents the length of each monomer of DNA chains. The persistence length of DNA chains is always used to characterize bending stiffness of DNA chains. Here, the values of 〈 LP〉 can also be used to describe the degree of DNA condensation, and three profiles all increase monotonically with increasing salt cation concentrations C+ . However, the slopes of these lines are different and the slope is the largest one for trivalent cations at low concentrations. The fact that the value of 〈 LP〉 increases sharply at low cation concentrations of C+ < 152  mM for trivalent cations shows that the added trivalent cations can accelerate greatly the speed of decondensation for DNA chains at low salt concentrations. Meanwhile, the profile increases slowly at high salt concentrations C+ > 276  mM, which indicates that DNA chains get close to the decondensation equilibrium states. The profiles of divalent salt cations share a similar trend to monovalent ones. The decondensation characteristics of DNA chains can also be confirmed by the mean-square radius of gyration of DNA , as shown in Fig.  2(b). The values of , for divalent and trivalent cations increase sharply at low salt concentrations and slowly at high salt concentrations. However, the value of , for monovalent salt cations increases smoothly with increasing salt cation concentrations. We also introduce shape factor 〈 δ [50, 51] to describe the structure of condensed DNA, followed by

where , , and are three eigenvalues of diagonal matrix of radius of gyration tensor. The shape factor varies from 0 (sphere) to 1 (rod). Therefore, three monotonic increases in the shape factor of DNA 〈 δ 〉 in Fig.  2(c) can also prove that the more the multivalent salt cations are in the solution, the looser the structure of condensed DNA chains is. Moreover, at the same salt concentration region, the higher the valence of salt cation is, the faster the speed of DNA decondensation is.

Fig.  2. (a) Average persistence length of DNA 〈 LP〉 , (b) mean-square radius of gyration of DNA , and (c) the shape factor of DNA 〈 δ 〉 as a function of cation concentrations C+ for various cations.

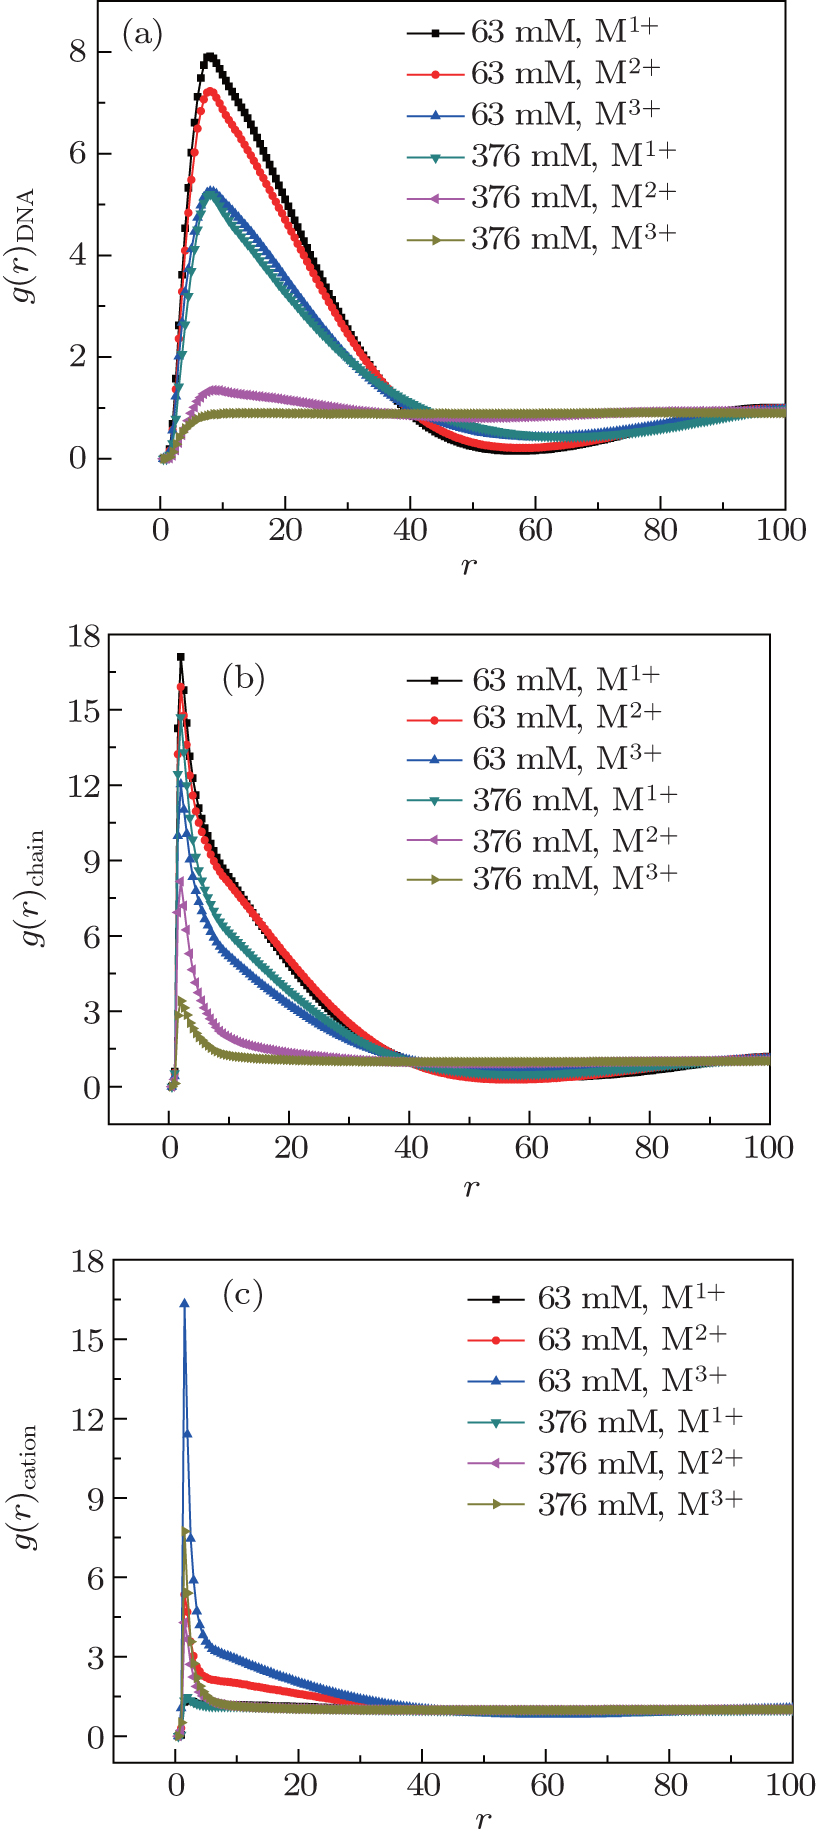
In order to explore the correlation positions between DNA chains and other charged monomers, we calculate the pair correlation functions of DNA– DNA pairs g(r)DNA, DNA– chain (cationic chain) pairs g(r)chain, and DNA– cation pairs g(r)cation for various salt cations, and the results for two cation concentrations of 63  mM and 376  mM are shown in Figs.  3(a)– 3(b), respectively. In Fig.  3(a), we plot the pair correlation function g(r)DNA of the pairs of one DNA monomer and another monomer from other DNA chains as a function of the distance between these two monomers, which can display directly the degree of DNA decondensation. At low cation concentration, there exists a peak for each curve. These peaks are located at r = 8σ , which is close to the length of short cationic chains, and the heights of the peaks are related to the degree of DNA decondensation. As all the DNA chains are charged negatively, there exists the strong repulsive interactions between these DNA chains, and DNA chains do not keep close to each other. DNA chains are aggregated only through adding short cationic chains to the solutions, and the minimum distance between two DNA chains is close to the length of short cationic chains, therefore, all the peaks are located at r = 8σ . The black curve with the highest peak implies that the DNA chains are condensed and the conformations are compact at a concentration of 63  mM for monovalent cations. However, at high cation concentration such as 376  mM, the peaks in the curves disappear completely for trivalent cations and the distribution of DNA chains for trivalent cations is uniform and the decondensation of DNA chains occurs. The pair correlation functions of DNA– chain (cationic chain) pairs g(r)chain can describe directly the distribution of short cationic chains around the DNA chains, and the results are shown in Fig.  3(b). The fact that the sharp peaks are all located at r = 1σ in Fig.  3(b) at low salt concentrations suggests that short cationic chains are connected directly with DNA chains due to the strong attractive electrostatic interactions. At high salt concentrations, the peaks disappear gradually and short cationic chains are away from DNA chains, especially for trivalent cations. As the attractive electrostatic interactions between cationic short chains and DNA chains are weak enough at high salt concentrations, the DNA decondensations take place, especially for trivalent cations. Meanwhile, the peaks in Fig.  3(c) suggest that salt cations are aggregated around DNA chains for high valence cations. When the valence of salt cations increases, the heights of the peaks increase, which is contrary to the results in Figs.  3(a) and 3(b), and this means that the number of short cationic chains around DNA chains increases accordingly. In the meantime, the heights of the peaks decrease when the cation concentrations increase, which are in agreement with the results of salt cations around the dendrimers.[52] In conclusion, the pair correlation functions of DNA– DNA pairs and DNA– cationic pairs confirm directly that cation salt concentrations and cation valence affect the decondensation structures of DNA chains.

Fig.  3. Pair correlation functions of (a) DNA– DNA pairs g(r)DNA, (b) DNA– chain pairs g(r)chain, and (c) DNA– cation pairs g(r)cation for various cations at two cation concentrations of 63  mM and 376  mM, respectively.

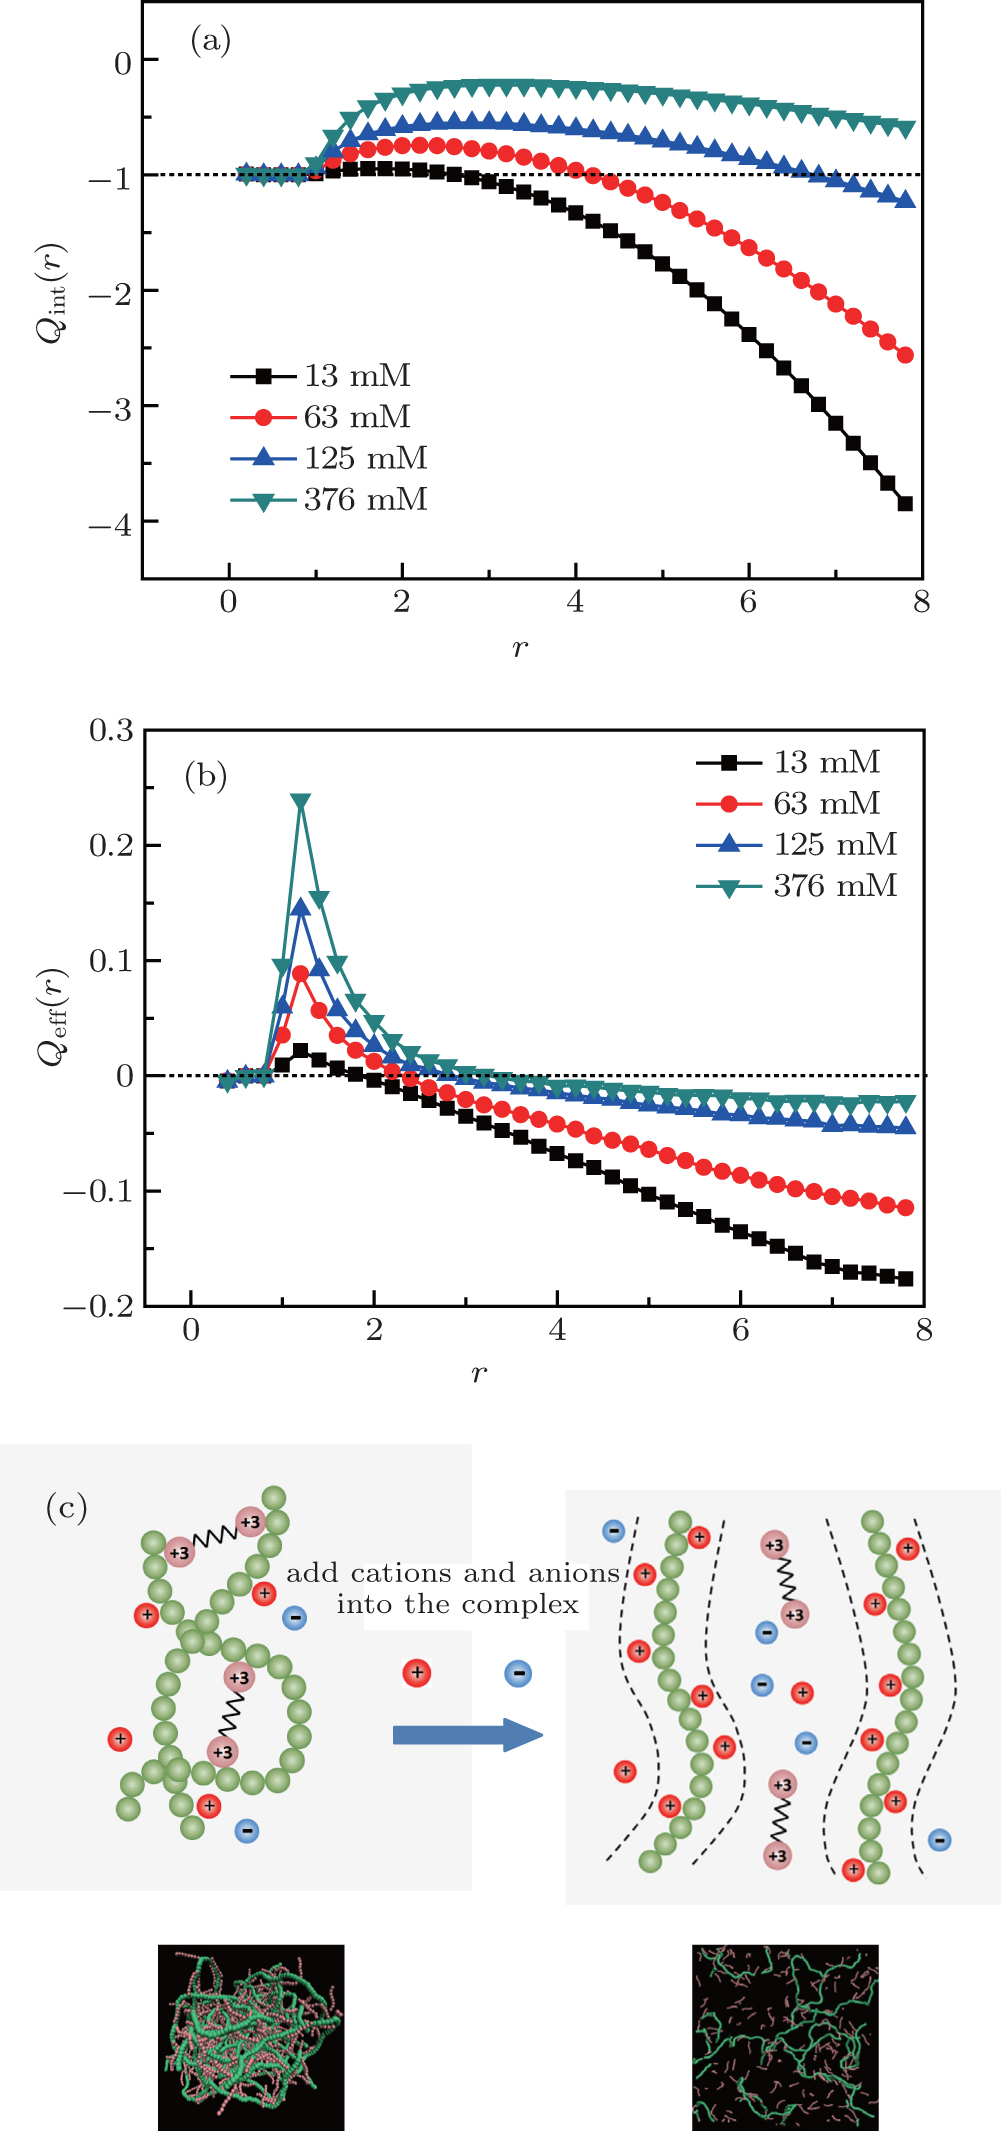
Researchers have attributed the decondensation mechanism to ionic overcompensation[53, 54] or anion incomplete dissociation, [55] in the previous similar studies of decondensation behavior for DNA, [53] single-stranded nucleic acid[54] and single-stranded DNA.[55] Inspired by the three regimes of DNA concentration on monovalent salt concentration proposed by Raspaud el al., [56] we focused on the competition between the cationic chain and added salt ions. Therefore, in order to investigate the reason why the decondensation of DNA chains can occur at high salt concentrations, we calculate the effective charge distributions around DNA chains. We define a wormlike tube around a DNA chain, consisting of N tubes of radius r centered at the bond, and monitor the integrated charge distribution Qint(r) within this tube at various cation concentrations for trivalent cations. The results are shown in Fig.  4(a), and the total charges include the DNA chains, multivalent cations, and anions (counter-ions). The maximum values of Qint(r) increase with increasing the salt cation concentration. At a high salt concentration of C+ = 376  mM for trivalent cations, the integrated charge rises and reaches the maximum at r = 3σ . Although the curve falls down smoothly at this concentration, the values of integrated charges are still larger than − 1.0. This means that there are some net positive charges in the tube around the DNA chains, while at a low salt concentration such as C+ = 13  mM for trivalent cations, the integrated charge Qint(r) rises a little and achieves the maximum at r = 2σ . Then Qint(r) decreases quickly for r > 3.0 and is close to − 4.0 at r = 8.0, which means that there are more counter-ions (anions) in the tube around the DNA chain. In fact, the charges of short cationic chains are not included in calculating the integrated charge distribution Qint(r) because our aim is to calculate the attraction interactions between all the charges near the DNA chains and the short cationic chains. A large negative value of Qint(r) means a strong attractive interaction between short cationic chains and DNA chains because the charges of short cationic chains are not included in calculating the value of Qint(r). As plotted in Fig.  4(b), the local charge density distribution profiles Qeff(r) at various cation concentrations for trivalent cations can represent the charges on a shell whose radius is from r to r + dr (here, dr = 0.2). Obviously, some local regions around DNA are positively charged within 1σ < r < 3σ at high cation concentrations and within 1σ < r < 2σ at low cation concentrations. The height of peaks at high concentration is higher than that at low concentration. Figure  4(c) gives an illustration about the changes of neighboring charges around DNA induced by cations when multivalent cations are added into the complexes. Two insets below are the corresponding simulation snapshots at a low salt concentration (C+ = 13  mM) and a high salt concentration (C+ = 376  mM). When a few cations and anions are added into the complex, the net charges near to DNA chains are negative, see the curve for 13  mM in Fig.  4(b), there exists strong attractive interactions between short cationic chains and DNA chains, and the DNA chains are aggregated through short cationic chains, see the left figure of Fig.  4(c). When the salt concentrations increase, more cations and anions are added into the complexes, some short cationic chains are replaced by some cations. Some cations are located near to DNA chains and some local regions around DNA are positively charged, the attractive interactions between short cationic chains and DNA chains decreases deeply and some short cationic chains are away from the DNA chains. The decondensations of DNA chains take place at high salt concentrations, especially for trivalent cations. The simulation snapshots also show the process of DNA decondensation clearly. It is explicitly demonstrated that cations can overcompensate the bare charge of the DNA chains and weaken the attraction interactions between the DNA chains and short cationic chains at high salt concentrations.

Fig.  4. (a) The integrated charge distribution Qint(r) within a tube of radius r around a DNA, and (b) the local charge density distribution profiles Qeff(r) at various cation concentrations for trivalent cations. (c) The illustration showing that the changes of neighboring charges around DNA chains are induced by cations and anions when multivalent cations are added into the complexes. Two insets below are the corresponding simulation snapshots.

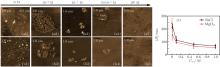
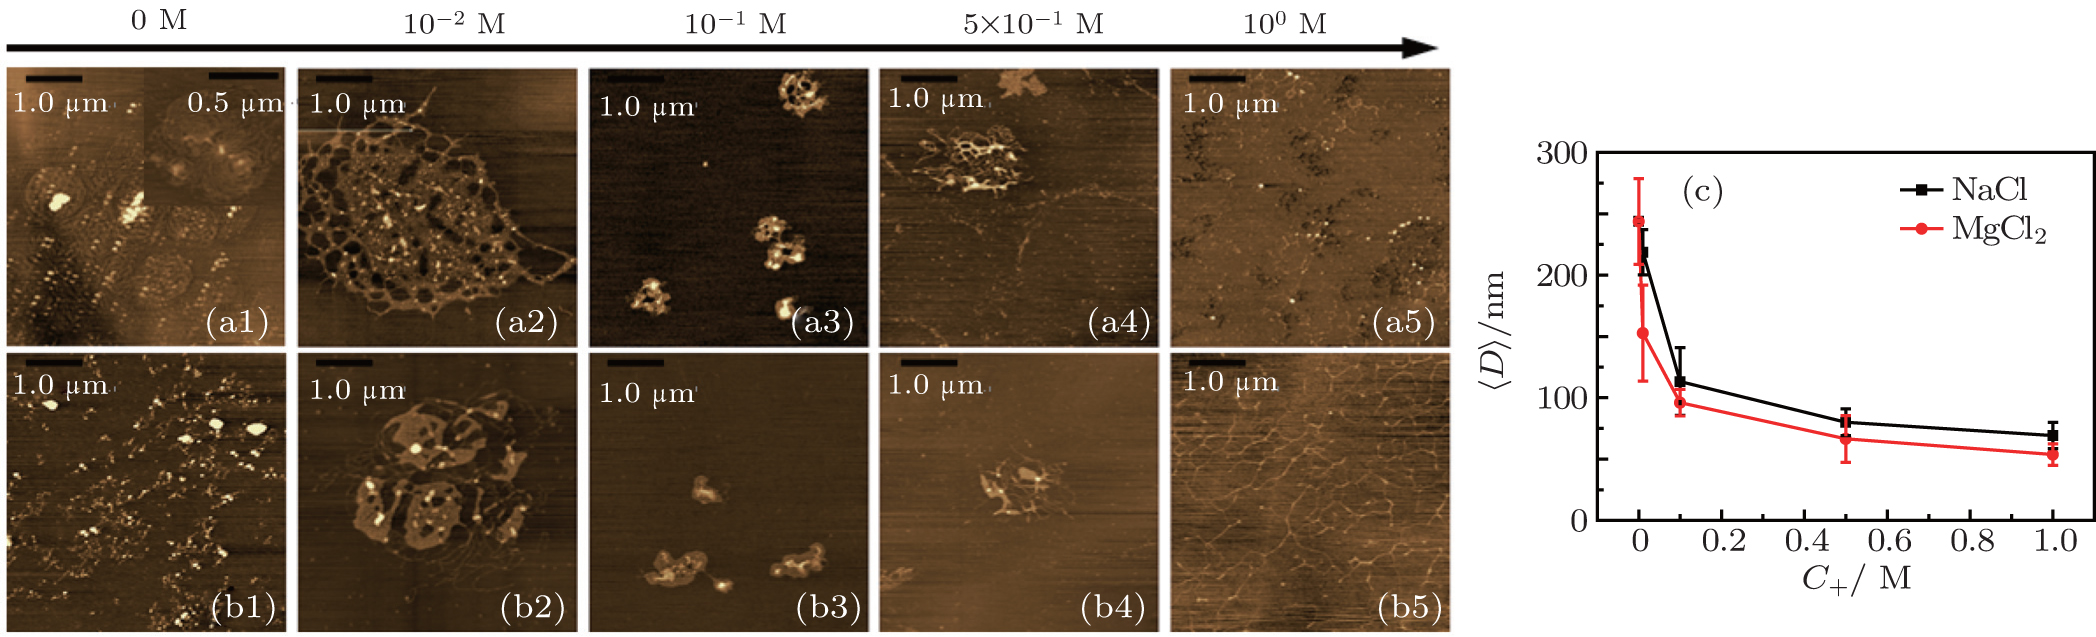
3.2. DNA decondensation in NaCl/MgCl2 solutions

The typical AFM images of DNA– spermidine complexes in different solutions with varying salt concentrations are shown in Fig.  5. The top row refers to the NaCl solution, and the bottom one is in the MgCl2 solution, and the salt concentration increases from 0 to 1  M. In the salt free solution, DNA chains are folded and condensed, as shown in Figs.  5(a1) and 5(b1). A high-resolution inset in Fig.  5(a1) captured from the salt free solution exhibits some details of the condensed structure. The bright cores are circled by layers of DNA segments. Unlike the typical toroidal condensates observed in extremely dilute solution, [57] these disk-like or flower-like condensates are observed, especially in the high-resolution inset, which agree well with the results of Ye et al.[58] and Wang et al.[59] As the luminance of AFM images can represent the height of DNA condensates, the white spots in the images are the precipitations of condensed DNA. In the NaCl solution, the white spots are broken a little into smaller ones and the condensed DNA chains are still kept as a whole when the salt concentration increases to 10− 2  M, as shown in Fig.  5(a2). However, when the concentration increases further by one order of magnitude, the condensed DNA chains are broken into some small clusters as shown in Fig.  5(a3), and these clusters go on dividing into smaller ones and parts of the single DNA chain could be observed from the AFM images (see Fig.  5(a4)) when the NaCl concentrations keep increasing. In Fig.  5(a5), in which the salt concentration increases to 1  M/L, we can observe that most of the DNA chains are distinguished with few extremely small white spots and the DNA chains are decondensated completely. The changes of the second row follow the trend of the first one. Compared with the morphologies of DNA chains in NaCl solution, the decondensation behaviors of DNA chains in MgCl2 solution also occur at high concentration. However, it is an obvious difference that when the MgCl2 concentration increases to 1  M, the DNA chains are distributed more homogeneously and each DNA chain is observed more clearly by comparison with the DNA chains at the same concentration in NaCl solution, as shown in Fig.  5(b5). A similar transition of single DNA molecules was reported by Andreia et al., [26] in which an isolated DNA chain was observed, and from the AFM images obtained by other studies, we found DNA chains extending through the mica. However, they achieved that by altering the size of cations[60] or increasing the Zn2+ concentration.[61] In order to know the conformational differences of DNA chains between two solutions at the same concentration, we monitor the mean diameter of DNA condensations at varying salt concentrations in NaCl and MgCl2 solutions, as shown in Fig.  5(b), which can be roughly measured through the plotting scale and the spots in AFM images. The mean diameter of the condensed DNA is related to the degree of DNA decondensation. Two curves start at the same point and decrease with increasing the salt concentration. Compared with the profile of 〈 D〉 in NaCl solution, the curve of 〈 D〉 in MgCl2 solution falls fast at low concentrations. At high concentrations, two profiles tend to be consistent. It is obvious that the average diameter of the DNA condensation in NaCl solution is always larger than that in MgCl2 solution, and the DNA decondensations occur more easily in MgCl2 solution than in NaCl solution, which qualitatively agrees well with our simulation. In a word, the decondensations of DNA chains in DNA– spermidine complexes can be induced by multivalent cations such as Na+ or Mg2+ , and the degree of DNA decondensations depends on the salt cation concentration as well as the valence of cations. The higher the concentration is, the more obvious the DNA decondensation is, and the higher the valence of salt multivalent cations is, the easier the DNA decondensation occurs.

Fig.  5. Typical images showing the conformations of DNA– spermidine complexes in different solutions with varying salt concentrations. Panels (a1)– (a5) correspond to the NaCl solution, and panels  (b1)– (b5) are in the MgCl2 solution. From left to right, the concentrations increase from 0 to 1  M. (c) The mean diameter 〈 D〉 of DNA condensates as a function of salt concentrations in NaCl and MgCl2 solutions.

4. Conclusions

The process of DNA decondensation induced by multivalent cations is investigated using molecule dynamics. The typical conformations of DNA chains with varying salt concentrations for multivalent cations imply that the concentration of salt cations and the valence of multivalent cations have a strong influence on the behaviors of DNA decondensation. The behavior of DNA decondensation occurs easier at high salt concentrations, especially for the trivalent cations. The further study of the pair correlation functions and charge distributions around DNA chains reveals that the short cationic chains are replaced by the added cations near to the DNA chains and the cations can overcompensate the bare charge of the DNA chains and weaken the attraction interactions between the DNA chains and short cationic chains at high salt concentrations. The experiments about λ -phage DNA chains mixed with spermidine at varying concentrations of NaCl/MgCl2 solutions show that the behaviors of DNA decondensations also occur at high salt concentrations in NaCl/MgCl2 solutions. The AFM images of morphologies of DNA/spermidine complexes illustrate the aggregated DNA chains are decondensated gradually when the salt concentrations increase from 0  mM to 1  M as well as the DNA decondensation behavior occurring easier in MgCl2 solution than in NaCl solution. This investigation can help us understand biological phenomena and applications such as gene delivery.

Reference
1 Jenuwein T and Allis C D 2001 Science 293 1074 DOI:10.1126/science.1063127 [Cited within:1]
2 Bloomfield V A 1996 Curr. Opin. Struct. Biol. 6 334 DOI:10.1016/S0959-440X(96)80052-2 [Cited within:2]
3 Montigny W J, Houchens C R, Illenye S, Gilbert J, Coonrod E, Chang Y C and Heintz N H 2001 Nucleic Acids Res. 29 1982 DOI:10.1093/nar/29.9.1982 [Cited within:1]
4 Blessing T, Remy J S and Behr J P 1998 Proc. Natl. Acad. Sci. USA 95 1427 DOI:10.1073/pnas.95.4.1427 [Cited within:1]
5 Chai A, Ran S, Zhang D, Jiang Y, Yang G and Zhang L 2013 Chin. Phys. B 22 098701 DOI:10.1088/1674-1056/22/9/098701 [Cited within:1]
6 Ou Z and Muthukumar M 2005 J. Chem. Phys. 123 074905 DOI:10.1063/1.1940054 [Cited within:1]
7 Wang Y, Ran S, Man B Y and Yang G C 2011 Soft Matter 7 4425 DOI:10.1039/c0sm01251c [Cited within:1]
8 Kleideiter G and Nordmeier E 1999 Polymer 40 4013 DOI:10.1016/S0032-3861(98)00643-0 [Cited within:1]
9 Kundu T K and Rao M R S 1995 Biochemistry 34 5143 DOI:10.1021/bi00015a027 [Cited within:1]
10 Lerman L S 1971 >Proc. Natl. Acad. Sci. USA 68 1886 DOI:10.1073/pnas.68.8.1886 [Cited within:1]
11 Vasilevskaya V V, Khokhlov A R, Matsuzawa Y and Yoshikawa K 1995 J. Chem. Phys. 102 6595 DOI:10.1063/1.469375 [Cited within:1]
12 Yang Z, Zhang D, Zhang L, Chen H and Liang H 2011 Soft Matter 7 6836 DOI:10.1039/c1sm05523b [Cited within:1]
13 Dai F, Wang P, Wang Y, Tang L, Yang J, Liu W, Li H and Wang G 2008 Polymer 49 5322 DOI:10.1016/j.polymer.2008.09.060 [Cited within:1]
14 Hou X, Zhang X, Wei K, Ji C, Dou S, Wang W, Li M and Wang P 2009 Nucleic Acids Res. 37 1400 DOI:10.1093/nar/gkn933 [Cited within:1]
15 Widom J and Baldwin R L 1980 J. Mol. Biol. 144 431 DOI:10.1016/0022-2836(80)90330-7 [Cited within:1]
16 Saminathan M, Thomas T, Shirahata A, Pillai C K S and Thomas T J 2002 Nucleic Acids Res. 30 3722 DOI:10.1093/nar/gkf503 [Cited within:1]
17 Rau D C and Parsegian V A 1992 Biophys. J. 61 246 DOI:10.1016/S0006-3495(92)81831-3 [Cited within:1]
18 Tan Z and Chen S 2006 Biophys. J. 91 518 DOI:10.1529/biophysj.106.084285 [Cited within:1]
19 DeRouchey J, Parsegian V A and Rau D C 2010 Biophys. J. 99 2608 DOI:10.1016/j.bpj.2010.08.028 [Cited within:1]
20 Armstrong J A and Emerson B M 1998 Curr. Opin. Genet. & Develop. 8 165 DOI:10.1016/j.gde.2015.06.008 [Cited within:1]
21 Zlatanova J, Leuba S H and van Holde K 1998 Biophys. J. 74 2554 DOI:10.1016/S0006-3495(98)77963-9 [Cited within:1]
22 Zimmerman S B and Murphy L D 1996 FEBS Lett. 390 245 DOI:10.1016/0014-5793(96)00725-9 [Cited within:1]
23 Sun M, Louie D and Serwer P 1999 Biophys. J. 77 1627 DOI:10.1016/S0006-3495(99)77011-6 [Cited within:1]
24 Tian W and Ma Y 2013 Chem. Soc. Rev. 42 705 DOI:10.1039/c2cs35306g [Cited within:1]
25 Carlstedt J, Gonzalez-Perez A, Alatorre-Meda M, Dias R S and Lindman B 2010 Int. J. Biol. Macromol. 46 153 DOI:10.1016/j.ijbiomac.2009.12.002 [Cited within:1]
26 Jorge A F, Dias R S and Paris A A C C 2012 Biomacromolecules 13 3151 DOI:10.1021/bm300934p [Cited within:2]
27 Dias R S, Lindman B and Miguel M G 2002 J. Phys. Chem. B 106 12608 DOI:10.1021/jp020392r [Cited within:1]
28 Gonzalea-Perez A, Dias R S, Nyland er T and Lindman B 2008 Biomacromolecules 9 772 DOI:10.1021/bm7012907 [Cited within:1]
29 He Y, Xu S, Sun D, Shang Y Z, Zhao X and Liu H 2013 Colloid Polym. Sci. 291 2139 DOI:10.1007/s00396-013-2954-5 [Cited within:1]
30 Muthukumar M 1996 J. Chem. Phys. 105 5183 DOI:10.1063/1.472362 [Cited within:1]
31 Liu S, Ghosh K and Muthukumar M 2003 J. Chem. Phys. 119 1813 DOI:10.1063/1.1580109 [Cited within:1]
32 Hsiao P Y and Luijten E 2006 Phys. Rev. Lett. 97 148301 DOI:10.1103/PhysRevLett.97.148301 [Cited within:1]
33 Ainalem M L and Nyland er T 2011 Soft Matter 7 4577 DOI:10.1039/c0sm01171a [Cited within:1]
34 Jiang Y, Zhang D, Zhang Y, Deng Z and Zhang L 2014 J. Chem. Phys. 140 204912 DOI:10.1063/1.4878508 [Cited within:1]
35 Chai A, Jiang Y, Zhang Y Y, He L, Zhang D and Zhang L 2014 Soft Matter 10 4875 DOI:10.1039/C4SM00652F [Cited within:1]
36 Plimption S 1995 J. Chem. Phys. 117 1 DOI:10.1006/jcph.1995.1039 [Cited within:1]
37 Kubo R 1966 Rep. Prog. Phys. 29 255 DOI:10.1088/0034-4885/29/1/306 [Cited within:1]
38 Deserno M and Holm C 1998 J. Chem. Phys. 109 7678 DOI:10.1063/1.477414 [Cited within:1]
39 Deserno M and Holm C 1998 J. Chem. Phys. 109 7694 DOI:10.1063/1.477415 [Cited within:1]
40 Eastwood J W, Hockney R W and Lawrence D N 1980 Comput. Phys. Commun. 19 215 DOI:10.1016/0010-4655(80)90052-1 [Cited within:1]
41 Porod G 1949 Monatsh. Chem. 80 251 DOI:10.1007/BF00906469 [Cited within:1]
42 Kratky O and Porod G 1949 Rec. Trav. Chim. Pays-Bas. 68 1106 DOI:10.1002/recl.19490681203 [Cited within:1]
43 Li D, Banon S and Biswal S L 2010 Soft Matter 6 4197 DOI:10.1039/c0sm00159g [Cited within:1]
44 Koslover E F and Spakowitz A J 2009 Phys. Rev. Lett. 102 178102 DOI:10.1103/PhysRevLett.102.178102 [Cited within:1]
45 Lennard-Jones J E 1924 Proc. R. Soc. Lond. A 106 463 DOI:10.1098/rspa.1924.0082 [Cited within:1]
46 Grest G S and Kremer K 1986 Phys. Rev. A 33 3628 DOI:10.1103/PhysRevA.33.3628 [Cited within:1]
47 Manning G 1969 J. Chem. Phys. 51 924 DOI:10.1063/1.1672157 [Cited within:1]
48 Lee N and Thirumalai N 2001 Macromolecules 34 3446 DOI:10.1021/ma001604q [Cited within:1]
49 Doi M and Edwards S F 1986 The Theory of Polymer Dynamics Oxford Oxford University Pressp.  317 [Cited within:1]
50 Solc K and Stockmayer W H 1971 J. Chem. Phys. 54 2756 DOI:10.1063/1.1675241 [Cited within:1]
51 Solc K 1971 J. Chem. Phys. 55 335 DOI:10.1063/1.1675527 [Cited within:1]
52 Tian W and Ma Y 2009 J. Phys. Chem. B 113 13161 DOI:10.1021/jp906449g [Cited within:1]
53 Nguyen T T, Rouzina I and Shklovskii B I 2000 J. Chem. Phys. 112 2562 DOI:10.1063/1.480819 [Cited within:2]
54 Wang F, Wu Y and Tan Z 2013 Biopolymers 99 370 DOI:10.1002/bip.22189 [Cited within:2]
55 Yang J and Rau D C 2005 Biophys. J. 89 1932 DOI:10.1529/biophysj.105.065060 [Cited within:2]
56 Raspaud E, de la Cruz M O, Sikorav J L and Livolant F 1988 Biophys. J. 74 381 [Cited within:1]
57 Lin Z, Wang C, Feng X, Liu M, Li J and Bai C 1998 Nucl. Acids Res. 26 3228 DOI:10.1093/nar/26.13.3228 [Cited within:1]
58 Fang Y and Hoh J H 1998 J. Am. Chem. Soc. 120 8903 DOI:10.1021/ja981332v [Cited within:1]
59 Wang Y, Ran S, Man B and Yang G 2011 Colloids and Surf. B: Biointerfaces 83 61 DOI:10.1016/j.colsurfb.2010.10.040 [Cited within:1]
60 Hansma H G and Laney D E 1996 Biophys. J. 70 1933 DOI:10.1016/S0006-3495(96)79757-6 [Cited within:1]
61 Thomson N H, Kasas K, Smith B, Hansma H G and Hansma P K 1996 Langmuir 12 5905 DOI:10.1021/la960497j [Cited within:1]