
Excellent ethanol sensing properties based on Er2O3-Fe2O3 nanotubes*
[Liu Chang-Baia)  , He Ying
b) , Wang Sheng-Leia) ]
, He Ying|
|


†Corresponding author. E-mail: liwei99@jlu.edu.cn
*Project supported by Jilin Provincial Science and Technology Department, China (Grant No. 20140204027GX) and the Challenge Cup for College Students, China (Grant No. 450060497053).
In this work, pure α-Fe2O3 and Er2O3-Fe2O3 nanotubes were synthesized by a simple single-capillary electrospinning technology followed by calcination treatment. The morphologies and crystal structures of the as-prepared samples were characterized by scanning electron microscopy and x-ray diffraction, respectively. The gas-sensing properties of the as-prepared samples have been researched, and the result shows that the Er2O3-Fe2O3 nanotubes exhibit much better sensitivity to ethanol. The response value of Er2O3-Fe2O3 nanotubes to 10 ppm ethanol is 21 at the operating temperature 240°, which is 14 times larger than that of pure α-Fe2O3 nanotubes (response value is 1.5). The ethanol sensing properties of α-Fe2O3 nanotubes are remarkably enhanced by doping Er, and the lowest detection limit of Er2O3-Fe2O3 nanotubes is 300 ppb, to which the response value is about 2. The response and recovery times are about 4 s and 70 s to 10 ppm ethanol, respectively. In addition, the Er2O3-Fe2O3 nanotubes possess good selectivity and long-term stability.
Semiconductor oxides have been widely studied, due to their applications in lithium storage, [1, 2] photosensitization, [3, 4] and gas sensors.[5– 7] In particular, in the fields of gas sensors, the semiconductor oxides play an important role. It is necessary to detect the inflammable, explosive and toxic gases in our daily lives to maintain safety, such as hydrogen, [8] carbonic oxide, [9] and ethanol.[10] Ethanol is an important gas which is widely used in our lives, such as in the fields of industry, medicophysics, and food production. In addition, ethanol is an inflammable, explosive, and toxic gas. Therefore, it is necessary to make an ethanol gas sensor to monitor it in order to avoid danger. In recent years, various kinds of semiconductor oxide ethanol sensors have been made, such as ZnO, [11] SnO2, [12] In2O3, [13] and Fe2O3[14] sensors. However, the present works have demonstrated that there are some disadvantages of pure semiconductor oxides for using in gas sensors, such as low sensibility and poor selectivity. Therefore, many works have been done to solve these problems. At present, the most simple and effective way is doping other elements. The gas-sensing properties of electrospun In2O3 nanotubes are improved by doping Mg.[15] Doping Sr will enhance discriminative ability from acetone of SnO2 nanofibers ethanol chemiresistor.[16]
Among the common semiconductor oxides, hematite (α -Fe2O3) has been attracting more and more attention in recent years, due to the fact that it is a stable, low-cost, nontoxic, and easy available compound, which is profitable in gas sensors. In recent years, various one-dimensional (1D) α -Fe2O3 nanostructures have been synthesized for gas sensors, such as nanoparticles, [17] nanobelts, [18] nanorods, [19] and nanotubes.[20] Many works have proved that the exposure of the inner/outer surfaces of nanotubes will provide larger reactive sites, which is beneficial to gas sensing.[21, 22] However, pure α -Fe2O3 shows poor sensibility. Thus, many efforts have been done to improve the sensibility of pure α -Fe2O3 and the most simple and efficient way is doping. Cu is used as the dopant for improving the gas sensing properties of α -Fe2O3 hierarchical microcubes.[23] Au/α -Fe2O3 shows much better sensitive to acetone than α -Fe2O3.[24] Rare earth elements have been extensively studied over the past decades due to their particular characteristics.[25, 26] The gas-sensing properties of materials have been enhanced by the mean of doping rare earth elements which is proved by the previous works.[27– 30] Hence, as one of the rare earth elements, Er is used for enhancing the gas sensing properties of materials.[31, 32] However, there are few works to study the effect on the sensing properties of α -Fe2O3 nanotubes by doping Er. In this paper, pure α -Fe2O3 and Er2O3-Fe2O3 nanotubes are successfully synthesized via the single nozzle electrospinning and calcination method. The results of the sensing research show that the ethanol sensing properties of pure α -Fe2O3 nanotubes is enhanced remarkably by doping Er. Moreover, the Er2O3-Fe2O3 nanotube sensors show a fast response time, good selectivity, and long-term stability.
All the chemistry reagents were analytical grade and used without further purification. Poly (vinyl pyrrolidone) (PVP, Mw= 1300000) was obtained from Sigma-Aldrich (USA). Fe(NO3)3· 9H2O (99.99%), Er(NO3)3· 6H2O (99.99%), N, N-dimethylformamide (DMF, ≥ 99.5%) and ethanol (≥ 99.7%) were purchased from Aladdin (China).
At first, 0.55-g PVP was mixed with 5.9-g ethanol. Meanwhile, 1.9-g DMF was mixed with 0.49-g Fe(NO3)3· 9H2O and an amount of Er(NO3)3· 6H2O (in a weight ratio of 0%, 1 wt%, 3 wt%, and 5 wt%). Then, the two mixtures were stirred for 1 h. At last, the two mixtures were mixed and stirred for 12 h. Then, the precursor solution was prepared. The precursor solution was jetted from a single stainless steel capillary. The non-woven mats collector was about 20 cm away from the capillary, and the voltage value was 13 kV. Subsequently, the collected composite fibers were calcined at 550 ° C for 4 h with the heating rate of 15 ° C/min and natural cooling to obtain the pure α -Fe2O3 and Er2O3-Fe2O3 nanotubes.
The process of gas sensor fabrication is described in the previous work.[33] In detail, an amount of deionized water was mixed with the samples to form slurry. Subsequently, a ceramic tube was coated with the slurry on which there is a pair of gold electrodes. A spring-like Ni– Cr was used to provide operating temperature which was plugged into the ceramic tube. The gas sensors need to be dried for three days before the first measurement. The sensor response (S = Ra/Rg) was defined as the ratio of the sensor resistances in the air (Ra) and in the target gas (Rg). The time taken by the sensor to achieve 90% of the resistance variation was response time, and when the sensor was opened to the air the time taken to return 90% of the resistance variation was recovery time.
The XRD-6000 x-ray diffractometer (XRD, SHIMADZU, Japan) with Cu Kα 1 radiation (λ = 1.5406 Å ) was employed to analyze structure characterization. Scanning electron microscope (SEM) images were performed on an FEI XL30 instrument with an energy-dispersive spectrometer (EDS). The sensing properties of the sensor were measured by a CGS-8 intelligent gas-sensing analysis system (Beijing Elite Tech Co., Ltd., China).
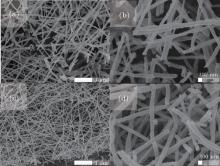
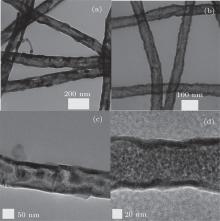
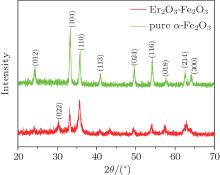
The nanostructures of the pure α -Fe2O3 and 3 wt% Er2O3-Fe2O3 were investigated by SEM and are shown in Fig. 1. It can be seen that the pure α -Fe2O3 materials possess the nanotube structure with an average diameter of about 80 nm from Figs. 1(a) and 1(b), and the nanostructure and diameter are basically unchanged after doping Er which is evidenced in Figs. 1(c) and 1(d). TEM images of pure α -Fe2O3 nanotubes and 3 wt% Er2O3-Fe2O3 nanotubes are shown in Fig. 2 to further investigate the nanostructures. The TEM images indicate that both samples possess nanotube structures. The average grain sizes are about 35 nm for pure Fe2O3 and 7 nm for 3 wt% Er2O3-Fe2O3. The grain size becomes much smaller after doping Er. The typical XRD patterns of pure α -Fe2O3 and 3 wt% Er2O3-Fe2O3 nanotubes calcined at 550 ° C are displayed in Fig. 3. All the diffraction peaks of pure α -Fe2O3 nanotubes are well matched to hematite (JCPDS: 79-1741). No other peaks are observed. The peaks changed slightly and a weak peak of Er2O3 is observed due to the small amount of dopant. The main peaks can be indexed to the hexagonal crystal Fe2O3. The lattice constants are a = 5.034 Å and c = 13.746 Å . Debye– Scherrer formula

is introduced to calculate the grain size according to the peaks (110) and (214), where D is the grain size, K is a constant (0.89), λ is the x-ray wavelength (0.15406 nm), and β is the full width at half-maximum of the 2θ diffraction peak. The average grain sizes are about 36.7 nm for pure α -Fe2O3 and 9.1 nm for 3 wt% Er2O3-Fe2O3, respectively. These values well matched the results of TEM. As we know, the smaller grain size is beneficial to the gas sensing properties of materials.[17]
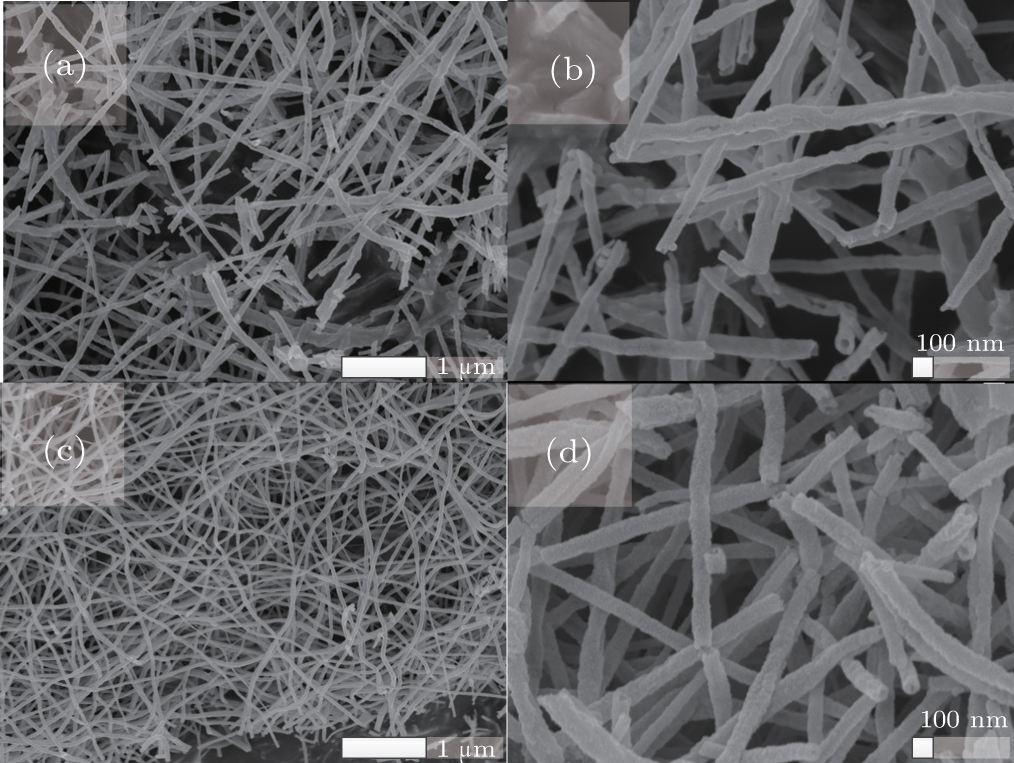 | Fig. 1. SEM images of pure α -Fe2O3 ((a) and (b)) and 3 wt% Er2O3-Fe2O3 nanotubes ((c) and (d)). |
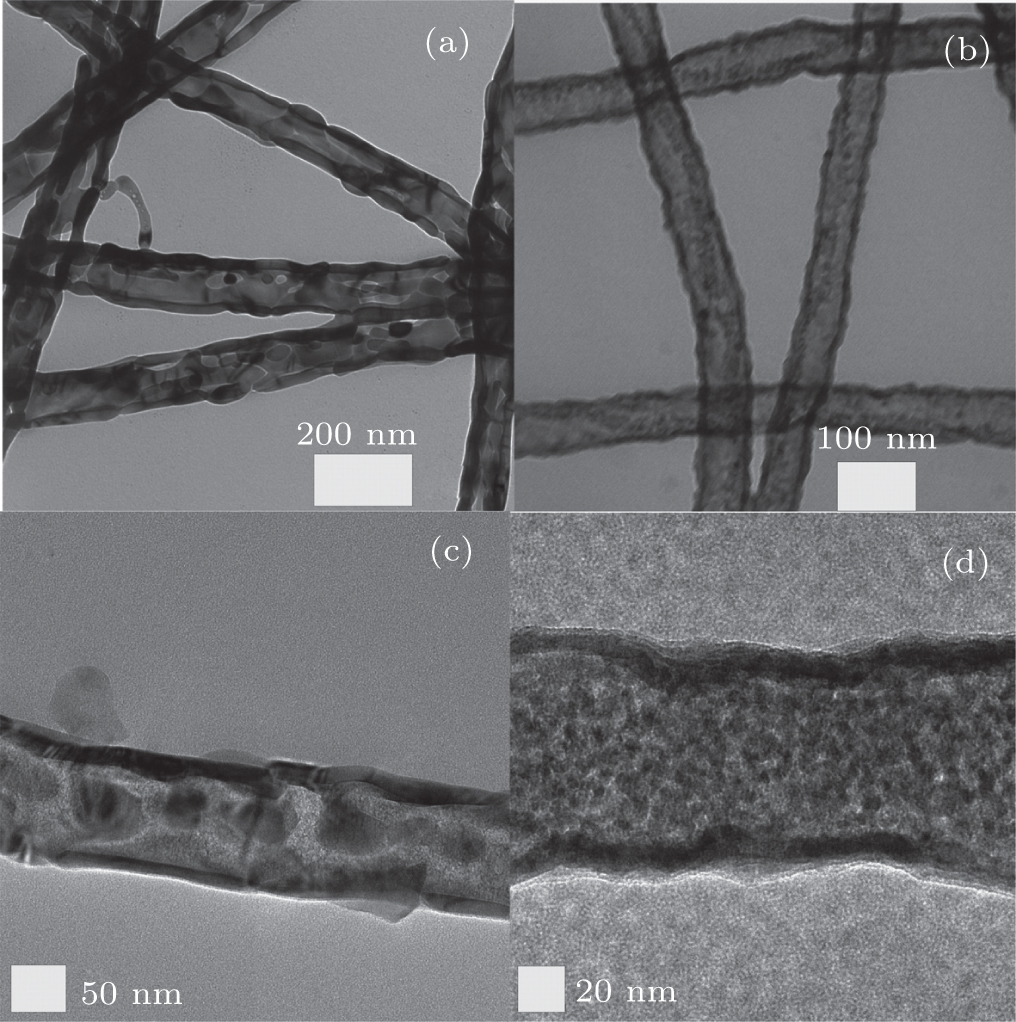 | Fig. 2. TEM images of pure α -Fe2O3 nanotubes ((a) and (c)) and 3 wt% Er2O3-Fe2O3 nanotubes ((b) and (d)). |
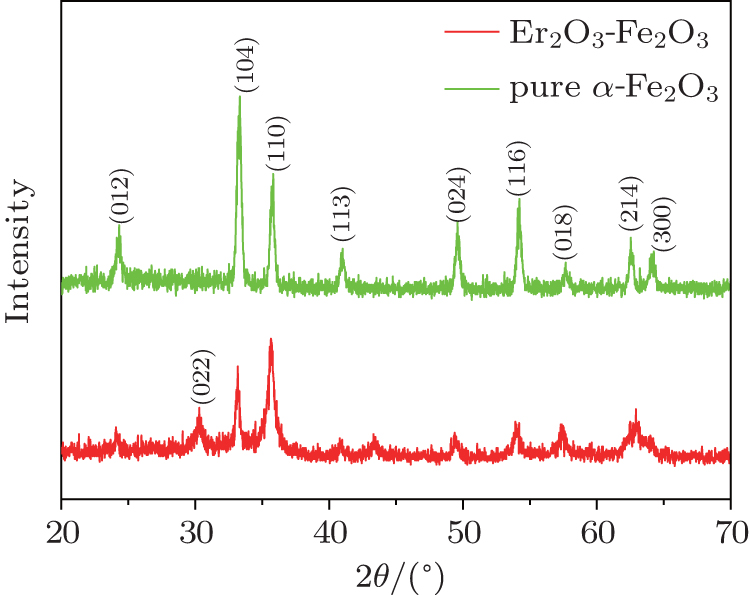 | Fig. 3. XRD patterns of pure α -Fe2O3 and 3 wt% Er2O3-Fe2O3 nanotubes calcined at 550 ° C. |
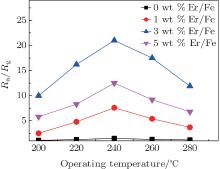
Pure, 1 wt%, 3 wt%, and 5 wt% Er-doped α -Fe2O3 nanotube sensors were tested at different operating temperatures to 10 ppm ethanol and the results are shown in Fig. 4. It can be seen that all the response curves have the same tendency. Firstly, the responses of pure, 1 wt%, 3 wt%, and 5 wt% Er-doped α -Fe2O3 nanotube sensors increase with the operating temperature increasing and reach the maximum value at the operating temperature 240 ° C. Then, the responses decrease rapidly with the operating temperature further increasing. Thus, 240 ° C is chosen as the optimum operating temperature. This performance can be explained as follows. The reaction rate between adsorbed oxygen species and ethanol is low at a low operating temperature. When the operating temperature reaches the optimum value, the adsorption and desorption rates of ethanol and oxygen species achieve a balance, and the response reaches a maximum value. With the operating temperature further increasing, the desorption performance is stronger than the adsorption, this results in the response decreasing.[34, 35] The 1 wt%, 3 wt%, and 5 wt% Er-doped α -Fe2O3 nanotube sensors show improved sensitives to ethanol than pure α -Fe2O3 nanotube sensors. The response values are about 1.5, 7.6, 21, and 12.5 of 0 wt%, 1 wt%, 3 wt%, and 5 wt% Er-doped α -Fe2O3 nanotube sensors at 240 ° C, respectively. Moreover, 3 wt% Er-doped α -Fe2O3 nanotube sensors show the best sensitivity to 10 ppm ethanol. The response value reaches 21 at 240 ° C, which is much higher than that of pure α -Fe2O3 nanotube sensors. Namely, the ethanol sensitivity of pure α -Fe2O3 nanotubes is enhanced remarkably by doping Er. The 3 wt% Er-doped α -Fe2O3 nanotubes material is chosen for further research and written as Er2O3-Fe2O3.
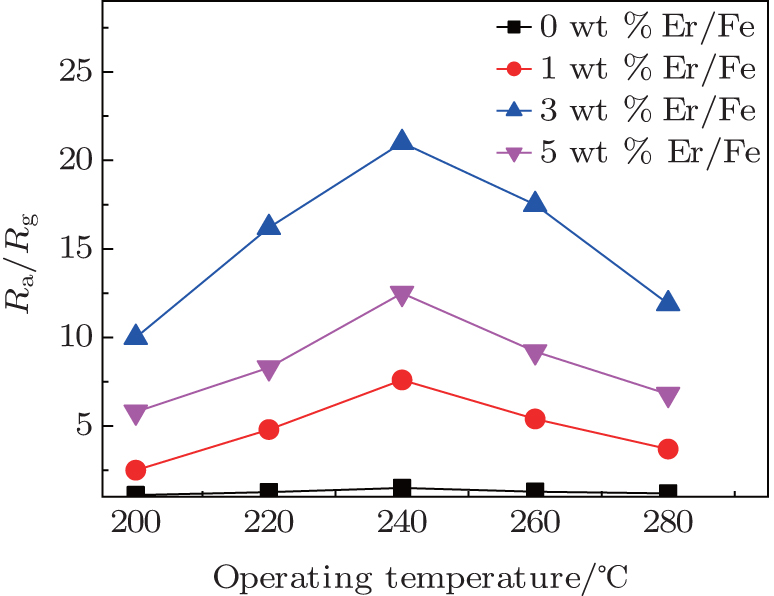 | Fig. 4. Response curves of pure, 1 wt%, 3 wt%, and 5 wt% Er-doped α -Fe2O3 nanotube sensors at different operating temperatures to 10 ppm ethanol. |
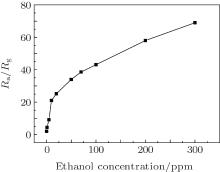
Er2O3-Fe2O3 nanotube sensors were tested at different ethanol concentrations at 240 ° C, and the results are displayed in Fig. 5. The response curve shows that the response increases rapidly at the low ethanol concentration. Then the response increases tardily with the ethanol concentration further increasing. One of the most important factors to gas sensors is the lowest detection limit. The lowest detection limit of Er2O3-Fe2O3 nanotube sensors is 300 ppb ethanol, to which the response value is about 2. It means that Er2O3-Fe2O3 nanotube sensors could detect a small amount of ethanol, which is crucial in practical application. In addition, the Er2O3-Fe2O3 nanotube sensors show a wonderful sensitive to ethanol.
 | Fig. 5. The response curve of Er2O3-Fe2O3 nanotube sensors at different ethanol concentrations at 240 ° C. |
Table 1 indicates that Er2O3-Fe2O3 nanotube sensors show a better sensitivity to ethanol than other ethanol sensors based on other Fe2O3 materials. Hence, the Er2O3-Fe2O3 nanotubes have potential to be used for ethanol sensors.
| Table 1. Comparison between sensors based on Er2O3-Fe2O3 nanotubes and other ethanol gas sensors of Fe2O3. |
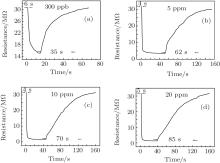
The response and recovery curves of Er2O3-Fe2O3 nanotube sensors to 300 ppb, 5 ppm, 10 ppm, and 20 ppm ethanol at 240 ° C are shown in Fig. 6. It can be seen that the four curves display the same tendency. The response time is about 6 s, 4 s, 4 s, and 5 s to 300 ppb, 5 ppm, 10 ppm, and 20 ppm ethanol, respectively. The Er2O3-Fe2O3 nanotube sensors show a fast response. However, the recovery time is about 35 s, 62 s, 70 s, and 85 s, respectively.
 | Fig. 6. The response and recovery curves of Er2O3-Fe2O3 nanotube sensors to 300 ppb (a), 5 ppm (b), 10 ppm (c), and 20 ppm (d) ethanol at 240 ° C. |
Er2O3-Fe2O3 nanotube sensors have been tested to ethanol and some other common gases, and the results are shown in Fig. 7. It can be seen that Er2O3-Fe2O3 nanotube sensors show a wonderful sensitive property to ethanol, and the response values are about 9.1 and 21 to 5 ppm and 10 ppm ethanol, respectively. However, the Er2O3-Fe2O3 nanotube sensors show less sensibility to other common sensitive gases. These indicate that the Er2O3-Fe2O3 nanotube sensors possess a good selectivity, which makes Er2O3-Fe2O3 nanotubes to be used for ethanol sensors. The response values to different gases are different, which may be due to the characteristics of materials. The previous work has explained that the same sensor could detect different gases by setting different operating temperatures. The energies of different gases for adsorption, desorption, and reaction on the material are different. Hence, the sensitivities of the sensors to different gases at the same temperature are different, which depends on the gas being sensed and the characteristics of the materials.[38, 39]
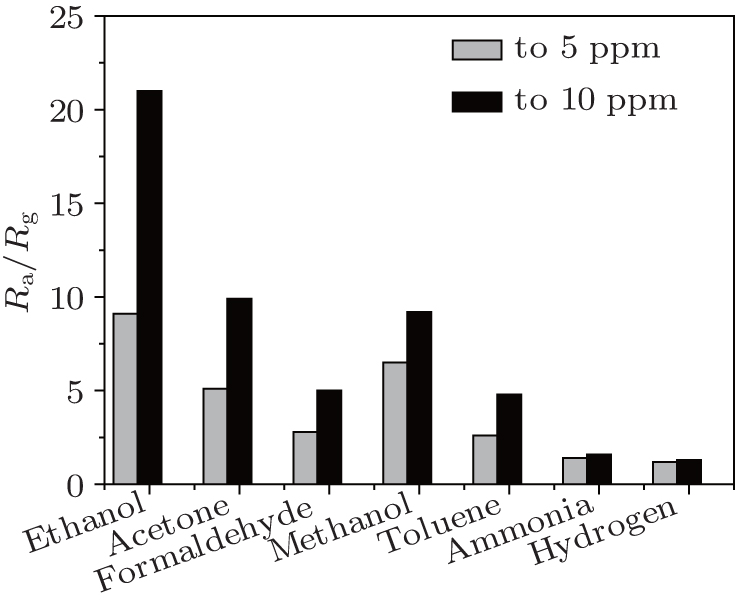 | Fig. 7. The responses of Er2O3-Fe2O3 nanotube sensors to different gases at 240 ° C. |
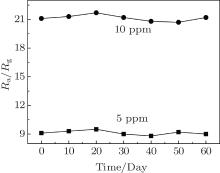
The Er2O3-Fe2O3 nanotube sensors were tested to 5 and 10 ppm ethanol every ten days at 240 ° C and the results are shown in Fig. 8. It can be seen that the ethanol sensing property of Er2O3-Fe2O3 nanotube sensors possess a good long-term stability, due to the stability of Fe2O3. This characteristic indicates that Er2O3-Fe2O3 nanotubes could be applied in practical application.
 | Fig. 8. Responses of Er2O3-Fe2O3 nanotube sensors to 5 and 10 ppm ethanol every ten days at 240 ° C. |
The α -Fe2O3 is an n-type semiconductor, the sensing mechanism can be explained as follows. The response is caused by the change of the sensor resistance. As we know, when the sensor is exposed to the air, the O2 will be adsorbed on the surface of Fe2O3, then the O2 will catch electrons from the semiconductor oxides and turn to 

 |
 |
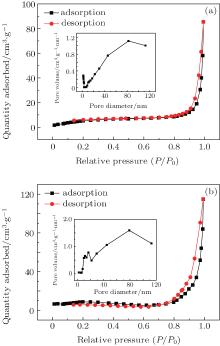
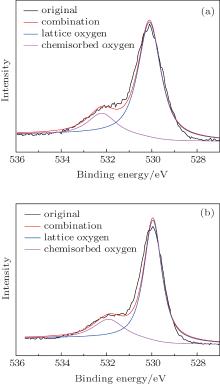
N2 adsorption– desorption isotherm and BJH pore size distribution curves (inset of Fig. 9(a)) of pure α -Fe2O3 nanotubes and Er2O3-Fe2O3 nanotubes are shown in Figs. 9(a) and 9(b). The BET surface area of pure α -Fe2O3 nanotubes and Er2O3-Fe2O3 nanotubes are 22.1 and 27.9 m2/g, respectively, which are relatively higher BET surface areas.[21, 43] Moreover, BET surface area of Er2O3-Fe2O3 nanotubes is higher than that of pure α -Fe2O3 nanotubes. The higher BET surface area will lead to a higher sensitivity. The nanotube structure is an open and high surface-to-volume ratio nanostructure, which will provide large sites for adsorption, desorption, and reaction, not only the outer surface of the material, but also the exposure of the inner surface. This is beneficial to the gas sensing property.[21, 22] XPS spectra of O1s of pure α -Fe2O3 nanotubes and Er2O3-Fe2O3 nanotubes are displayed in Figs. 10(a) and 10(b). The chemisorbed oxygen contents of pure α -Fe2O3 nanotubes and Er2O3-Fe2O3 nanotubes are about 19% and 24%, respectively. Er2O3-Fe2O3 nanotubes will chemisorb more oxygen than pure α -Fe2O3 nanotubes due to the more defects which are resulted from the doping of Er. On the one hand, the enhanced ethanol sensing property of Er2O3-Fe2O3 nanotubes is attributed to Er-dopant which will lead to more defects and vacancies, which means that more oxygen will be chemisorbed on the Er2O3-Fe2O3 nanotubes surface. Then, the more chemisorbed oxygen species will react with ethanol, that will result in a more violent reaction and a higher response. Thus, the enhanced ethanol sensing property of Er2O3-Fe2O3 nanotubes is caused by the increased defects and vacancies due to the Er-dopant.[31, 32] On the other hand, the grain size of Er2O3-Fe2O3 is much smaller than that of pure α -Fe2O3 due to the doping. As we know, the small grain size is beneficial to the gas sensing properties of materials.[17]
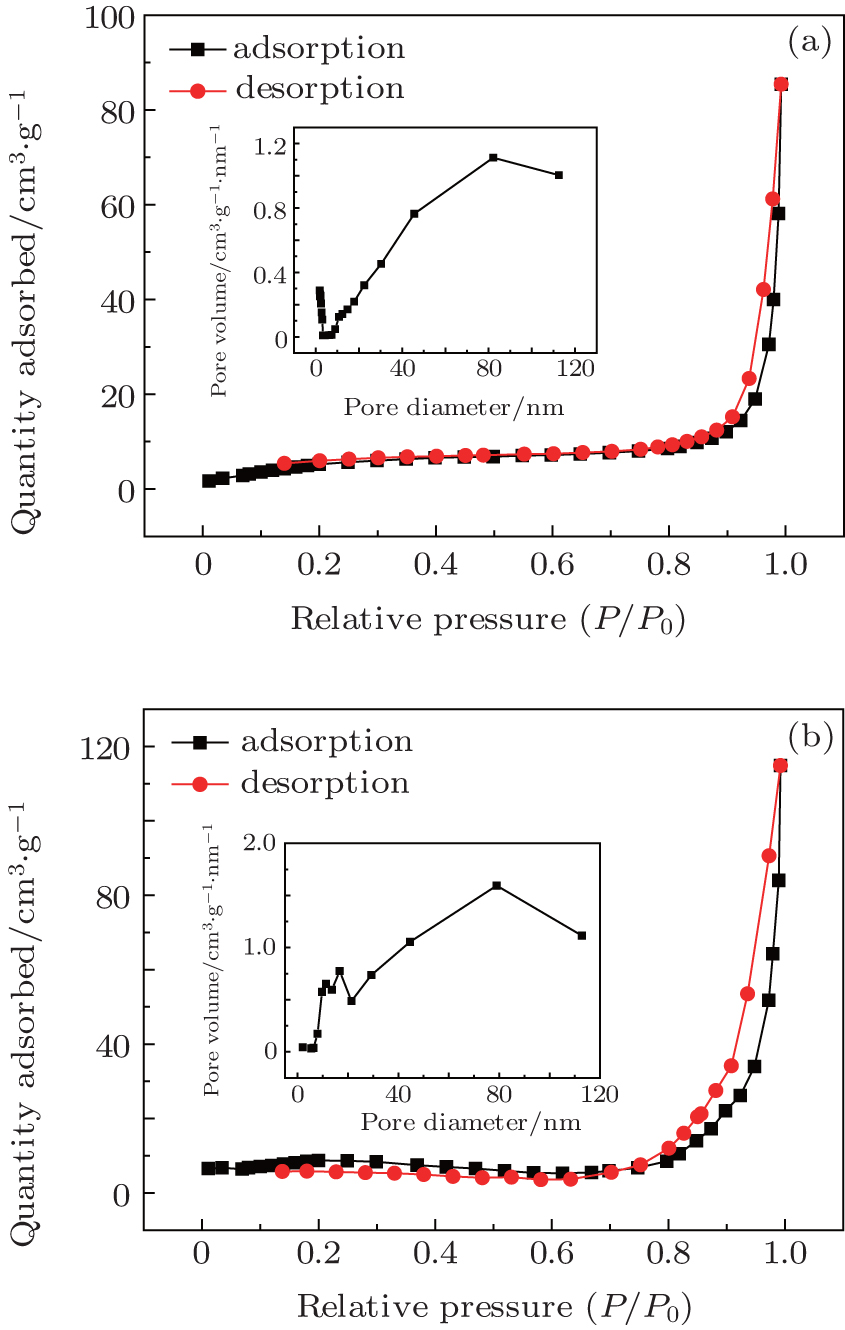 | Fig. 9. The N2 adsorption– desorption isotherm and BJH pore size distribution curves (insert) of pure α -Fe2O3 nanotubes (a) and Er2O3-Fe2O3 nanotubes (b) at standard temperature and pressure. |
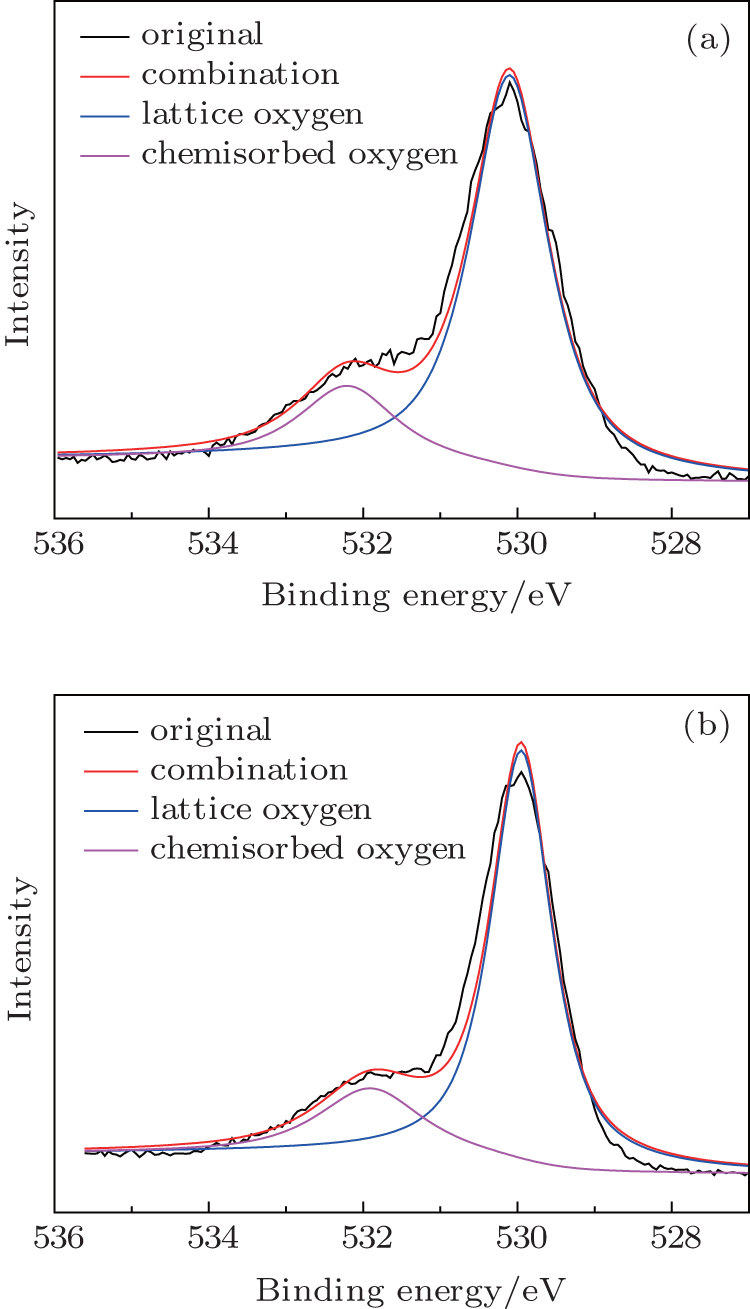 | Fig. 10. The XPS spectra of O1s of pure α -Fe2O3 nanotubes (a) and Er2O3-Fe2O3 nanotubes (b). |
In summary, pure α -Fe2O3 and Er2O3-Fe2O3 nanotubes are successfully prepared via electrospinning method. The research of the gas sensing properties has indicated that doping Er is a wonderful way to enhance the ethanol sensing properties of α -Fe2O3 nanotubes. Er2O3-Fe2O3 nanotubes show a wonderful sensitivity to ethanol at low concentrations. The response value is 21 to 10 ppm ethanol at the optimum operating temperature of 240 ° C. Moreover, the Er2O3-Fe2O3 nanotubes display a fast response time, good selectivity, and long-term stability. These advantages mean Er2O3-Fe2O3 nanotubes can be used for gas sensors.
| 1 |
|
| 2 |
|
| 3 |
|
| 4 |
|
| 5 |
|
| 6 |
|
| 7 |
|
| 8 |
|
| 9 |
|
| 10 |
|
| 11 |
|
| 12 |
|
| 13 |
|
| 14 |
|
| 15 |
|
| 16 |
|
| 17 |
|
| 18 |
|
| 19 |
|
| 20 |
|
| 21 |
|
| 22 |
|
| 23 |
|
| 24 |
|
| 25 |
|
| 26 |
|
| 27 |
|
| 28 |
|
| 29 |
|
| 30 |
|
| 31 |
|
| 32 |
|
| 33 |
|
| 34 |
|
| 35 |
|
| 36 |
|
| 37 |
|
| 38 |
|
| 39 |
|
| 40 |
|
| 41 |
|
| 42 |
|
| 43 |
|