

Crossover from 2-dimensional to 3-dimensional aggregations of clusters on square lattice substrates*
[Cheng Yia) , Zhu Yu-Hongb) , Pan Qi-Faa) , Yang Boa) , Tao Xiang-Minga) , Ye Gao-Xianga)  ]
]
]
|
|


†Corresponding author. E-mail: gxye@mail.hz.zj.cn
*Project supported by the National Natural Science Foundation of China (Grant Nos. 11374082 and 11074215), the Science Foundation of Zhejiang Province Department of Education, China (Grant No. Y201018280), the Fundamental Research Funds for Central Universities, China (Grant No. 2012QNA3010), and the Specialized Research Fund for the Doctoral Program of Higher Education of China (Grant No. 20100101110005).
A Monte Carlo study on the crossover from 2-dimensional to 3-dimensional aggregations of clusters is presented. Based on the traditional cluster–cluster aggregation (CCA) simulation, a modified growth model is proposed. The clusters (including single particles and their aggregates) diffuse with diffusion step length l (1 ≤ l ≤ 7) and aggregate on a square lattice substrate. If the number of particles contained in a cluster is larger than a critical size sc, the particles at the edge of the cluster have a possibility to jump onto the upper layer, which results in the crossover from 2-dimensional to 3-dimensional aggregations. Our simulation results are in good agreement with the experimental findings.
The growth mechanism of thin films is a hot research topic in surface science. Many theoretical and experimental studies focus on the evolution of the physical characteristics during the formation of the films.[1, 2] The Monte Carlo simulation method is frequently used to understand the thin film growth mechanism, since it is quite difficult to observe the growth process directly in experiments.[3– 7]
The diffusion-limited aggregation (DLA) model was developed by Witten and Sander.[8] After that Meakin and Kolb groups independently developed the cluster– cluster aggregation (CCA) model, in which all clusters are allowed to diffuse on the lattices.[9, 10] Vicsek and Family found that the size distribution of the clusters is influenced by the diffusion time.[11] Considering the incorporation of deposition, cluster diffusion and aggregation, Jensen et al. developed the deposition, diffusion, and aggregation (DDA) model.[12] Simulation results showed that the randomly deposited particles diffuse and aggregate in a wide range of morphologies.
Generally, metallic thin films are deposited on solid substrates and their growth mechanism has been well studied.[1, 13, 14] Ye et al.[15] showed that the metallic thin films can also be fabricated on liquid substrates and many interesting phenomena have been observed.[15– 18] The formation mechanism of the thin films may be traced to a two-stage process, [15] the first of which involves nucleation and growth of compact metallic granules during deposition. In the subsequent stage, the granules diffuse on the liquid surface via Brownian motion and then they aggregate, which finally results in the formation of the continuous films. The previous experiments showed that the aggregation mechanism of the metallic thin films on liquid substrates was obviously influenced by the deposition flux, substrate temperature, and material property.[19– 21]
The nanostructure of the Ag ramified aggregates on liquid surfaces was first observed by Xie et al.[18] The aggregates are composed of crystal grains with the size of the order of 10 nm. Although the mean size of the crystal grains does not change obviously, [18] the average branch width and thickness of the ramified aggregates vary with the nominal film thickness and the deposition flux.[15, 22]
The previous research showed that the average size of the Ag particles on the silicone oil surface would be saturated and the average height of the particles would increase gradually with the deposition time.[23] The particles diffuse on the oil surface and then aggregate to form clusters if they meet. With the increase of the cluster size, the particle– particle interaction increases, which makes it attractive for low coordinated edge particles to perform upward transition in the second layer.[2, 20, 24, 25]
In this paper, we focus on the irreversible cluster aggregation growth in the post-deposition regime.[26– 29] A new simulation model, in which a single particle at the edge of the cluster may have a possibility to jump onto the upper layer and the diffusion step length of each particle is variable, is established. The simulation results give an explanation for the crossover from 2-dimensional to 3-dimensional aggregations of clusters on liquid surfaces. Our results are in good agreement with the experimental findings.[20– 22]
The computer simulations are carried out on a square lattice of area L × L with the periodic boundary conditions, where the lattice constant a0 is set to unity. Initially, N particles are deposited randomly on the lattice surface (avoiding overlap). The particles deposited at the nearest-neighbor positions of an occupied site are considered to belong to the same cluster. At each step, one cluster is chosen to diffuse along one of the four possible directions (east, north, west, and south) randomly with diffusion step length l, which may be selected from 1, 2, 3, … , 7. The movement rules of the clusters are defined as follows.
(i) The probability that the cluster actually moves is proportional to its mobility which is defined as Ds = D · s– γ , [30] where s is the cluster size (the number of particles in the cluster, or the lattice sites that the cluster occupies), and D is a constant. If the movement of the cluster is independent of the size s, then the parameter γ = 0, and for Brownian motion, γ = 1/2. For simplicity, to the first order approximation, we set γ = 0 in most of the simulations below. (ii) The diffusion of each cluster is constrained by a non-overlap rule.[28] The diffusion step length l will be reduced automatically until the two clusters just contact each other, if the overlap between two clusters happens. Once two clusters meet, they irreversibly stick and become a new cluster. (iii) If the size of the new cluster is larger than the critical size sc, i.e., s > sc, the edge particles, which are located at the cluster edge and only one of their nearest-neighbors is occupied, have possibility p to jump onto the upper layer of the cluster, which results in the crossover from 2-dimensional to 3-dimensional aggregations of the cluster.
After that the next diffusion process goes on. The simulation stops after diffusion time t, which is increased by Δ t = τ /∑ ns, [30] where ns is the number of s-sized clusters and τ is the mean time needed by a particle to jump by l lattice site. Usually, we set τ = 1.
If we let l = 1 and p = 0, then the model above turns back to the traditional CCA model.[9, 10]
The followed simulations are carried out on a square lattice, where L = 300. The total particle number N ranges from 0.02 ML to 0.22 ML (1 ML equals L2 lattice sites) and the diffusion step length l changes from 1 to 7. Each of the simulation data with error bars in the following figures is the average of more than five simulation results.
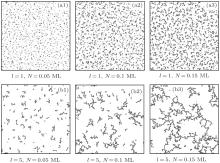
Based on the experimental observations, [15, 22] the appropriate parameters are selected and the typical simulation images are shown in Fig. 1. It can be seen obviously that the average cluster size increases with the diffusion step length l and the particle number N. These phenomena may be understood since the possibility for the clusters to meet each other and then stick together may increase with l and N. We note that the morphology of the ramified clusters (or aggregates) shown in Fig. 1 is quite similar to that of the Ag aggregates prepared in experiment.[15]
 | Fig. 1. Simulation images with different particle number N and different diffusion step length l: (a1) l = 1, N = 0.05 ML; (a2) l = 1, N = 0.1 ML; (a3) l = 1, N = 0.15 ML; (b1) l = 5, N = 0.05 ML; (b2) l = 5, N = 0.1 ML; (b3) l = 5, N = 0.15 ML. Here sc = 30, γ = 0, p = 0.5, and t = 30. |
Fractal dimension df is a useful parameter to describe the morphology of the ramified clusters. By the box method, [31] parameters df for the aggregates shown in Figs. 1(a3) and 1(b3) are measured and the results are 1.35 and 1.32, respectively. With a similar particle coverage, the results above are smaller than those of the aggregates in the CCA model, [9, 10] which is reasonable since the clusters shown in Fig. 1 are less branched due to the possibility p ≠ 0.[15]
The particle coverage of the total area, namely ρ , is defined as the total number of particles occupying the first layer, namely Nt, divided by the area of the system, i.e., ρ = Nt/L2. If s < sc is available for all the clusters, then Nt equals the total particle number N. In this case, Nt = N = ρ L2. In other words, the coverage ρ decreases with increasing the number of particles jumping onto the second layer.
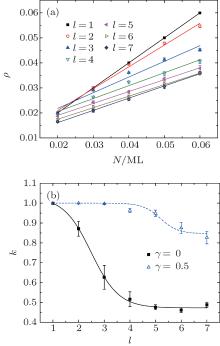
In order to study the growth process of the clusters precisely, we calculate the coverage ρ for all the simulation images as shown in Fig. 2(a). For ρ < 0.06, a linear dependence between coverage ρ and particle number N with a different slope is observed. An interesting phenomenon is that the slope k obtained from Fig. 2(a) evolves with the diffusion step length l, as shown in Fig. 2(b). For γ = 0, the solid curve shows that the slope k decreases with l in the range of 1 < l < 4 and gradually approaches a stable value for l > 4. However, for the case of γ = 0.5 (i.e., the diffusion mobility of the clusters is size dependent), the slope k possesses two stable values for l < 4 and l > 6.
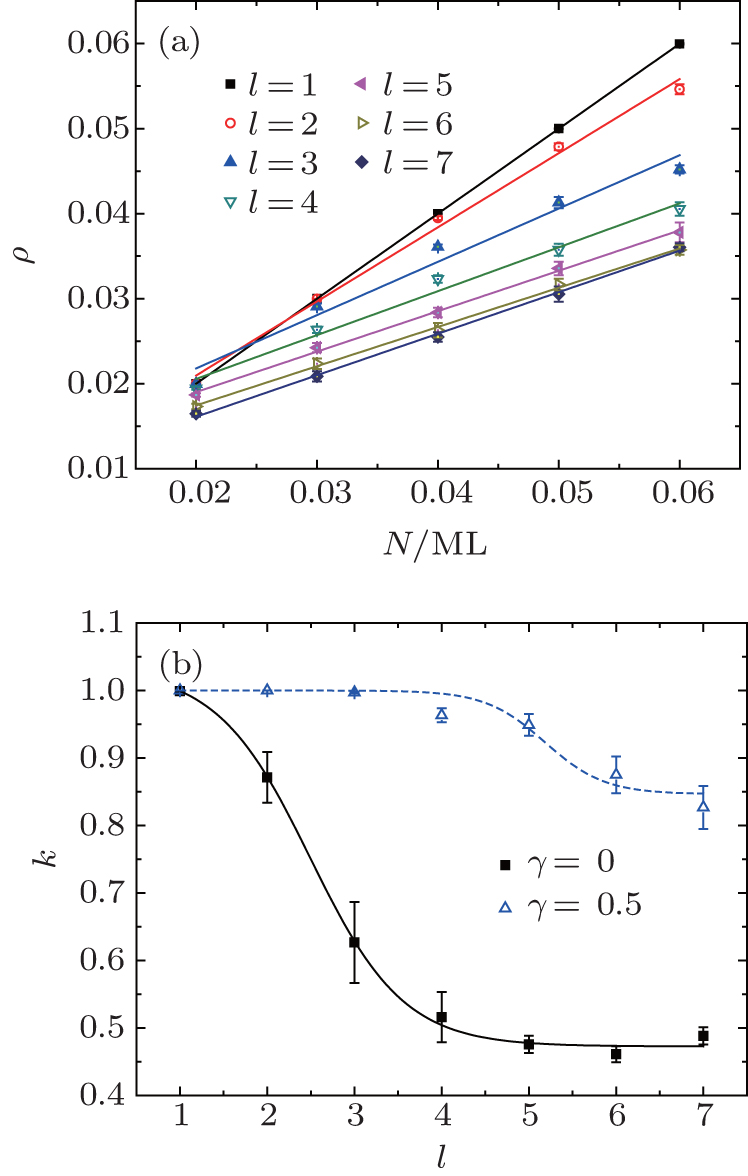 | Fig. 2. (a) The dependence between coverage ρ and particle number N. The solid lines are the linear fits to the simulation data, where γ = 0, t = 30. (b) The behavior of the slope k as a function of l with t = 30. The solid and dash lines are the fits to the simulation results with γ = 0 and γ = 0.5, respectively. |
The previous experiment showed that the evolution of the coverage obeys the formula
 |
where h is the nominal thickness, and the slope K is related to the deposition flux f.[19] Experimentally, it should be noted that Kh = kN and the diffusion step length l, which relates to the kinetic energy of the particle, should increase with the deposition flux f. Therefore, the results in Fig. 2 are in agreement with the experimental findings qualitatively.[22]
The result above describes the linear growth behavior of the clusters when the particle number is small (N < 0.07 ML). If the particle number N increases and is beyond 0.07 ML, various clusters with s > sc appear. Then the edge particles have possibility p to jump onto the upper layer of the clusters, which results in the crossover from the 2-dimensional to 3-dimensional aggregations.
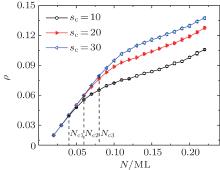
Figure 3 shows the dependence between ρ and N, in which two different behaviors can be detected. If the coverage ρ is low enough, then ρ increases with N linearly, and in this case, N ≈ Nt. Then a nonlinear dependence between ρ and N may be observed if N is beyond the critical particle number Nc, i.e., N > Nc. In this case, various clusters with s > sc appear and then the edge particles jumping onto the second layer becomes possible. The phenomenon shown in Fig. 3 is in agreement with the experimental observations.[19, 22] Obviously, Nc increases with the critical size sc, and as shown in Fig. 3, the values of Nc for sc = 10, 20, and 30 are 0.04 (Nc1), 0.06 (Nc2), and 0.08 (Nc3), respectively. This phenomenon is quite reasonable since more particles are needed if more clusters with s > sc could form during the aggregation process. Experimentally, the critical size sc should be related to the interaction among the particles and between the clusters and the substrates.
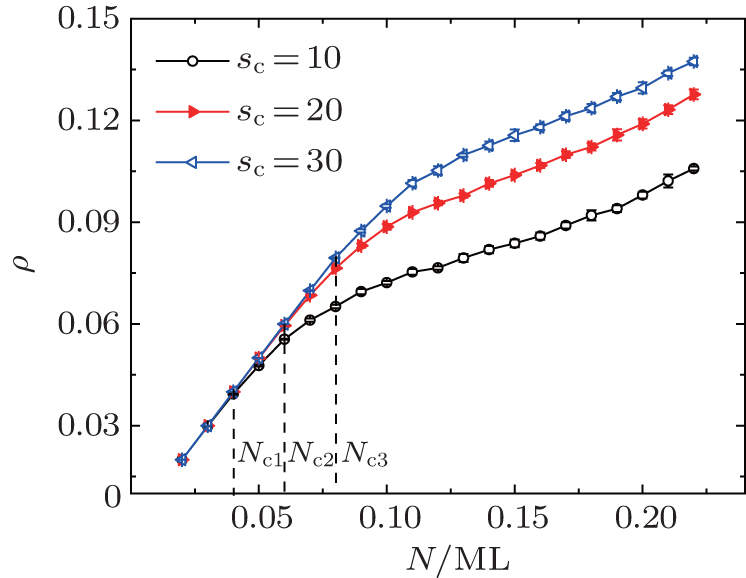 | Fig. 3. The dependence between coverage ρ and particle number N. A nonlinear dependence between ρ and N appears if N > Nc, where l = 1, γ = 0, p = 0.5, and t = 30. The solid lines are guides to the eye. |
The average height of the aggregates, namely H, equals the average number of the particles on each occupied lattice site. The dependence between H and N is shown in Fig. 4. For l = 1, H remains unchanged until N ≈ 0.08 ML. Then if N further increases, H goes up quickly. However, for l = 3 or 5, H increases monotonously with N at the very beginning, and finally, it approaches a saturation value, which implies that for the clusters with s > sc, the percentage of the edge particles increases with N first and then gradually approaches a saturation value.
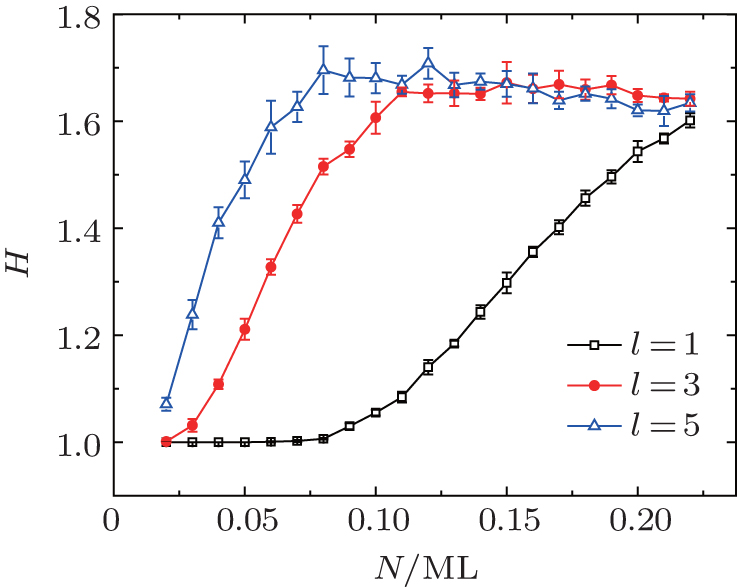 | Fig. 4. The dependence between average height H and particle number N, where γ = 0, p = 0.5, and t = 30. The solid lines are guides to the eye. |
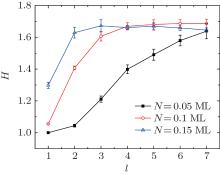
The behavior of the average height H versus the diffusion step length l is shown in Fig. 5. It can be seen that H increases with l first and then approaches a saturation value, and as N increases, H would be saturated more quickly, which is quite similar to the experimental observation.[22] The simulation result shown in Fig. 5 reveals that the diffusion step length may greatly influence the growth process of the clusters.
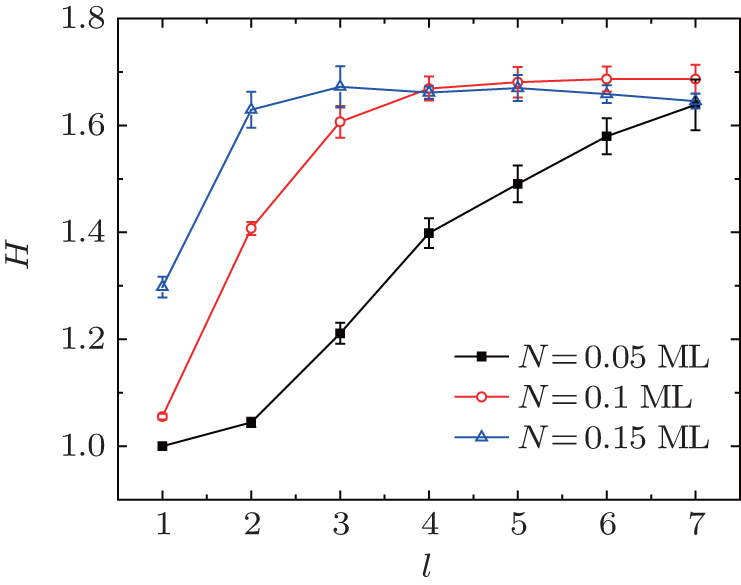 | Fig. 5. Dependence between H and l, where γ = 0, p = 0.5, and t = 30. The solid lines are guides to the eye. |
Let us suppose that each particle exhibits a disk-shaped structure[15] and its volume is Vp = π r2H0, where r and H0 are the radius and height of the particle, respectively. If the mass density of the particles remains unchanged during the aggregation process, then Kh = kN and equation (1) can be written as
 |
Therefore, if ρ ≪ 1, we obtain
 |
Equation (3) shows that, if ρ ≪ 1, H is independent of the particle number N, which is in agreement with the result when l = 1 and 3, as shown in Fig. 4. On the other hand, as k decreases with l (see Fig. 2), then at least equation (2) is in agreement with the results shown in Fig. 5 qualitatively.
The results above have explained the aggregation mechanism of Ag aggregates on the silicone oil surface, [19, 22] which are obtained when p = 0.5 and t = 30. Figure 6 presents the dependence between the coverage ρ and the diffusion time t. The jump possibility p ranges from 0.01 to 1. Basically, ρ decreases with t and drops more quickly if p increases. However, if p > 0.3, the dependence between ρ and t remains unchanged, as shown in Fig. 6.
 | Fig. 6. Plot of the coverage ρ versus the diffusion time t for different jump possibilities, where γ = 0, N = 0.1 ML, l = 1, and sc = 30. |
In principle, the jump possibility p represents the interactions among the metallic particles and between the clusters and the liquid substrate. The previous studies have verified that the formation of Fe, Al, Au, and Ag aggregates on the silicone oil surfaces obeys the two-stage growth model, and all the aggregates consist of various nano-particles.[15, 18, 19, 32– 34] The experiments indicated that Fe and Al aggregates are likely to grow in a 2-dimensional manner, [32, 33] resembling the situation p ≈ 0, while Au and Ag aggregates tend to grow in a 3-dimensional manner, [18, 19] corresponding to the situation p ≥ 0.3.
The diffusion time t represents the average total steps that each cluster can move during the simulation process. In principle, it relates to the viscosity of the substrates and the decrease of the viscosity leads to the increase of t. As the clusters diffuse and aggregate with t, the average cluster size increases and goes beyond the critical size, then more and more clusters may grow in the 3-dimensional manner. In Fig. 6, if t < 20 (i.e., for very high viscosity), the speed of the diffusion and aggregation of the clusters is slow, and therefore, the cluster sizes are smaller than the critical size. In this case, the edge particles could not jump onto the second layer of the clusters, i.e., the clusters aggregate in the 2-dimensional manner and the coverage remains unchanged with t, as shown in Fig. 6.
Based on the traditional cluster– cluster aggregation (CCA) simulation, we have established a new simulation model and studied the aggregation mechanism of particles and clusters systematically. It is shown that for ρ < 0.06, the coverage ρ increases linearly with the particle number N and the slope k tends to decrease with the diffusion step length l. As the particle number N increases, the particles and clusters aggregate. If the size of the cluster increases and goes beyond the critical size sc, then the edge particles may jump onto the second layer of the cluster, which results in the crossover from 2-dimensional to 3-dimensional aggregations of the clusters. The simulation results are in good agreement with the experimental findings.
For the sake of simplicity, the mass density of the particles is proposed to be unchanged in our simulation model. However, several experiments[19, 20] have shown that the mass density also evolves during the aggregation process, which finally results in the crystallization of the particles. This process may directly influence the average diameter and height of the particles. Then the coverage behavior may become quite complicated. In order to understand the crystallization of the particles during the growth process, the simulation should be carried out on a nonlattice substrate. For fundamental as well as practical purposes, further research on this topic is needed.
We gratefully thank Lv Neng, Ma Rui-Rui, Chen Hang, Chai Feng-Na, Wang Meng-Di, and Lu Chen-Xi for their helpful discussions.
| 1 |
|
| 2 |
|
| 3 |
|
| 4 |
|
| 5 |
|
| 6 |
|
| 7 |
|
| 8 |
|
| 9 |
|
| 10 |
|
| 11 |
|
| 12 |
|
| 13 |
|
| 14 |
|
| 15 |
|
| 16 |
|
| 17 |
|
| 18 |
|
| 19 |
|
| 20 |
|
| 21 |
|
| 22 |
|
| 23 |
|
| 24 |
|
| 25 |
|
| 26 |
|
| 27 |
|
| 28 |
|
| 29 |
|
| 30 |
|
| 31 |
|
| 32 |
|
| 33 |
|
| 34 |
|