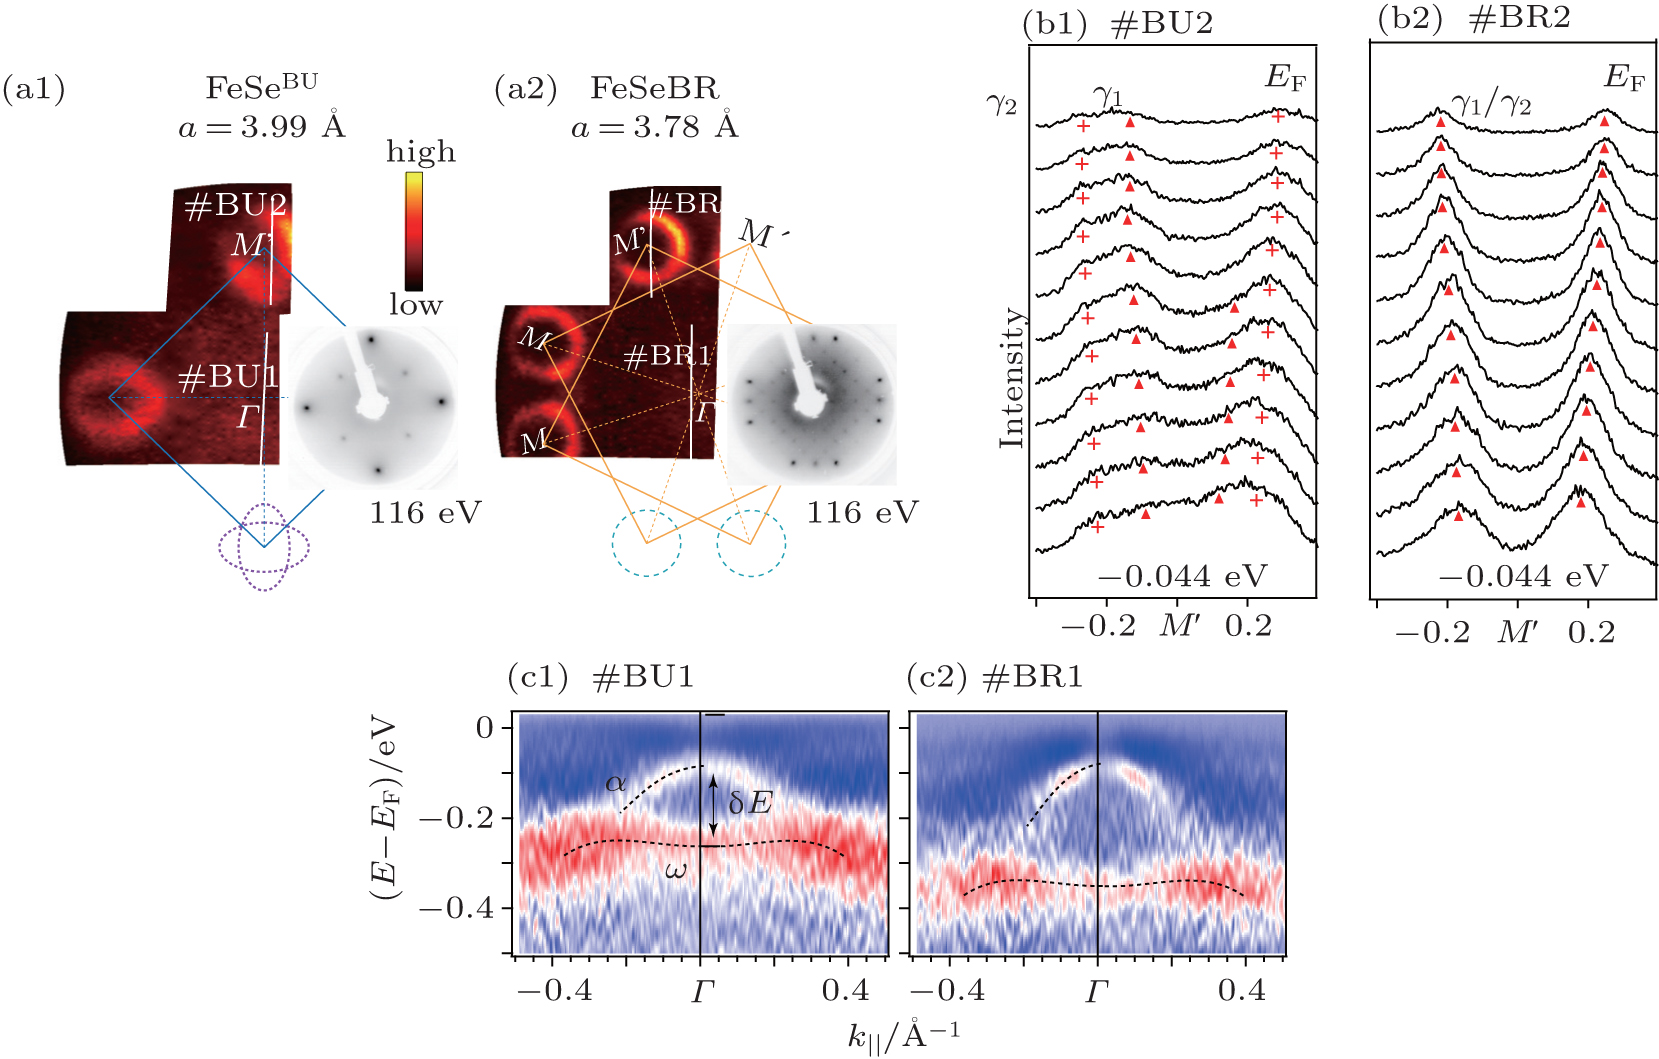
| (a1) and (a2) The photoemission intensity maps and LEED patterns of FeSeBU and FeSeBR, respectively. (b1) and (b2) The separated and degenerate γ bands for FeSeBU and FeSeBR, respectively. (c1) and (c2) The second derivative image of spectra around zone center, showing the hole-like band α and flat band ω , for FeSeBU and FeSeBR, respectively. Panels (a)–(c) are reprinted with permission from Ref. [ 15 ], copyright 2014 by Nature Communications. |
 |