Peng Ruia), b) , Xu Hai-Chaoa), b)  , Feng Dong-Lai
a), b)
, Feng Dong-Lai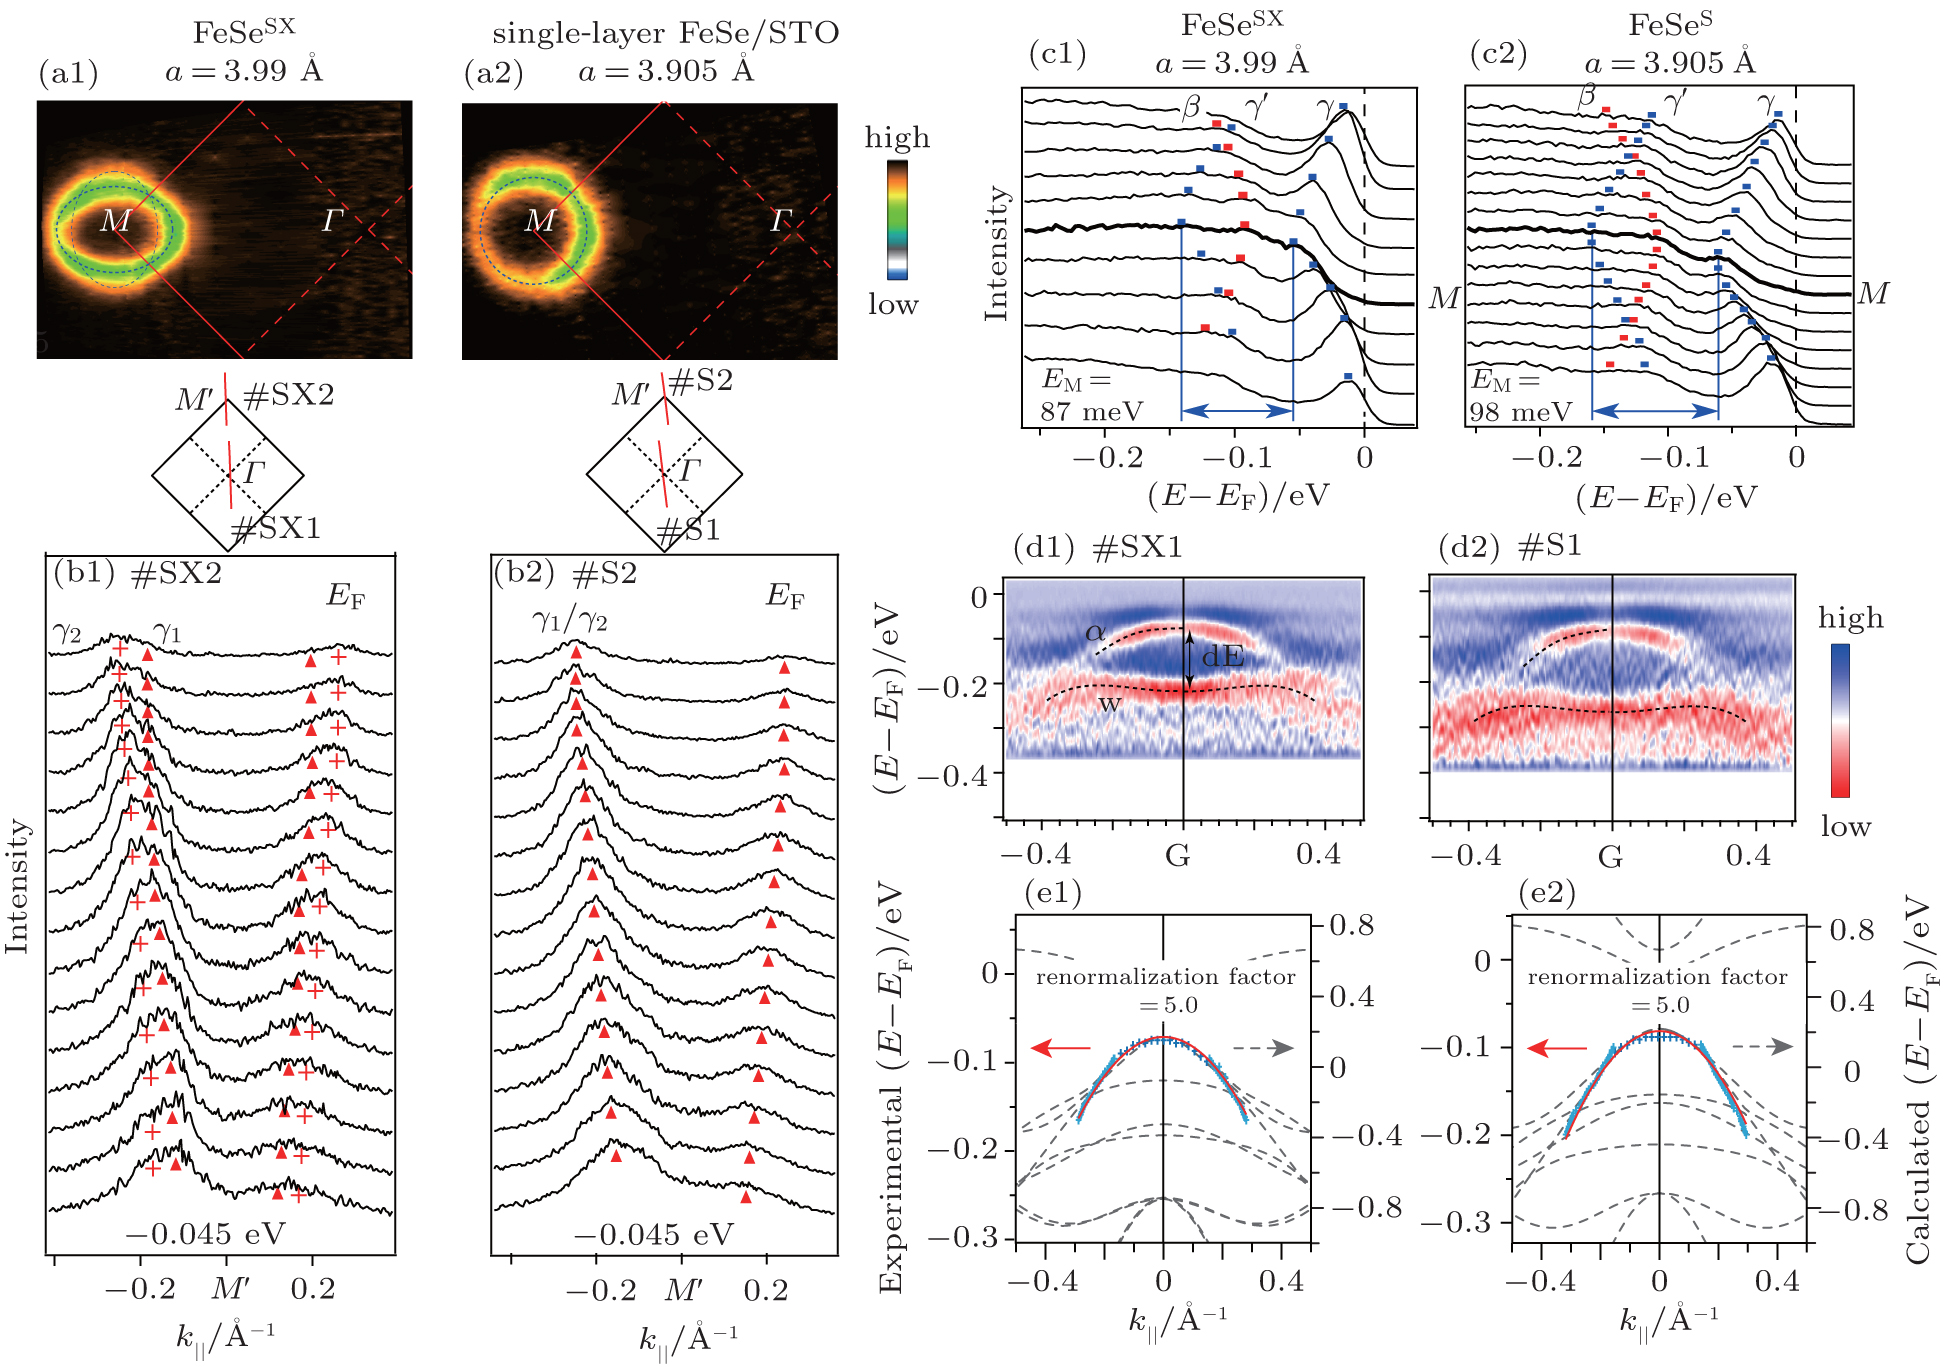
|
Peng Rui
, Feng Dong-Lai |
| (a1) and (a2) The photoemission intensity map at Fermi energy for FeSeSX and single-layer FeSe/STO, respectively. (b1) and (b2) The separated and degenerate γ bands of FeSeSX and single-layer FeSe/STO, respectively. (c1) and (c2) The replica band of γ band observed in FeSeSX and single-layer FeSe/STO, respectively. The E M indicates the energy separations between the main band and the replica band, which represents the energy scales of the phonon modes. (d1) and (d2) The second derivative image of spectra around zone center, showing the hole-like band α and flat band ω , for FeSeSX and single-layer FeSe/STO, respectively. (e1) and (e2) Comparison of DFT calculations and experimental band dispersions around zone center, for FeSeSX and single-layer FeSe/STO, respectively. Panel (a) is reprinted with permission from Ref. [ 16 ], copyright 2014 by the American Physical Society. Panels (b)–(e) are reprinted with permission from Ref. [ 15 ], copyright 2014 by Nature Communications. |
| |