
Spectral investigation of R, Ce:YAG ( R: Pr3+, Eu3+, Gd3+) single crystals and their applications in white LEDs
[Du Yonga) , Shao Chong-Yuna) , Dong Yong-Junb)  , Yang Qiu-Hong
a) , Hua Weib) ]
, Yang Qiu-Hong|
|


†Corresponding author. E-mail: dongyj@siom.ac.cn
Eu3+, Pr3+, or Gd3+ codoped Ce:YAG single crystals were grown by using the Czochralski method. The photoluminescence (PL) emission and excitation spectra and transmittance were measured and investigated. The additional red-emitting bands were observed in the PL emission spectra of Eu,Ce:YAG and Pr,Ce:YAG single crystals and the formation of noticeable peaks was studied with reference to the schematic energy level diagrams. A red-shifted phenomenon was observed in the PL emission spectrum of Gd,Ce:YAG. With codoped Eu3+, Pr3+, or Gd3+ ions, warmer white light was achieved for the white light emitting diodes and the color rendering index became higher.
With the continuous development of the light emitting diode (LED) manufacturing technology and growing demand in power LED applications, requirements of LED materials and devices with high luminous efficiency, low color temperature, and high color rendering index have been put forward. The method of yellow phosphor powders/blue chip to achieve white light has attracted much attention since Japan’ s Nichia first developed this technology. Owing to its simple makeup and easy packaging progress, this method has been adopted for the commercial application around the world and has been the focus of research.
However, the yellow silicone layer is observed with yellow phosphor and silicone glue long-time heating, leading to the shift of the color temperature.[1] Furthermore, the structure of the phosphor powders/blue chip is difficult to meet the requirement of low color temperature and high color rendering index for general lighting devices. In comparison, the Ce:YAG single crystal phosphor is a promising substitution for Ce:YAG powders, because of its optical transmittance, good photo-uniformity, and simple packaging progress. However, due to Ce:YAG phosphor emission peak centered at around 528 nm and short of red irradiation, high correlated color temperature (CCT) and low color rendering index (CRI) of Ce:YAG-based white LED are never meeting the requirement of light device applications. In order to solve the problem, some authors proposed adding a red-emitting phosphor layer to the surface of the yellow-green emitting phosphor layer.[2, 3] For the Ce:YAG phosphors, it does not work because resin silicones must be used and thus it loses the original idea of resin-free package. The second approach is to codope using rare-earth ions that can enhance red emission, such as Cr3+ , Pr3+ , Eu3+ , Sm3+ , and Mn3+ .[4– 7] Wang et al. reported the Cr enriched red emission and confirmed the nonradiative energy transfer from the Ce3+ level to the Cr3+ level in Ce, Cr:YAG.[8] Another paper showed the detailed white light optical indexes and made the color rendering index high to 80.1, but the intensity of their photoluminescence spetra was too low.[9] Though Cr3+ ions have a superior long red emission band ranging from 650 nm to 720 nm, the transmittance of the doped bulk crystal is always a big problem that impacts the optical properties. For Sm3+ ions, the optical properties of the related WLED cannot get obviously improved because the red emitting band is so weak at the blue light excitation. In this work, Eu3+ , Pr3+ , and Gd3+ ions were chosen as codoped ions in the Ce:YAG single crystal system. Detailed discussion was focused on the red-enhanced mechanism between Ce3+ and R3+ (Pr3+ , Eu3+ , Gd3+ ) ions through the photoluminescence (PL) excitation and emission spectra. At the same time, the corresponding WLEDs were packaged and electroluminescent behaviors were investigated by comparison between R, Ce:YAG (R: Pr3+ , Eu3+ , Gd3+ ) and Ce:YAG single crystal.
The R, Ce:YAG (R: Pr3+ , Eu3+ , Gd3+ ) single crystals were grown by the Czochralski method. The high-purity yttrium oxide powder (99.999%), aluminum oxide (99.999%), cerium oxide (99.99%) were uniformly mixed at the stoichiometric ratio and then pressed into blocks that placed in an iridium crucible. To grow the R, Ce:YAG (R: Pr3+ , Eu3+ , Gd3+ ) single crystal, the oxide of R (praseodymium oxide, europium oxide, and gadolinium oxide) as a plus was added into the mixture. In our experiment, the concentrations of R3+ and Ce3+ were set as 0.8 mol% and 0.8 mol%, respectively. After molten at 1200 ° C for 10 h in the Ar atmosphere to rule out the absorbent water and other impurities, the (111) oriented YAG single crystal used as a seed was gradually lifted up from the surface of the melting liquid. Through the periods of necking down, shoulder pulling, fixed-neck growing, and growing ending, a crystal was obtained. During fixed-neck growing, the lifting speed of the YAG single crystal seed was 1– 2.5 mm/h with a spinning rate of 12 r/min.
The crystalline phases of the samples were identified by x-ray diffraction (XRD) measurement (Bruker D8, Germany) using Cu Kα radiation. The absorption and transmittance spectra of all samples were tested with a spectrophotometer (Lambda950, Perkin Elmer). The emission and excitation spectra were recorded at the wavelength range of 200– 750 nm, respectively, with a spectrophotometer equipped with a xenon lamp (JASCO FP6500, Japan).
The luminescent properties of all samples were tested by using a photo-electric testing system (PMS-80V1, EVERFINE). PMS-80V1 is an optical measurement system which contains an integrated sphere and a spectrometer, and controlled by a PC program. The LED chip was placed at the center of a reflector cup. The integrated sphere equipped with an optical fiber and a CCD detector was used to measure the optical spectrum of the WLED. When testing, the Ce:YAG single crystal plates were covered on the LED chip at the center of the integrated sphere. The scanning range was from 380 nm to 800 nm with the scanning interval of 5 nm and the input voltage of 3 V. The electroluminescence (EL) spectra, color coordinates, color rendering indexes, color temperatures, and luminous efficiencies of the specimens were tested.
The XRD patterns of the Ce:YAG and R, Ce:YAG (R: Pr3+ , Eu3+ , Gd3+ ) single crystals are shown in Fig. 1. The YAG single phase is identified, and weak peaks are observed which do not belong to the YAG phase, it is speculated that they are induced by crystal field splitting after the R3+ ions are codoped. The XRD pattern of the Ce:YAG single crystal is consistent with JCPDS card (No. 33-0040), indicating that the Ce3+ dopants are incorporated into the YAG host lattice without altering the original structure of YAG. Though the codoped ions induce weak peaks, they do not change the whole crystal structure and impact the following optical properties.
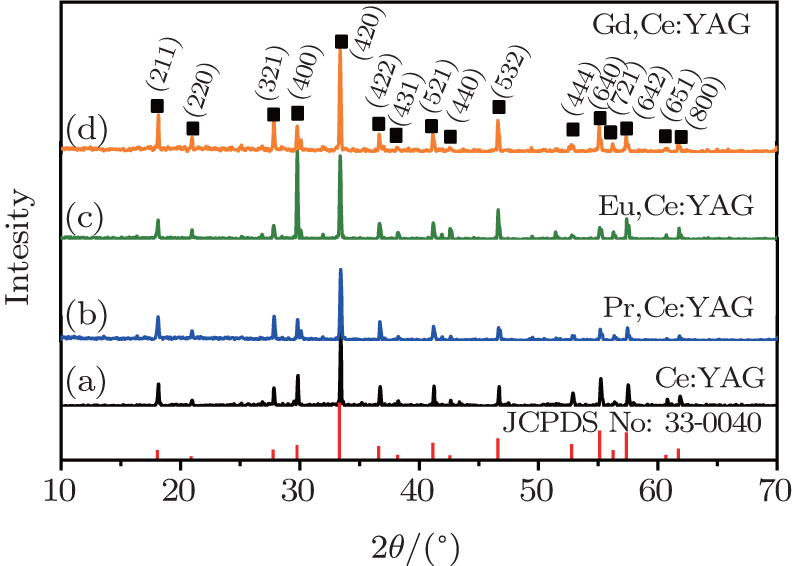 | Fig. 1. XRD patterns of R, Ce:YAG (R: Pr3+ , Eu3+ , Gd3+ ) single crystals. |
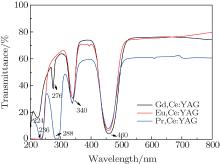
The optical transmittances of the R, Ce:YAG (R: Pr, Eu, Gd) single crystals are shown in Fig. 2. The transmittance of the Eu, Ce:YAG single crystal sample is 79.66%, and those of the Gd, Ce:YAG and the Pr, Ce:YAG single crystal samples are 74.22% and 60.67% at 800 nm, respectively. The transmittance of the R, Ce:YAG (R: Gd3+ , Eu3+ ) single crystal is obviously larger than that of the Pr, Ce:YAG single crystal. The absorptions at nearly 340 nm and 460 nm of all samples are generated by the absorption due to the corresponding Ce3+ transitions of 2F5/2 → 5d and 2F7/2 → 5d, and those at 288 nm and 236 nm originate from the Pr3+ transitions of 4f2 → 4f5d. The peak at 224 nm is attributed to the charge transfer band and the absorption at 275 nm corresponds to 8S7/2 → 6IJ of Gd3+ .
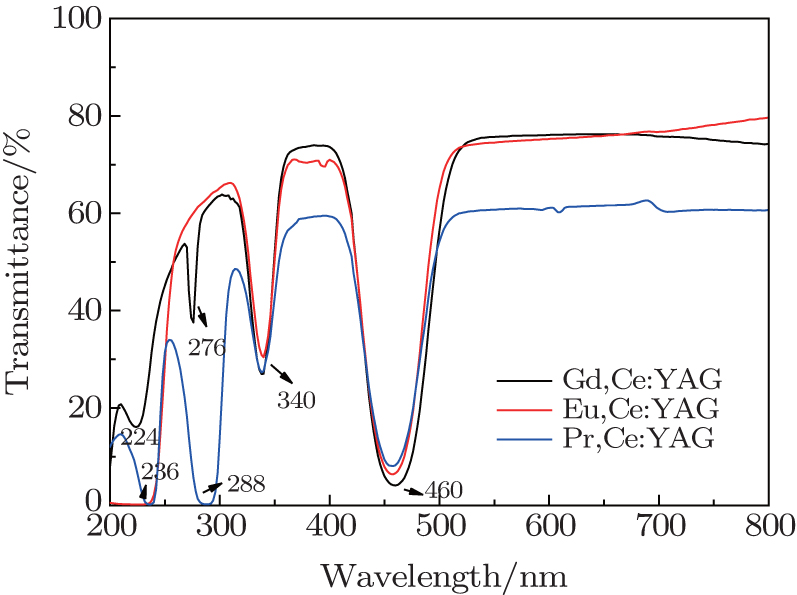 | Fig. 2. Optical transmittances of R, Ce:YAG (R: Pr3+ , Eu3+ , Gd3+ ) single crystals. |
Eu3+ and Ce3+ simultaneously exist in the YAG crystal structure and the new ions system must be considered and discussed because of the interaction between the two ions. On one hand, the Ce3+ ion ([Xe]4f1) is likely to form the stable Xe electron configuration after losing one electron. On the other hand, the half-filled-shell effect will occur in the Eu3+ ion ([Xe]4f6) if an electron is obtained, which is the relatively stable electron configuration. Therefore, the chemical reaction Eu3+ + Ce3+ → Eu2+ + Ce4+ is possible and there is doubt whether the Eu2+ ions are dominant in the YAG crystal structure. Fadlalla et al. studied the crystalline YAG:Eu2+ phosphors and the samples exhibited blue emission spectra within the range of 447– 503 nm with the main broad-band emission peak at 480 nm, belonging to the characteristic emission of the 
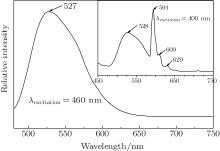
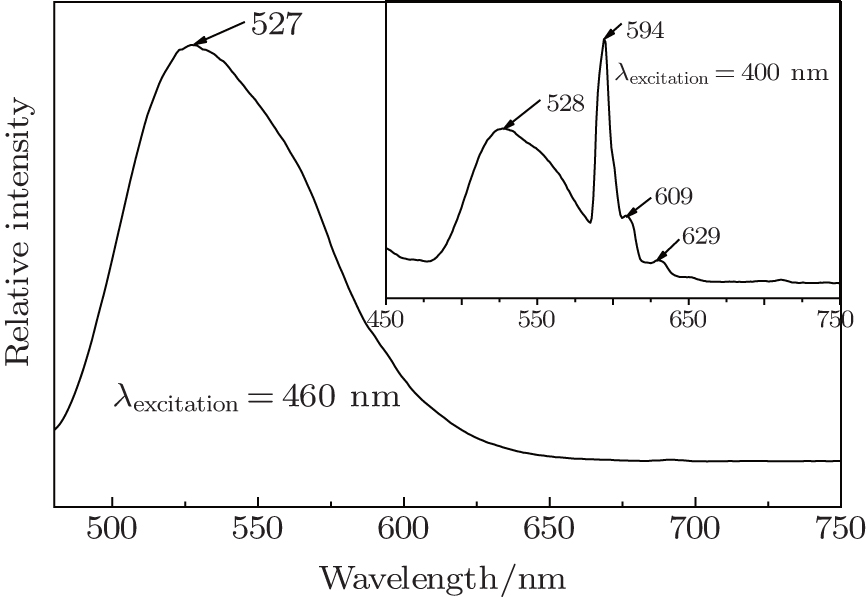 | Fig. 3. PL emission spectrum of Eu, Ce:YAG single crystal after 460 nm excitation. The inset shows the PL emission spectrum corresponding to 400 nm excitation. |
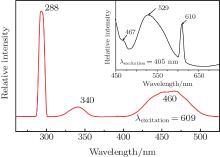
 | Fig. 4. PL excitation spectrum of Eu, Ce:YAG single crystal (detected wavelength of 590 nm). The inset shows PL excitation spectrum corresponding to detected wavelength of 530 nm. |
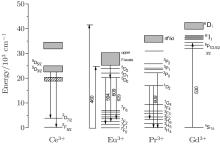
With codoped Eu3+ ions, we expect to see the Eu3+ contribution to enhance the red light wave band. Though the broad peak around 528 nm is obtained at the excitation of 460 nm, but this is the expected result. Therefore 400 nm is used as the excited wavelength, and the appearance of peaks at 528 nm, 594 nm, 609 nm, and 629 nm is depicted in the inset spectrum of Fig. 3. The intense emission peak at 594 nm, characteristic of Eu3+ magnetic dipole transition 5D0 → 7F1, is found along with two relatively weak emissions around 609 nm and 629 nm, which are originating from Eu3+ electric dipole transitions of 5D0 → 7F2 and 5D0 → 7F3, respectively. The excitation spectrum corresponding to 590 nm emission is shown in Fig. 4. Except for the Ce3+ characteristic peaks, a tense peak centered at 294 nm can be clearly observed from the PL excitation spectrum. At the same time, the wavelengths around 341 nm and 460 nm cannot directly excite the Eu3+ ions but several red emission peaks are observed. The above various factors are taken into consideration, the energy transfer of Ce3+ → Eu3+ may happen in the the Eu, Ce:YAG single crystal system. That is to say, the excitation of Eu3+ occurs via the Ce3+ absorption, which means that the Ce3+ ion acts as a sensitizer for the Eu3+ luminescence. The energy transfer route of Ce3+ → Eu3+ can be deduced from the energy level diagrams for Ce3+ and R3+ ions (Fig. 7). The Ce3+ ion is excited to the 2D0 (5d) state by optical excitation, then all of the energy is transferred to the 5D1 level of Eu3+ . The 5D0 → 7F1.2.3 transitions occur after the non-radiative transition 5D1 → 5D0.
Due to the Pr3+ abundant wave band for absorption and emission, it is believed that the Pr3+ ions are appropriate to be added to the Ce:YAG single crystal as a co-doping element for approving the emission light. Heesun Yang et al. reported the PL emission spectra of Pr-codoped YAG:Ce nanocrystalline samples with excitation wavelengths of 287 nm and 440 nm and the energy transfer between Pr3+ and Ce3+ was described.[6, 7] Kim et al. introduced the single phase full-color-emitting phosphor for near-UV pumped white LED, but few studies on the codoped Ce:YAG single crystal using rare-earth ions have been reported.[11] The theoretical investigations on the codoped YAG:Ce nanocrystalline is almost based on the crystal structure; to some degree, those theories can be applied to the codoped YAG:Ce single crystal.
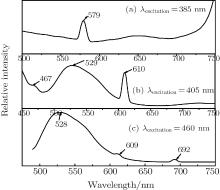
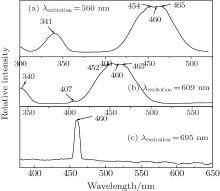
Since excitation wavelengths of 287 nm and 440 nm have been studied, those of 385 nm, 405 nm, and 460 nm are chosen for the broad absorption in the Pr, CeYAG single crystal system in this paper. In order to investigate the formation of the emission peaks, wavelengths of 560 nm, 609 nm, and 696 nm are detected (520 nm and 608 nm corresponding excitation spectra in Ref. [6]). With the excitation of 385 nm, the Pr, CeYAG single crystal sample shows a sharp emission peak at 579 nm, which is related to the relaxation of 3P0 → 3H5 of the Pr3+ ions. A broad emission peak at 529 nm and a sharp emission peak at 609 nm are observed under the excitation of 405 nm and 460 nm, but stronger in the former and weaker in the latter in comparison to the results under 440 nm in Ref. [6]. The appearance of the emission peaks at 529 nm and 609 nm is closely related to the Ce3+ → Pr3+ energy transfer. The Ce3+ → Pr3+ energy transfer can be depicted by a non-radiative relaxation and the radiative relaxation of the excited 5d electrons of the Ce3+ ion. After the electrons of the Ce3+ ion are excited from the 4f state to the 5d level, most of them return to the ground state of the Ce3+ ion, a small amount of them can transfer energy in the form of radiative relaxation from the 5d level to 1D2 level of the Pr3+ ions. Another small amount of electrons can transfer nonradiative energy to the 3P0 energy level of the Pr3+ ions. Consequently, 608 nm emission appears due to the radiative energy transition from the 1D2 energy level to the 3H4 energy level of the Pr3+ ions. The nonradiative way strengthens the emission in the range of 525– 600 nm. Because 288 nm excitation cannot directly excite the Ce3+ ion existing in the Pr, Ce:YAG single crystal sample, the 4f2 → 4f5d transition is generated in the Pr3+ ions. Then the Pr3+ → Ce3+ energy transfer is realized in a nonradiative way which is the relaxation from the 3P0 energy level of the Pr3+ ions to the 5d state of the Ce3+ ions, followed by the relaxation of the excited 5d electrons of the Ce3+ ions.
In addition, the small emission peak at 467 nm under the excitation of 405 nm and 692 nm are showed in Figs. 5(b) and 5(c). the former is originated from the transition of 3P0 → 3H5 of the Pr3+ ions and the latter is corresponding to the radiative energy transition of Ce3+ → Pr3+ , followed by the 1D2 level to 2F level of the Pr3+ ions. Figure 6(c) shows the PL excitation with detected wavelength of 695 nm, and only an excited peak at 460 nm is observed. As the Pr3+ ions cannot be directly excited by the excitation of wavelength 460 nm, the result reflects the Ce3+ → Pr3+ energy transfer.
 | Fig. 5. PL emission spectra of Pr, Ce:YAG single crystal under excitation of various wavelengths: (a) 385 nm, (b) 405 nm, (c) 460 nm. |
 | Fig. 6. PL excitation spectra of Pr, Ce:YAG single crystal with various detected wavelengths: (a) 560 nm, (b) 609 nm, (c) 695 nm. |
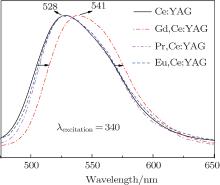
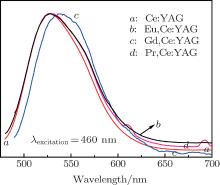
As can be seen in the schematic energy level diagrams of Ce3+ and Gd3+ ions (Fig. 7), the 6P level of the Gd3+ ion is partly overlapped with the 5d level of the Ce3+ ion. The energy transfer is able to occur between Gd3+ and Ce3+ ions in theory. However, most researchers did not pay attention to the energy level transition, because the Gd3+ ion did not induce other longer emission wave bands. In recent years, the Gd3+ -substituted Ce:YAG phosphors have been intensively studied due to its special spectral variation. Yang et al. reported that the Ce3+ emission was red-shifted by Gd3+ substitution due to a modified crystal field splitting in the Gd, Ce:YAG nanocrystalline system.[7] Nishiura et al. studied the high power application in white LEDs using transparent Gd, Ce:YAG ceramics.[12] While for the single crystal, only Latynina et al. reported the properties of Czochralski grown Ce, Gd:Y3Al5O12 single crystal for white light-emitting diode and the corresponding wafers showed better values and improved stability under high temperatures in comparison to the commercial phosphor powders.[13] In this paper, compared with those of Ce:YAG, Eu, Ce:YAG, and Pr, Ce:YAG single crystals, the PL emission of Gd, Ce:YAG under the excitation of 340 nm and 460 nm is depicted in Figs. 8 and 9. The emission spectra of Ce:YAG, Eu, Ce:YAG, and Pr, Ce:YAG single crystals at 528 nm are almost overlapped in Fig. 8, and with the codoped Gd3+ ion, the related emission spectra are red-shifted 13 nm to the emission peak at 541 nm. In Fig. 9, for the PL emission of the Pr3+ and Eu3+ codoped Ce:YAG single crystal, the red-shift spectral peak changes from 528 nm to 531 nm and it is not obvious. However, the width of the emission band is enlarged and it is beneficial to improve the luminescent behaviors of the corresponding devices. For the PL emission of the Gd, Ce:YAG single crystal, the broad band emission is red-shifted from 528 nm to 540 nm. It coincides with Nishiura et al.’ s report. According to Ref. [14], the 5d state of the Ce3+ ion can be adjusted by partially substituting Y3+ or Al3+ site with different types of cations. Because the ionic radius of Gd3+ (1.05 Å ) is larger than that of Y3+ (1.02 Å ) occupying a dodecahedral site in the host lattice of the YAG single crystal, the substitution of the Gd3+ ion causes the Ce– O distance to be shortened, leading to an increased crystal field splitting. It is noted that the crystal field splitting (Dq) is proportional to ∼ 1/r5, where r is the bond length of the activator cation– ligand anion. This larger crystal field splitting further lowers the lowest energy level of the Ce 5d state band and consequently induces a red-shift of the Ce emission. The electroluminescent behaviors are investigated in the following.
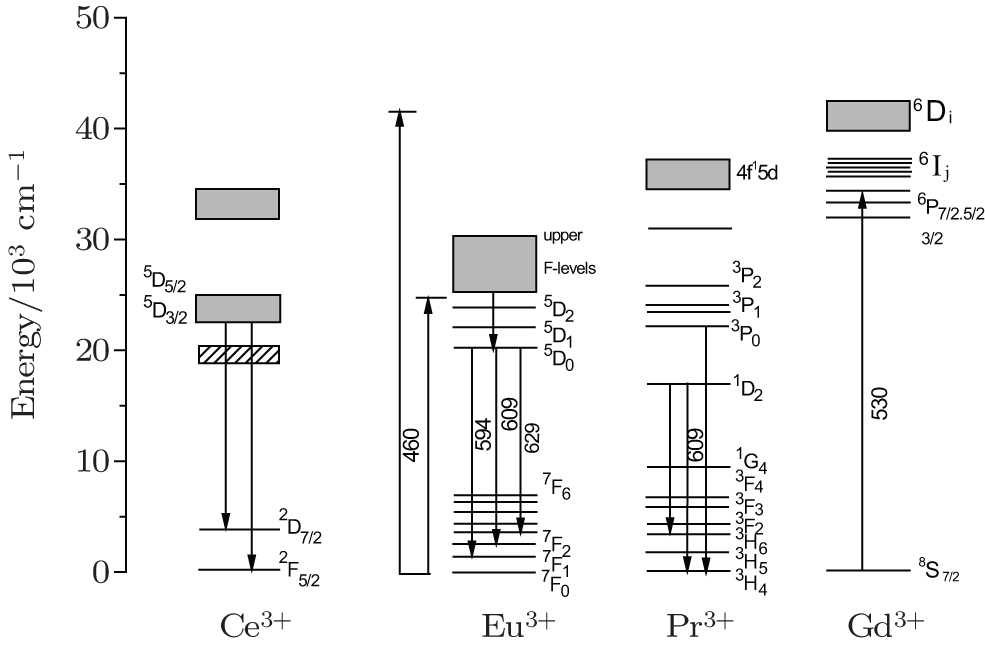 | Fig. 7. Schematic energy level diagrams of Ce3+ , Eu3+ , Pr3+ , and Gd3+ ions. |
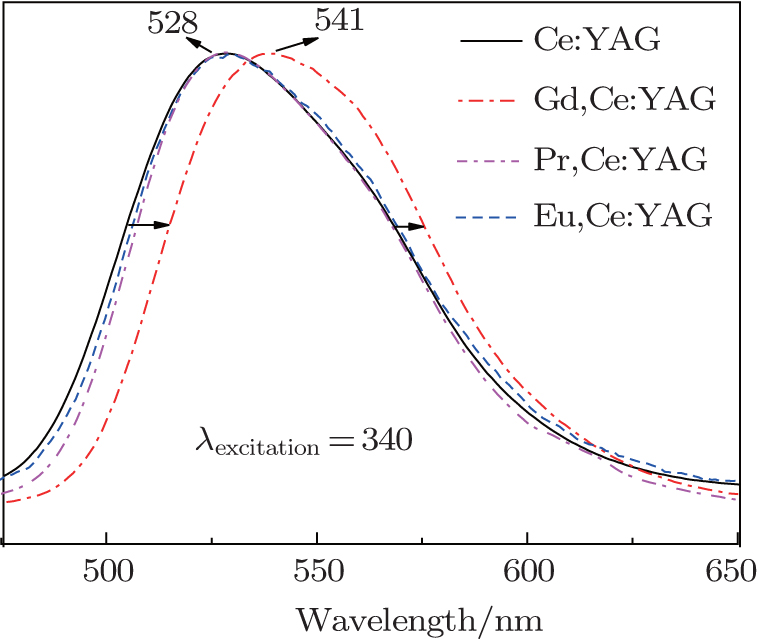 | Fig. 8. The PL emission spectra of R, Ce:YAG (R: Pr3+ , Eu3+ , Gd3+ ) single crystals under 340 nm excitation. |
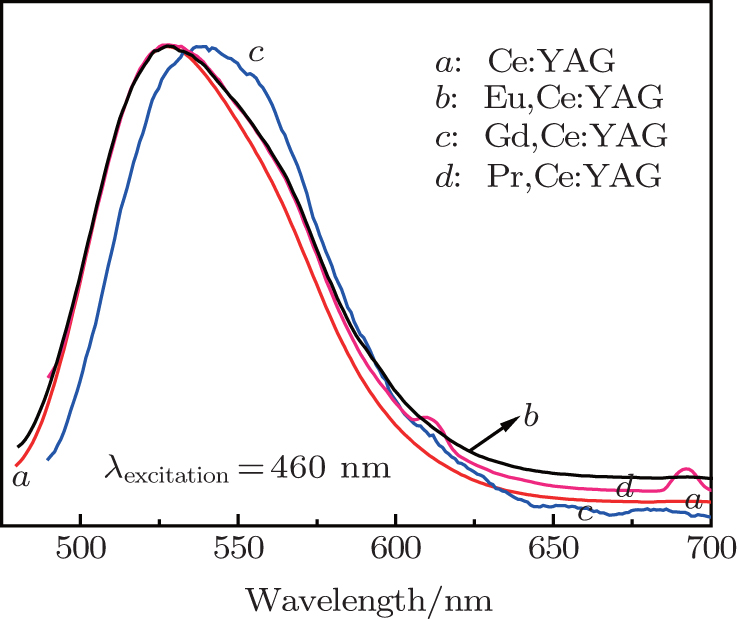 | Fig. 9. The PL emission spectra of R, Ce:YAG (R: Pr3+ , Eu3+ , Gd3+ ) single crystals under 460 nm excitation. |
The excitation band covering from 400 nm to 500 nm is most intense and provides a background for the application of these phosphors in blue InGaN chips. The broad band located from 500 nm to 600 nm provides an ideal yellow light complementary to the blue light emitted by InGaN LED chips to produce white light. Here we choose the 460 nm-LED chips as a basis to improve the electroluminescent properties of WLEDs utilizing R, Ce:YAG (R: Pr3+ , Eu3+ , Gd3+ ) in comparison to the Ce:YAG-based WLED.
When the thickness of the sample is 1 mm, the Ce:YAG-single-crystal-based WLED shows a high luminous efficiency (42.45l m/W) and a color rendering index of 62.8 (Table 1). And it produces a natural white light (5030 K). The Eu, Ce:YAG-single-crystal-based WLED displays a relatively lower luminous efficiency (22.11l m/W) and a color rendering index of 72.9, which gives a cold white light (6777 K). At the same time, the Pr, Ce:YAG-single-crystal-based WLED gives a higher luminous efficiency of 45.86 lm/W, which is almost 2.5 times of that in Ref. [7], and shows a warm white light (4420 K). With the Gd3+ codoped Ce:YAG single crystal, the corresponding WLED shows a luminous efficiency of 41.29l m/W and produces the warmest white light (3663 K). These statistics indicates that via codoping R3+ (Eu3+ , Pr3+ , Gd3+ ) ions in the Ce:YAG single crystal system, the electroluminescent properties of the related WLEDs can be improved with higher color rendering index and warmer white light.
| Table 1. Optical properties of white LEDs using 1.0-mm-thickness R, Ce:YAG (R: Pr3+ , Eu3+ , Gd3+ ) single crystals at the current of 250 mA. |
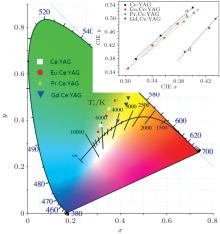
The same result can be concluded from Fig. 10. Figure 10 exhibits the thickness-dependent CIE color coordinates of all as-prepared samples. With the thickness increasing, the CIE x and y values increase and the corresponding points move greatly from the blue region to the yellow-greenish region. For certain kinds of materials (such as Ce:YAG single crystal), the corresponding points are approximately linearly distributed. So we use lines a– d respectively to represent the CIE color coordinates related to all thicknesses of R, Ce:YAG (R: 0, Eu3+ , Pr3+ , Gd3+ ). The lines b– d shift to the more deeper yellow region than that of the Ce:YAG single crystal, which is caused by the strengthened red component light with the codoping ions. In particular, the point of the Gd3+ codoped Ce:YAG single crystal moves the deepest in the yellow region and causes a higher color temperature (warmer white light). This result is attributed to the red-shift phenomenon, the emission peak shifts to the longer wavelength with the codoping Gd3+ ions. The enhanced performance of Eu, Ce:YAG and Pr, Ce:YAG single crystals is due to the broadened emission peak at 528 nm and the additional red wave band.
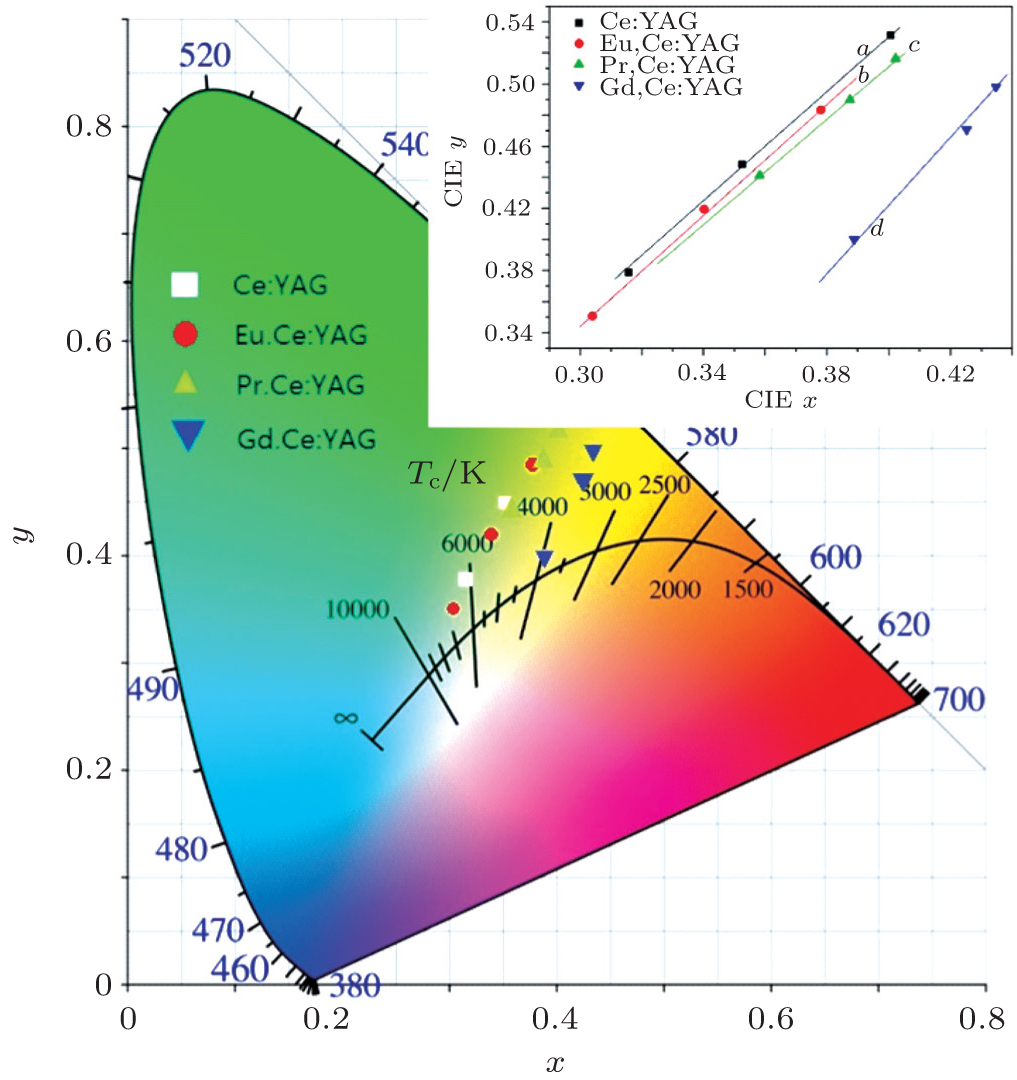 | Fig. 10. The CIE color coordinates of WLEDs using R, Ce:YAG (R: Pr3+ , Eu3+ , Gd3+ ) single crystals of different thicknesses (0.5 mm, 1.0 mm, 2 mm). |
The spectral properties of yellow-emitting Ce:YAG single crystal phosphors were varied via codoping Eu3+ , Pr3+ , and Gd3+ ions. The characteristic peaks of Eu3+ at 528 nm, 594 nm, 609 nm, and 629 nm were observed under the excitation of 400 nm. The Ce3+ ion acts a sensitizer for the Eu3+ luminescence. The Ce3+ ion is excited to the 2D0 (5d) state by optical excitation, then all of the energy is transferred to the 5D1 level of Eu3+ . The 5D0 → 7F1.2.3 transitions occur after the non-radiative transition 5D1 → 5D0. The emission peaks at 528 nm and 609 nm were detected due to the Ce3+ → Pr3+ transition, in which the Ce3+ ion is used as a sensitizer, too. Red-emitting bands are abundant in the PL emission spectra of the Pr3+ codoped Ce:YAG single crystal system. A red-shifted phenomenon was observed in the PL emission spectrum of Gd, Ce:YAG due to the larger crystal field splitting. In comparison to the Ce:YAG single crystal, WLEDs utilizing Eu, Ce:YAG and Pr, Ce:YAG obtained relatively higher CRI of 72.9 and warmer white light (4420 K). The Eu, Ce:YAG-based WLED gave the warmest white light (3663 K) without losing luminous efficiency (41.29l m/W).
| 1 |
|
| 2 |
|
| 3 |
|
| 4 |
|
| 5 |
|
| 6 |
|
| 7 |
|
| 8 |
|
| 9 |
|
| 10 |
|
| 11 |
|
| 12 |
|
| 13 |
|
| 14 |
|