

What makes the Tc of FeSe/SrTiO3 so high?*
[Lee Dung-Haia), b)  ]
]
]
|
|


†Corresponding author. E-mail: dunghai@berkeley.edu
*Project supported by the U.S. Department of Energy, Office of Science, Basic Energy Sciences, Materials Sciences and Engineering Division (Grant No. DE-AC02-05CH11231).
This paper reviews some of the recent progresses in the study of high temperature superconductivity in the interface between a single unit cell FeSe and SrTiO3. It offers the author’s personal view of why Tc is high and how to further increase it.
Raising the superconducting transition temperature (Tc) to a point where applications are practical is one of the most important challenges in science. In the history of high Tc superconductivity there are two landmark events − the discovery of the copper-oxide superconductor in 1986, [1] and the discovery of iron-based superconductor (FeSC) in 2006.[2]
For the copper-oxide superconductors, the higest Tc, under ambient pressure, is achieved in HgBa2Ca2Cu3O8 (Tc = 134 K). For the FeSCs, Tc has been raised to 55 K in SmO1− xFxFeAs in 2008.[3] This sets the record for FeSCs until quite recently. In 2012, an anomalously large superconducting-like energy gap was seen by scan tunneling microscopy (STM) in a one unit cell (1 UC) thick FeSe film grown on the TiO2 terminated (001) surface of SrTiO3 (STO).[4] This report stirred up lots of interest because the observed energy gap invites the optimism that the transport Tc is very high.
Subsequent angle-resolved photoemission spectroscopy (ARPES) studies have shown that this superconducting-like energy gap opens at temperatures ranging from 55 K to 75 K[5– 9] (the value depends on the precise substrate, e.g., whether it is STO or BaTiO3, and the growth condition). However the anticipated high transport Tc has not been established until, possibly, two recent experiments. The first is an in-situ four-probe transport measurement which shows the onset of superconducting I– V characteristics at a temperature higher than 100 K.[11] The second is a recent mutual inductance measurement showing a ∼ 60 K diamagnetic transition in a sample where the ARPES gap opens around 65 K.[10] Of course both experiments need further confirmation.
From the ARPES point of view, the observed energy gap behaves as one expects for the superconducting gap. (i) The node-free energy gap is adhered to the Fermi surface and is particle– hole symmetric.[6] This means that along momentum cuts going through the Fermi surface the energy gap minimum always occurs on the Fermi surface. (ii) The energy gap evolves with temperature as an order parameter does in a second-order phase transition.[5– 9] The particle– hole symmetry makes it unlikely that the gap is due to particle– hole (rather than particle– particle) condensation (e.g., certain kind of density-wave order). Because typically in such a kind of order it requires the breaking of translation symmetry to open an energy gap, and to produce a particle– hole symmetric nodeless gap the Fermi surface needs to be completely nested by the ordering wavevector(s). Such nesting is not observed in the measured Fermi surface.[5– 9] Although this issue deserves further scrutiny, in the rest of the paper, we will assume the energy gap seen by ARPES is due to Cooper pairing, and when discussing ARPES results we use “ Tc” to denote the gap opening temperature.
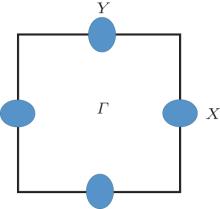
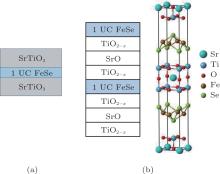
The Fermi surface of 1 UC FeSe film on STO shows only the electron pockets. This is schematically shown in the “ unfolded” Brillouin zone (i.e., the Brillouin zone corresponding to a real space unit cell enclosing one iron atom) in Fig. 1. In particular, the hole pockets at the Brillouin zone center, which are observed in other FeSCs, are absent. Because the presence of these hole pockets is demanded by charge neutrality (since the stoichiometric FeSe has 2 valence electrons per unit cell), the lack of them implies the FeSe film is electron doped. It is widely believed (but not yet proven) that the doping originates from the oxygen vacancies present on the STO side of the interface. Microscopically one can imagine an oxygenvacancy- bordered Ti atom donating some (averaged number of) electrons to the Se above it (see Fig. 2).
 | Fig. 1. A schematic illustration of the Fermi surface of 1 UC FeSe/SrTiO3. Here, the Brillouin zone corresponds to a real space unit cell enclosing one Fe atom. |
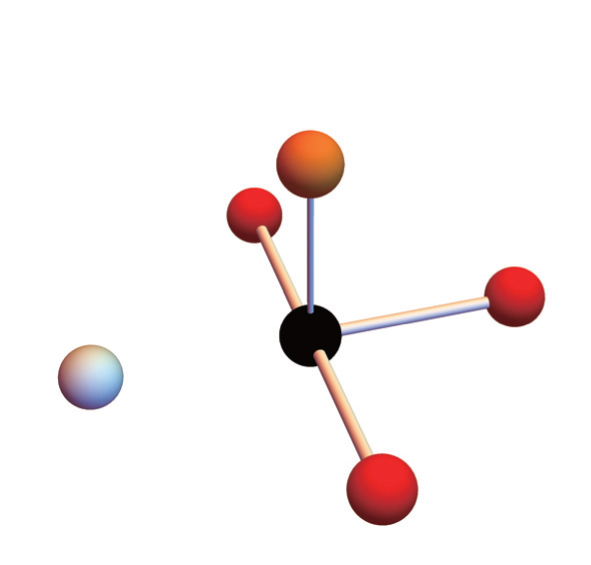 | Fig. 2. A schematic illustration of a Ti (black) neighboring three in-plane oxygen (red) and an oxygen vacancy (gray). It transfers some charges hence establishes a weak bond with the Se atom (orange) above it. |
The Fermi surface of 1 UC FeSe/STO is very similar to that of AxFe2− ySe2[12, 13] (where A = K, Cs, Rb, Tl, etc., and Tc ∼ 30 K) as well as that of (Li1− xFex)OHFe1− ySe (Tc = 41 K)[14] determined in a recent ARPES experiment.[15] In addition, it is also very similar to the Fermi surface of the potassium (K) doped 3 UC FeSe/STO (Tc, max ∼ 48 K).[16] The fact that strong Cooper pairing exists in systems without the hole pockets definitely rules out theories where the approximate nesting of the electron and hole pockets is important for high temperature superconductivity.
When comparing the Tc of AxFe2− ySe2 (∼ 30 K) (sample a), (Li1− xFex)OHFe1− ySe (41 K) (sample b), the K-doped 3 UC FeSe/STO (48 K) (sample c), and the 1 UC FeSe/STO (55– 75 K) (sample d), with that of bulk FeSe (∼ 8 K) it is important to keep the following facts in mind. The first is that all of samples a– d show similar electron-pocket-only Fermi surface in contrast to bulk FeSe which has both electron and hole pockets. This fact suggests that electron doping enhances Tc. Second, despite both being FeSe thin films on STO and having very similar electron pockets, the maximum gap of 1UC FeSe/STO (14– 18 meV) is significantly larger than that of the K-doped 3 UC FeSe/STO (∼ 9 meV).[16] This suggests that electron doping alone cannot account for the full enhancement of Cooper pairing strength in 1 UC FeSe/STO. Furthermore it is important to note that for K-doped 3 UC FeSe/STO the doping is achieved through the charge transfer from K, while for the 1 UC FeSe/STO the doping comes from the STO substrate. In later discussion, we shall argue that the FeSe ↔ STO charge transfer is critically important for the extra Tc enhancement.
In addition to what has already been discussed, the following facts are also useful hints for the Tc enhancement mechanism of 1 UC FeSe/STO. (i) STO is a special substrate, i.e., just thinning FeSe to 1 UC thick is not sufficient to give rise to high Tc. Indeed when thin FeSe films were grown on, e.g., graphene/SiC(0001), the maximum Tc is that of bulk FeSe, and is reached in thick films.[17] (ii) The fact that the a-b lattice constant of (Li1− xFex)OHFe1− ySe is nearly the same as bulk FeSe suggests tensile strain is not the reason for Tc being enhanced from 8 K to 41 K. Moreover by carefully changing the detailed properties of the interface Ref. [8] concluded that tensile strain only has a small effect of Tc. (iii) The effective mass of the Fermi-crossing electron band in 1UC FeSe/STO is about the same as that of (Li1− xFex)OHFe1− ySe but both are considerably smaller than that of (Tl, Rb)xFe2− ySe2.[15] However the Tc of the former two materials are higher than the latter. This speaks against the high Tc in 1 UC FeSe/STO is due to a stronger electron– electron correlation.
The foremost telling clue for the origin of the Tc enhancement in 1 UC FeSe/STO comes from the ARPES results reported in Ref. [9]. Similar to earlier findings a maximum gap ∼ 14 meV was observed and the gap closes at Tc ∼ 58 K. However the most striking finding is the observation of “ replica bands” . In the left panel of Fig. 3 we reproduce the data from Ref. [9]. A replica of the parabolic electron-like band is observed ∼ 100 meV away in the higher biding energy direction. Note that despite the fact that it is situated far below the Fermi energy the replica band stops where the main band crosses the Fermi level. In addition, a faint replica of the non-Fermi-level-crossing hole-like band can also be seen. Again, the energy separation between the main band and the replica band is approximately 100 meV. Moreover as the main band disperses toward the Fermi energy it “ bends back” . This is a characteristic phenomenon associated with the opening of an energy gap on the Fermi surface. The same back bending is weaker but observable for the replica band. Lastly high statistics ARPES data[9] (not shown here) even shows the second replica band 200 meV away from the main band.
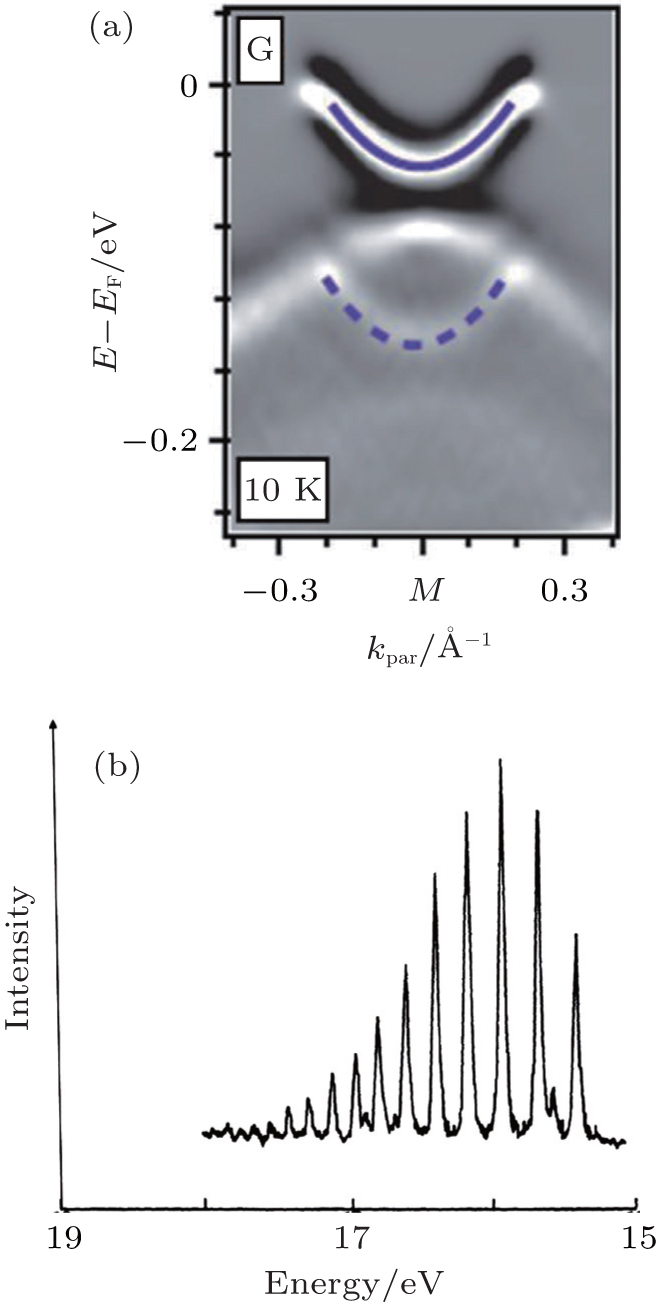 | Fig. 3. (a) Reproduction of data from Ref. [9]. What is shown is the second energy derivative of the ARPES intensity as a function of momentum around the M point of the Brillouin zone. (The M point is the equivalence of the X and Y points in Fig. 1.) (b) A reproduction of the angle-integrated photoemission data of H2 molecular gas from Ref. [18]. |
To understand the origin of the replica band, in the right panel of Fig. 3 we reproduce the angle-integrated photoemission data of the H2 molecular gas reported in Ref. [18]. Interestingly, in addition to the main photoemission peak there are a series of replica peaks. A closer examination revealed that the energy separation between the adjacent peaks is the energy of the bond stretching vibration quanta. The consensus attributes this phenomenon to the “ vibron shake off” , i.e., each replica peak corresponds to photo emitting an electron plus exciting an integer number of vibration quanta.
Comparing the H2 replicas with those observed in FeSe/STO motivated us to think that the replica bands are also due to shaking-off of certain ∼ 100 meV bosonic excitation. Interestingly pure STO has a very flat optical phonon band centered around 100 meV.[19– 21] This phonon band is primarily oxygen-vibration in character and is separated from other phonon bands by a substantial energy gap. Naturally this motivates us to think that the boson in question are these high energy STO phonons. The facts that the replica of the Fermi level crossing band terminates at the momentum where the main band crosses the Fermi energy, and in the superconducting state it bends back at the same momentum where the main band bends back, rule out other explanations. These explanations include the replica bands being the quantum well state, or they are the main band rigidly shifted downwards in energy because the potential energy in certain poorly connected part of the sample is different from other regions. Finally the strongest support of our phonon shake-off explanation is the recent observation of ∼ 100 meV replicas of the surface bands of pure STO.[22]
In addition to the replica bands, there are several other findings of Ref. [9] that are significant. (i) The ARPES band structure of films with thickness ≥ 2 UC resembles that of bulk FeSe. In particular it shows both hole and electron pockets. (ii) The replica bands are only observed for 1 UC FeSe film– films with thickness ≥ 2 UC do not show replica bands. These multi UC films also do not show any appreciable superconducting gap.[9] (iii) The multi UC films show the splitting between the xz and yz bands near the M point which acts to reconstruct the electron pockets. Such band splitting is characteristic of the 90° rotation symmetry breaking (i.e., nematicity) found in other iron pnictides[23] and bulk FeSe.[24– 26] However the lack of band folding associated with the stripe antiferromagnetic (AF) order suggests that, like bulk FeSe, [27, 28] these films are nematic but not stripe AF ordered. (iv) The 1 UC film does not show the xz/yz band splitting or any sign of strong nematic fluctuation. The last statement is drawn from the fact that STM quasiparticle interference studies of 1 UC FeSe/STO do not show any sign of C4 symmetry breaking.[29] We interpret this as indicating the weak response of the electronic structure to the inevitable anisotropic local environment around impurities, hence the small nematic susceptibility/fluctuation.[30]
We interpret fact (i) as due to the confinement of the doped electrons to the bottom FeSe layer by the Coulomb force between the doped electrons and the positive charge left in STO. ARPES is most sensitive to the top surface, which is nearly undoped, hence the observed bandstructure resembles that of bulk FeSe. Fact (ii) suggests the interaction between the STO phonon and the transferred charge from STO (which localize in the bottom FeSe layer in the case of multi UC FeSe film) is important for the replica bands. In addition we attribute the absence of the proximity induced superconducting gap on the top surface of the multi-layer FeSe films to the mismatch of the Fermi surface size which acts to suppress the electron tunneling between the top and bottom layers (due to momentum conservation) (see later discussion for an explanation). We do not expect strong coupling to the STO phonon in K-doped 3 UC film, the doping is not due to the charge transfer from STO. These arguments, plus the fact that despite similar doping level the Tc of the 1 UC film is significantly higher than that of the K-doped 3 UC film, suggests a connection between the strong coupling between the FeSe electron and STO phonon and the extra Tc enhancement in the 1 UC film. Lastly facts (iii) and (iv) imply that, unlike many other pnictides, [31] the highest Tc sample has the weakest nematic susceptibility.
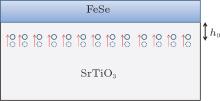
Since STO is almost a ferroelectric, it is natural to think the electric field set up by the charge transfer at the interface can induce a layer of ordered dipoles. Note that the free carriers in STO, due either to oxygen vacancies or the Nb doping (in all the ARPES studies the STO is doped with Nb), will screen the electric field away from the interface. Hence we expect the induced dipole layer to localize near the interface. These dipoles are due to the relative displacements of the Ti cations and the oxygen anions (as in bulk STO). Hence, the vibration of the oxygen anions will lead to a modulating dipole potential in the FeSe layer. A caricature of the situation is shown in Fig. 4.
 | Fig. 4. The vibration of the oxygen anions in the interface dipoles exerts a time-dependent dipole potential on the electrons in FeSe causing the electron– phonon coupling responsible for the replica bands. Here, h0 is the set back distance between the dipole layer and the Fe plane in the FeSe layer. |
Let δ Pz be the change in the dipole moment due to the displacement of the oxygen anions (in direction perpendicular to the interface)
 |
Here, x, y are the coordinates in planes parallel to the interface, and the origin of the z coordinate is chosen at the Fe plane in FeSe. Relative to the Fe plane the dipole layer sits at z = − h0. The induced change of the dipole potential in the Fe plane due to a “ frozen” oxygen displacement is given by[9]
 |
After Fourier transform the above result with respect to x, y, we obtain
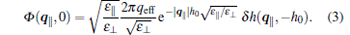 |
Here, q‖ is the wavevector parallel to the interface, and ε ‖ , ε ⊥ are the dielectric constants parallel and perpendicular to the interface, respectively. They contain the contribution from both STO and the FeSe film. Because the FeSe electrons are confined to move parallel to the interface, they only contribute to ε ‖ . Aside from the screening from the FeSe carriers we expect STO (which has cubic crystal symmetry in the bulk) to contribute about equally to ε ‖ and ε ⊥ . This leads us to expect the total dielectric constant ε ‖ to be significantly bigger than ε ⊥ .
Equation (3) leads to the following electron– phonon coupling term in the Hamiltonian

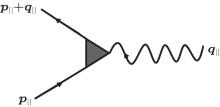
where ψ annihilates electrons in FeSe. Thus the electron– phonon coupling constant (see Fig. 5) depends on q‖ via
 |
 | Fig. 5. The electron phonon interaction matrix element. The fact that the replica bands follow the main band dispersion so closely suggest the electron– phonon matrix element strongly peaks at q‖ = 0. |
The fact that ε ‖ > > ε ⊥ results in two important effects: (1) The strength of the electron– phonon coupling is enhanced by 

The forward-focusing electron– phonon interaction in Eq. (4) explains why the replica band follows the dispersion of the main band so closely. Indeed, had the e– ph coupling allowed a wide range of momentum transfer, the image of the main band would consist of the superposition of many replica bands each displaced from the main band by a different momentum. If so the dispersion of the replica band would have been blurred out.
Through the electron– phonon interaction discussed above the high energy phonon generates an effective electron– electron attraction. Because the energy of the involved phonon (∼ 100 meV) is considerably larger than the electron bandwidth (∼ 65 meV) we can simply “ integrate out” the phonon to obtain an instantaneous effective attraction[9]
 |
where 
 |
Here, the momentum integrals are performed along the Fermi surface, and Δ (k) is the gap function caused by the electronic pairing, Ueff enhances (suppresses) pairing if λ > 0 (λ < 0).
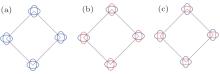
For 1 UC FeSe/STO several scenarios for Δ (k) have been discussed in the literature. They are shown in Fig. 6, where colors denote the sign (say, blue: positive, red: negative). In the case of Fig. 6(a)λ is clearly positive and the electron– phonon interaction will enhance Tc. However for Figs. 6(b) and 6(c), the situation is not so clear. First of all, either the breaking of the glide plane symmetry (i.e., translation by an Fe– Fe distance followed by a reflection about the Fe plane) by the substrate or spin– orbit interaction will split the two Fermi surfaces where they cross. This hybridization effect, even very weak, will induce gap nodes at the crossing momenta for Fig. 6(b). Such gap nodes are not observed in recent high resolution ARPES measurement of the superconducting gap as a function of momentum.[32] Figure 6(c) where the gap function changes sign between the two hybridization-split Fermi surfaces is unfavored by recent STM study examining the change of quasiparticle interference as a function of applied magnetic field as well as the impurity induced in-gap states for scalar and magnetic impurities. The result suggests that there is no sign change in the gap function.[29] It is also unfavored by the best gap function that fits of the measured energy gap in ARPES.[32] Therefore we believe that the Δ (k) of 1 UC FeSe/STO is qualitatively represented Fig. 6(a).
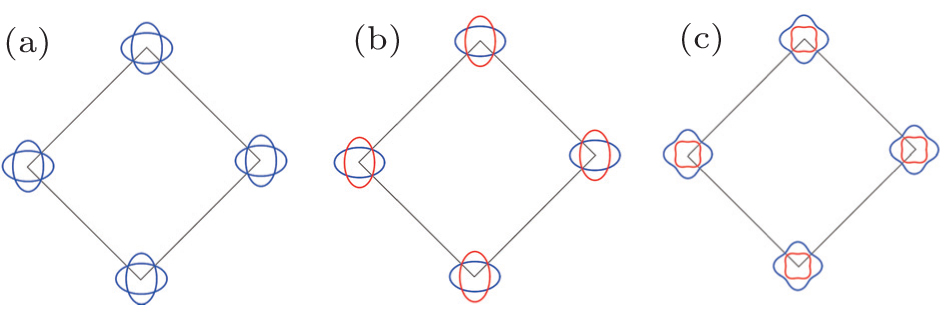 | Fig. 6. (a)– (c) Schematic representations of three scenarios for the gap function in FeSe/STO. Here, the color designates the sign of the gap function (blue: + and red: − ). It is interesting that the Fermi surface splitting at the crossing momenta (as depicted in panel (c)) is not observed in the ARPES result of Ref. [32]. |
To summarize what has been discussed so far, the following two mechanisms cooperatively contribute to the high Tc of the 1 UC FeSe/STO: (I) A pure electronic pairing mechanism which also operates in AxFe2− ySe2, (Li1− xFex)OHFe1− ySe and the K-doped 3 UC FeSe/STO. Sufficient electron doping is important for this mechanism to operate fully. Although there are still different opinions we believe that this mechanism is primarily due to the antiferromagnetic interaction.[33] (II) The interaction between the FeSe electron and STO phonon. This interaction only exists in 1 UC FeSe/STO which causes extra Tc enhancement in this system.
Item (II) motivates us to propose the sandwich shown in Fig. 7(a) where there are two, rather than one, interfaces between STO and FeSe. Compared with FeSe/STO the phonon mediated attraction will be twice as strong. As a result Tc will be more than doubled. A variant of this proposal is the bulk crystal, Fe2Se2SrTi2O5− 2x, shown in Fig. 7(b) where each FeSe layer is sandwiched on both sides by TiO2 planes. The structural stability (or metastability) of this and related crystals has been studied by Coh et al.[34]
 | Fig. 7. The proposed high Tc structures. (a) FeSe makes interfaces on both sides with STO. Growing this structure by, say, molecular beam epitaxy is very challenging because the required growth temperature of STO can nearly melt FeSe. (b) A bulk crystal in which each FeSe layer is sandwiched between two TiO2 layers. In order to ensure charge transfer it is important to maintain the existence of oxygen vacancies in the TiO2 planes. |
In the remaining of the paper, we focus on the antiferromagnetic interaction which, we believe, is the main pairing mechanism in iron-based superconductors. The first question we ask is why Cooper pairing is so weak in bulk FeSe (Tc ∼ 8 K).
In recent years, many experimental and theoretical studies have concluded that the correlation strength in most iron based superconductors, with the exception of LaFePO, is intermediate to strong.[35, 36] In addition most of them possess fluctuating local moments.[36, 37] Therefore we adopt the picture that the low energy degrees of freedom include the Fermi-surface-forming itinerant carriers and fluctuating local magnetic moments. Because the electrons making up the local moments can interchange with those forming the Fermi surface, there is an “ Anderson hybridization” term between them. In such a system due to the competition between the Anderson hybridization and the direct exchange interaction between the local moments, there can be two distinct electronic phases. In the first phase the exchange interaction between the local moments dominates. As a result the local moments form a magnetic state (either long range ordered or quantum disordered) with the remaining Fermi-surface-forming itinerant carriers coupling weakly to them. In heavy fermion systems this is called the “ magnetic metal” phase. The second phase is realized when the Anderson hybridization dominates. In that case the conducting carriers have a mixed character: partly as the local-moment-forming electron and partly as the Fermi-surface-forming electron. In heavy fermion systems this is the mixed valence or the heavy Fermi liquid phase. Here, the charge carriers “ inherit” the exchange interaction between the local moments and can form strong Cooper pairing. Apparently the optimal condition for Cooper pairing occurs near the phase transition between the two phases where the itinerant quasiparticle is poorly defined and the effective magnetic interaction is the strongest.
In terms of the language used above, we believe that bulk FeSe is in the magnetic metal phase (although the local moments form a “ nematic quantum disordered state” rather than a magnetic long-range ordered state.[38]) In contrast we believe that AxFe2− ySe2, (Li1− xFex)OHFe1− ySe, the K-doped 3 UC FeSe/STO and the 1 UC FeSe/STO are in the mixed valence phase. Thus while the charge carriers do not have strong antiferromagnetic interaction in bulk FeSe, those in the other four systems do. Unlike heavy fermion systems the size of the Fermi pockets in the magnetic metal and mixed valence states do not have to differ substantially. This is because the stoichiometric FeSe has two valence electrons per unit cell and the Fermi surface consists of compensated electron and hole pockets.
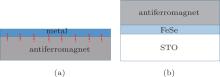
The above reasoning suggests a hybrid structure where a thin metal film forms an interface with an antiferromagnet (Fig. 8(a)). If the Anderson hybridization is strong at the interface the carriers localized at the interface can have mixed itinerant and local moment character. This can result in strong antiferromagnetic interaction between the charge carriers and strong Cooper pairing. Thus another strategy to enhance the Tc of 1 UC FeSe/STO is to deposit an antiferromagnetic insulator, e.g., La2CuO4, on top of it (Fig. 8(b)). In this way the FeSe electrons can have the best of both worlds, namely, La2CuO4 can enhance the antiferromagnetic interaction and the STO phonon can further increase the Cooper pairing caused by the magnetic interaction.
 | Fig. 8. Proposals of high Tc structures. (a) The interface between a metal and an antiferromagnet consisting of local moments. The red dashed lines represent single particle hybridization. (b) A variant of the FeSe/STO where additional layers of local-moment antiferromagnet are grown on top of FeSe. |
Some of the content of this paper has already been published in Ref. [
| 1 |
|
| 2 |
|
| 3 |
|
| 4 |
|
| 5 |
|
| 6 |
|
| 7 |
|
| 8 |
|
| 9 |
|
| 10 |
|
| 11 |
|
| 12 |
|
| 13 |
|
| 14 |
|
| 15 |
|
| 16 |
|
| 17 |
|
| 18 |
|
| 19 |
|
| 20 |
|
| 21 |
|
| 22 |
|
| 23 |
|
| 24 |
|
| 25 |
|
| 26 |
|
| 27 |
|
| 28 |
|
| 29 |
|
| 30 |
|
| 31 |
|
| 32 |
|
| 33 |
|
| 34 |
|
| 35 |
|
| 36 |
|
| 37 |
|
| 38 |
|