


Effects of IIIB transition metals on optoelectronic and magnetic properties of HoMnO3: A first principles study
[Aliabad H. A. Rahnamayea)  , Yalcin Battal G.
b) ]
, Yalcin Battal G.|
|


†Corresponding author. E-mail: Rahnama@hsu.ac.ir
The optoelectronic and magnetic properties of pure HoMnO3 and Ho0.67 T0.33MnO3 ( T = La, Y) alloys in hexagonal phase are theoretically investigated by using the first-principles calculations. The investigations are performed by means of the density functional theory through using the spin polarized generalized gradient approximation plus the Hubbard potential (SPGGA + U, Ueff = 3 eV). The studied material HoMnO3 exhibits two indirect band gaps: 1.58 eV for the spin-up state and 0.72 eV for the spin-down state along the S– G direction within the SPGGA + U approximation. It is found that the band gap of pure HoMnO3 for the spin-up state increases with increasing La and Y dopants. The results show that all of the studied materials have semi-metallic behaviors for the spin-up state and semiconducting character for the spin-down state. The substitutions of La and Y for Ho in HoMnO3 cause the static dielectric constant ( ε0) to increase in the x direction but to decrease in the z direction. The calculated optical conductivity spectrum of HoMnO3 in a low energy range is in good agreement with the recent experimental data.
Occurrences of the magnetic and ferroelectric orders in HoMnO3 are the main reasons for investigating the electronic, optical, and magnetic properties of this compound.[1] Moreover, the passion for studying the magneto– electronic interaction mechanism has also induced scientists to make their efforts to explore this system as a material in new spintronic devices.[2] It is fascinating to note that we can use the coupling effects for new types of devices in microelectronic and digital memory applications; [3] they are indeed limber frameworks for developing novel functional materials.[4] Anomalies in the dielectric constants, the linear expansion coefficients, and the phonon frequencies suggest coupling between the magnetic and the ferroelectric orders at low temperatures in these systems.[5]
The rare earth manganites or ferroelectrics like RMnO3, RMn2O5, and R2Mn2O7 (R = rare earth) compounds are a group of the perovskite families with interesting properties that exhibit both magnetic order and ferroelectricity[3] in the same phase.[2] The RMnO3 systems are crystallized in hexagonal (with P63cm space group) and orthorhombic (with P63mmc space group) structures.[6] Crystallizing of the rare-earth manganites in the two kinds of structures relies on the ionic radius of the R atom. The RMnO3 manganites with smaller ionic radii (R = Sc, Y, Ho, Er, Tm, Yb, Lu) are in the hexagonal structure.[2] The hexagonal manganites are ferroelectric at high temperatures (over Tc ≈ 900 K)[7] and can be stabilized in large radius cation systems.[8] Gao et al. showed that the increase of the pressure induces a transition from hexagonal to orthorhombic phase in structure.[6] Their measurements of x-ray diffraction on magnetic multiferroic hexagonal RMnO3 (R = Y, Ho, Lu) verified that the hexagonal structure is stable below ∼ 20 GPa. The results obtained by Makhnev et al. showed that hexagonal RMnO3 is a charge-transfer insulator.[2]
HoMnO3 is a member of the RMnO3 family, and its hexagonal and orthorhombic structures have been extensively studied. The antiferromagnetic behavior of HoMnO3 is observed below TN = 75 K.[4] In zero field, Ho+ 3 orders antiferromagnetically with the moments aligned along the hexagonal c direction, and the magnetic structure of Ho+ 3 remains unchanged in applied electric fields up to 1 × 10⁷ V/m below 40 K.[9] An unusual antiferroelectric-like behavior is also observed above 40 K.[10] In the YMnO3 compound with P63cm space group, the ferroelectricity properties are observed at 800 K. Lonkai et al. reported that HoMnO3 and YMnO3 compounds are isomorphic materials.[1]
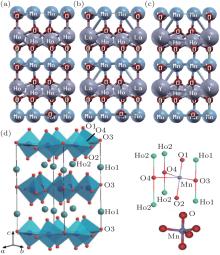
In this paper, we investigate the optoelectronic and magnetic properties of pure HoMnO3 and Ho0.67T0.33MnO3 (T = La, Y) alloys. There are two symmetric positions for the Ho element (Ho1 and Ho2). In comparison with the Ho2 site, the Ho1 site has a higher symmetry and is more stable; therefore we substitute La and Y to the Ho1 site as shown in Fig. 1. We use the hexagonal structure with space group P63cm (space group No. 185) in the ferroelectric state. In this structure, one Mn atom and five adjacent oxygen atoms form a MnO5 trigonal bipyramid. It is worthwhile noticing that in view of symmetry, there are two nonequivalent Ho atoms, four nonequivalent O atoms, and one Mn atom in the unit cell of the system. We use the experimental lattice constant and then find theoretically the lattice constants by optimizing the total energy with respect to the unit cell volume of the crystal. Our obtained structural properties of the pure HoMnO3 and Ho0.67T0.33MnO3 (T = La, Y) compounds are presented in Table 1.
 | Fig. 1. Crystal structures of (a) HoMnO3, (b) Ho0.67La0.33MnO3, (c) Ho0.67La0.33MnO3, and (d) HoMnO3 cited from Ref. [4]. |
The rest of this article is organized as follows. We provide the technical details of calculations in Section 2. Our results are given in Sections 3– 6. Some conclusions are drawn in Section 7.
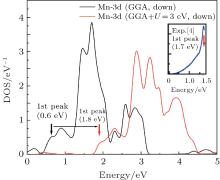
The full potential linearized augmented plane wave (FP-LAPW) method based on the density functional theory is used for the optoelectronic calculations with the Wien2k code.[11] For calculating the exchange– correlation potential, the spin polarized generalized gradient approximation plus the Hubbard potential (SPGGA + U)[12, 13] is used. Selected muffin-tin radii are given in Table 1. For the optoelectronic calculations, we use a dense k-mesh, leading to 1000 k-points in the irreducible first Brillouin zone. In the calculations, the diagonal density matrix U[14, 15] is identical for all Coulomb and exchange interactions and we use the self-interaction correction (SIC) as implemented in the Wien2k code. There are several methods for calculating Ueff.[16, 17] The results of the density of states (DOS) within the SPGGA (Ueff = 0 eV) show that the Mn 3d state is located at lower binding energies compared with the experimental results, as shown in Fig. 2. We can shift the position of the Mn 3d state toward larger binding energies with increasing Ueff. By adjusting the first main peak of the Mn 3d state to the experimental value about 1.7 eV, [4] the effective Hubbard parameter Ueff = 3 eV is obtained.
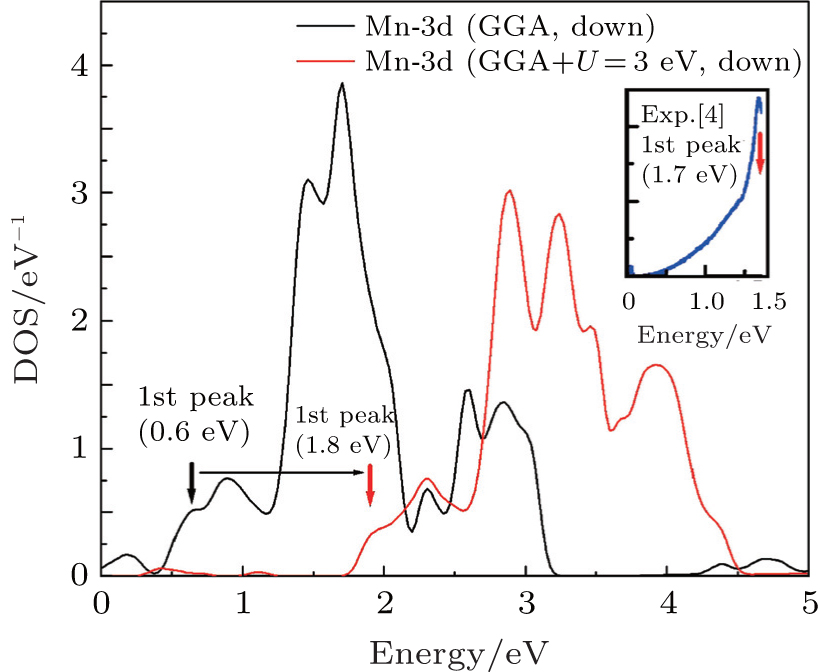 | Fig. 2. Mn 3d partial DOSs calculated by using GGA and GGA + U (U = 3 eV). |
| Table 1. Obtained structural, electrical, magnetic, and optical data for Ho1− xTxMnO3 (x = 0, 0.33; T = La, Y) together with results of the others for comparison. |
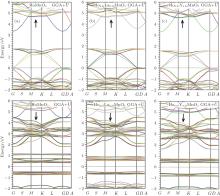
The physical properties of compounds are directly or indirectly related to the electronic band structures. The band structures of the studied materials are calculated along the high symmetry directions in the primitive Brillouin zone (Fig. 3), and the results are shown in Fig. 4. The Fermi levels in all the plots are all shifted to zero on the energy scale. The band gaps of all considered structures are presented in Table 1 for the spin up states. The obtained indirect band gaps for HoMnO3 are 1.67SPGGA eV and 1.58SPGGA+ U eV (0.62SPGGA eV and 0.72SPGGA+ U eV) for the spin up (down) states in the S → G direction. Our results are in close agreement with the experimental values (1.5 eV[2] and 1.7 eV[18]). The results show that all of the studied materials have semi-metallic behaviors for the spin-up states due to the electronic bands crossing the Fermi level and semiconducting character for the spin-down states. As shown in Fig. 4, for the spin-up states, the band gap of the material appears on the top of the Fermi level from 1.7 eV to 3.6 eV. Substitutions of La and Y for Ho in HoMnO3 cause the band gaps in SPGGA and SPGGA + U to increase.
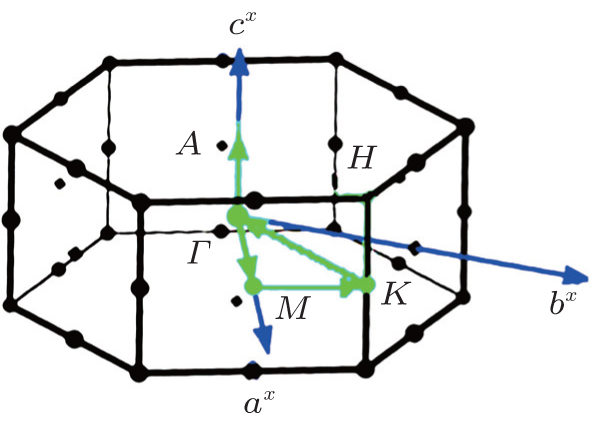 | Fig. 3. Selected directions in the primitive Brillouin zone. |
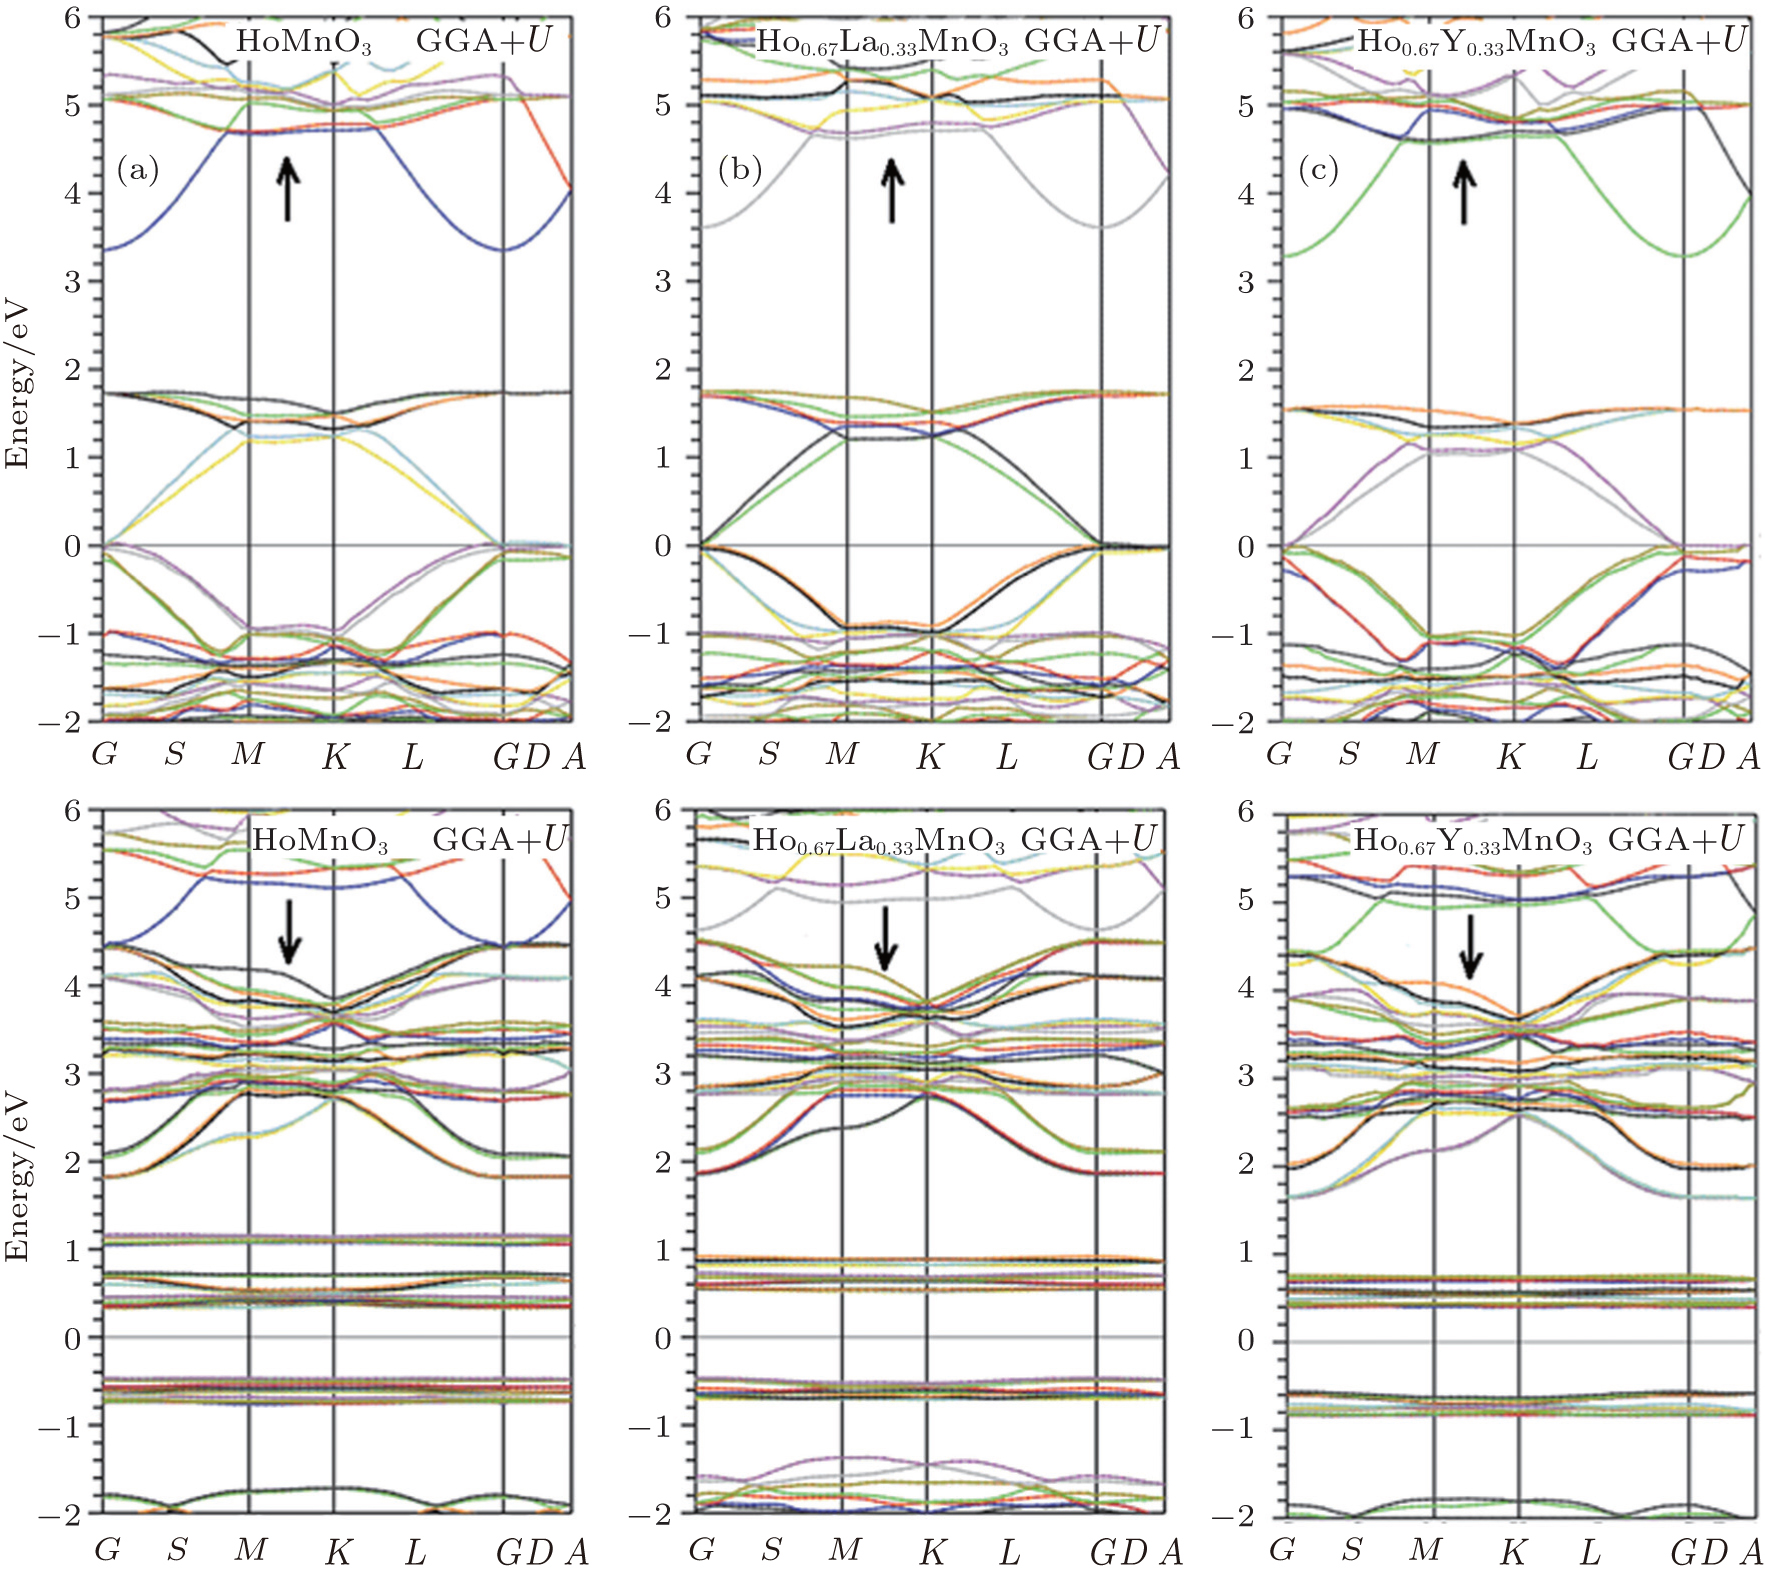 | Fig. 4. Band structures for Ho1− xTx MnO3: (a) x = 0; (b) x = 0.33, T = La; (c) x = 0.33, T = Y. |
The analysis of the partial DOS of HoMnO3 reveals the most contribution of each atom in each distinct energy category. Figure 5 shows the total DOSs of pure HoMnO3 and the HoMnO3 doped with La, Y for the spin-up and spin-down states. For pure HoMnO3, the Ho-5p state combined with a negligible share of the O-1s state dominates the energy range from − 25 eV to − 23 eV in the SPGGA + U calculation. The peaks between − 19 eV to − 20 eV originate from the O-2s states with minimum contribution of the Ho-5p state, and the peaks between − 19 eV to − 18 eV result from O-2s with some contribution of the Ho-5p state. The peak around − 17 eV is also derived from O-2s. Finally, the fifth group from − 7 eV to − 1.5 eV is due to the O-2p, Mn-3d, and Ho-4f states. In this range, the O-2p state shows dominancy while the contributions of the O-2p and Mn-3d states are moderate and the contribution of Ho-5p is minimal. We note that the Ho-4f, Mn-3d, and O-2p states are strongly hybridized, leading to the covalent bond between Ho– O and Mn– O, which is in good agreement with the previous results.[18] As can be seen in Fig. 5, the sizeable proportion of the valence bands are constituted on the Fermi level which originate mostly from the Mn-3d state mixed with the minimal allocation of the O-2p state. However, the next group of states in an energy range from 3 eV to 12 eV are generated by the combination of the Ho-4d and O-2p states.
The calculated DOS for Ho0.67La0.33MnO3 by SPGGA + U shows that partial DOS of La is predominately introduced into the conduction bands at 6.0– 7.5 eV. Compared with those of pure HoMnO3, in this case, the DOSs, especially the valence bands around the Fermi level and the lowest conduction bands, are shifted toward the higher energies. The partial DOS of Ho0.67La0.33MnO3 shows a small proportion of La-5p state in a range from − 20 eV to − 15 eV. The surplus peaks in the range from − 15 eV to − 10 eV originate from the La-5p state combined with a negligible share of O 2p and 2s states. The conduction band in the range from 3 eV to 12 eV is composed of the La-4f state hybridized with a noticeable share of Ho-4d and La-5d states and negligible O-2p state.
 | Fig. 5. DOSs for (a) HoMnO3, (b) Ho0.67La0.33MnO3, and (c) Ho0.67Y0.33MnO3 obtained by using SPGGA + U. |
For the spin-up and the spin-down states, the critical differences between them result from the Ho-4f and Mn-3d states. The results show that in the spin down states, the Ho-4f state is more separated from the Mn-3d state. For all materials at the spin up states, there is a weak hybridization between the Ho-5p and O-2s states in the range from − 20 eV to − 15 eV. In this case, we can see a strong combination between the Ho-4f and O-2p states just under the Fermi level and a strong mixture between the Mn-3d and O-2p states[19] just under and over the Fermi level. Also, there is a slight blend between the Ho-4d and O-2p states in the conduction band, higher than 3 eV. The Mn-3d state above the Fermi level is separated from the Ho-4f state in the SPGGA + U schema. In the Ho0.67Y0.33MnO3 compound, for the spin-up states, the Y-4p states appear in the range from − 25 eV to − 20 eV and the Y-4d states contribute to Ho-4d in the conduction band. Finally, for the spin-down states, the Y-4p state cooperates with the Ho-5p state in the range from − 25 eV to − 20 eV.
The Mn layers play an important role in determining the magnetic properties of HoMnO3 along the c direction.[20– 22] It is predicated that the substitutions of La and Y atoms change the c parameter and, as a result, change the magnetic properties. The net magnetic moments of Ho1− xTxMnO3 (x = 0, 0.33; T = La, Y) are due to the contributions of the magnetic moments of Ho1, Ho2, Mn, and interstitial sites as presented in Table 1. Most of the contributions come from the unfilled Ho1-4f, Ho2-4f, Mn-3d states and the interstitial sites. The results show that the magnetic moment at the Mn site increases by adding La and Y atoms. This increase is due to the decrease in the bonding strength with the increase in the c parameter of the unit cell. This increase in the magnetization at the Mn site spontaneously induces the magnetic moments at the non-magnetic sites. The net magnetic moment of the unit cell decreases because of the substitutions of non-magnetic atoms (La and Y) for the magnetic atoms (Ho).
Transitions between occupied and unoccupied states occur in the electric field of the photon, including plasmons and single particle excitations. The linear response of a system to an electromagnetic radiation is described by the dielectric function ε (ω ).[23] For calculating the frequency dependent dielectric function ε (ω ), we need energy eigenvalues and electron wave functions. Both energy eigenvalues and electron wave functions are the natural outcomes of the band structure calculations. The symmetry of the reported crystal structure implies that there are two non-zero components for the dielectric tensor along a = b and c crystallographic axes. The two principal complex tensor components for the single crystal are ε xx(ω ) and ε zz(ω ). We need to calculate the two components of the imaginary part of the dielectric function for a complete characterization of the linear optical properties. In the random phase approximation (RPA) as implemented in the WIEN2k code, we use the following equations for calculating the complex dielectric tensor:[24]
 |
 |
where P denotes the principle value of the integral. The real parts of the frequency dependent dielectric function for Ho1− xTxMnO3 (x = 0, 0.33; T = La, Y) are shown in Fig. 6 for the x and z directions. The square of the dielectric function in zero energy is equal to the static refractive index. The obtained static refractive index for HoMnO3 is very large 4.83 in the plane perpendicular to the c axis (x and y directions), while it is 2.59 in the plane parallel to the c axis (z direction) within the SPGGA schema. This property is called birefringence and it is observed in optically anisotropic materials. The substitutions of La and Y for Ho in HoMnO3 cause 

Roots of the dielectric function (ε (ω p) = 0) are necessary factors to stimulate the oscillations of plasmons. In SPGGA + U, the roots of ε 1(ω ) are located at higher energies compared to those in SPGGA. Moreover, the number of roots increases from 6 to 10 for Ho0.67La0.33MnO3 in the z direction. These behaviors are observed for Ho0.67Y0.33MnO3 in the x direction for both approximations. There are more roots along the z direction than along the x direction for both Ho0.67La0.33MnO3 and Ho0.67Y0.33MnO3.
The imaginary part of the dielectric function, 
 | Fig. 6. Real parts of dielectric function for Ho1− xTxMnO3: (a) x = 0; (b) x = 0.33, T = La; (c) x = 0.33, T = Y. The inset is cited from Ref. [4]. |
Pure HoMnO3, as can be seen from the DOS plots, is predicted to behave as a metal along the x direction within the SPGGA calculations. In the x direction, E0 and E2 are related to the transitions from the occupied Mn-3d states at − 0.79 eV to the unoccupied ones at 1.05 eV. The E3 is the transition from the top of the valence band to the bottom of the conduction band. On the other hand, for the z direction, E0 is related to the transition from the occupied to unoccupied Ho-4f states situated on the Fermi level. The E1 is the transition from the top of the VB (occupied Ho-4f around − 0.85 eV) to the unoccupied Ho-4f states (around 0.12 eV). The E2 and E3 are the transitions from the occupied Ho-4f states (around − 0.85 eV) to the unoccupied Mn-3d states around 1.70 eV and 2.82 eV, respectively.
The metallic behavior is also predicted for pure HoMnO3 by means of SPGGA + U. In this approximation, E0 is the transition from the occupied to the unoccupied Mn-3d state around the Fermi level. Also E1 is the transition from the top of the VB to the bottom of the CB. The E2 and E3 are the transitions from the occupied Mn-3d or O-2p (around − 1.93 eV) and Ho-4f (around − 3.60 eV) states to the unoccupied Mn-3d states around 1.63 eV, respectively. However, for the z direction, E0 is the transition from the top of the VB to the bottom of the CB, E1 is the transition from the occupied Ho-4f (at − 0.60 eV) to the unoccupied ones (at 1.22 eV), E2 is the transition from the occupied Ho-4f state (at − 0.60 eV) to the unoccupied Mn-3d state in the CB (around 2.31 eV), and E3 is the transition from O-2p (at − 2.41 eV) to the unoccupied Ho-4f state (at 1.12 eV).
Nevertheless, in all studied materials, we can see a tangible shift toward higher energies when the used approximation changes from SPGGA to SPGGA + U, which is more noticeable and obvious along the z direction. The results show that substitution of La and Y for Ho1 in HoMnO3 causes the imaginary part of the dielectric function to move toward lower energies, which is more striking for Ho0.67La0.33MnO3 along the z direction than for Ho0.67Y0.33MnO3.
We use the following relation to calculate the real part of the optical conductivity:
 |
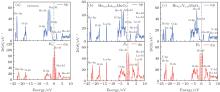
The real parts of the optical conductivity spectra for all studied materials are shown in Fig. 8. These spectra show peaks due to the transition from VB to CB. We can see from the data that the early four peaks (E1 = 1.15, E2 = 2.27, E3 = 3.66, and E4 = 4.42) along the z direction (in the SPGGA approximation) for pure HoMnO3 are in relatively good agreement with the experimental data at 6 K cited from Ref. [4]. The maximum optical conductivity 7.4 × 10¹⁵ s− 1 is observed around 28 eV (for the z direction) and also a smaller conductivity peak 5.5 × 10¹⁵ s− 1 exists around 10 eV (for the x direction) for HoMnO3 within the SPGGA calculations. The results show that by substituting La and Y for Ho1 in the pure compound, the maximum optical conductivity decreases in the z direction.
The structural, optoelectronic, and magnetic properties of Ho1− xTxMnO3 (x = 0, 0.33; T = La, Y) are investigated by the density functional theory within the SPGGA and SPGGA + U approximations. For both approximations, the band gap increases by doping La and Y atoms to the pure HoMnO3 in the spin-up state. Our results predicate that the substitutions of La and Y atoms for Ho1 change the c parameter and the magnetic properties. The net magnetic moment of HoMnO3 originates from the contribution of the magnetic moments of the unfilled Ho1-4f, Ho2-4f, Mn-3d states and the interstitial sites. The results show that the magnetic moment at the Mn site increases by adding La and Y atoms. For the optical properties, the metallic behavior is predicted for pure HoMnO3. By substituting La and Y for Ho1 in pure HoMnO3, the maximum optical conductivity decreases in the z direction. The obtained optical spectra are in close agreement with the experimental results.
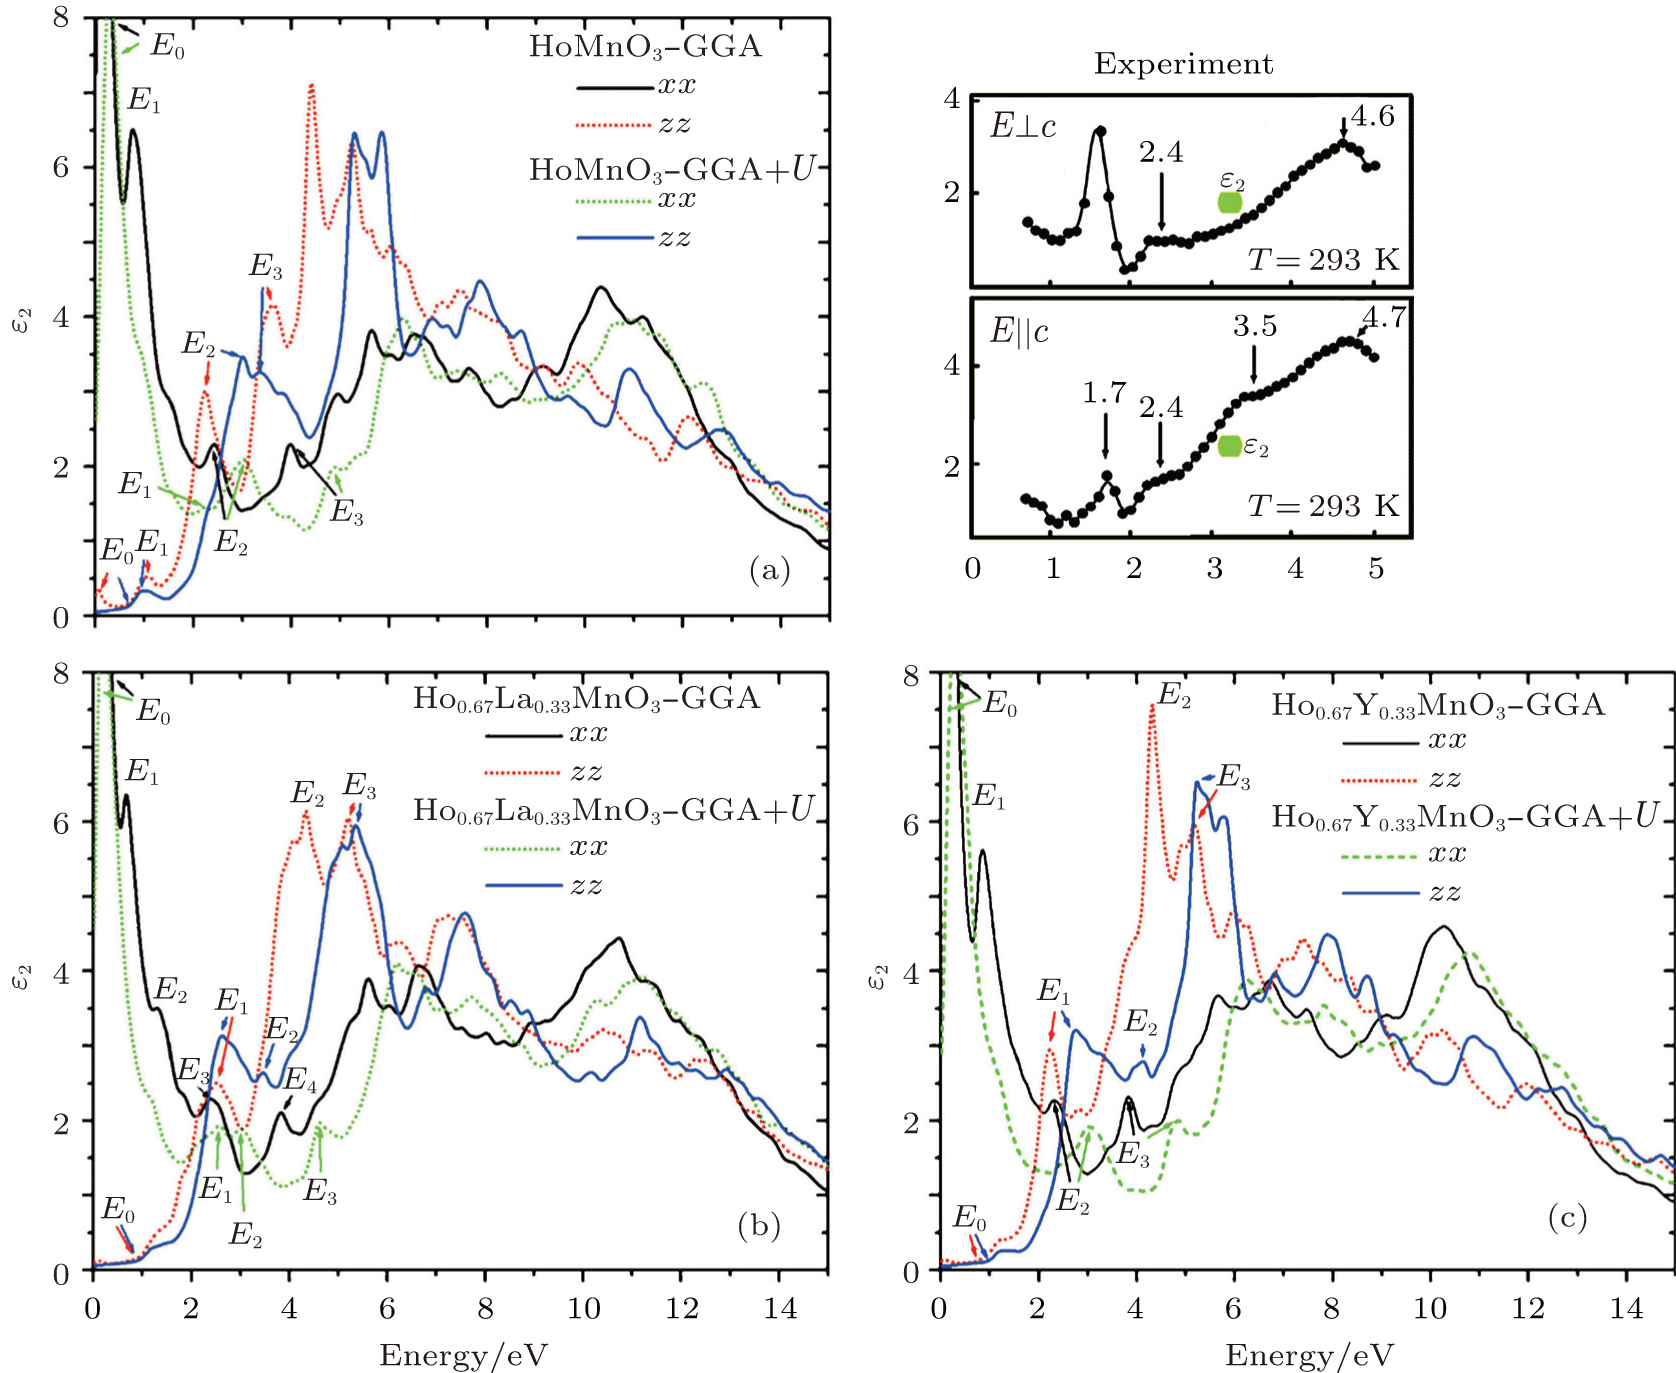 | Fig. 7. Imaginary parts of dielectric function for Ho1− xTxMnO3: (a) x = 0; (b) x = 0.33, T = La; (c) x = 0.33, T = Y. The experimental curves are cited from Ref. [2]. |
 | Fig. 8. Real parts of optical conductivity (× 1015 s− 1) for Ho1− xTxMnO3: (a), (b) x = 0; (c) x = 0.33, T = La; (d) x = 0.33, T = Y. The insets are cited from Ref. [4]. |
The authors are grateful to P. Blaha (Vienna University of Technology, Austria) for his technical assistance in using the WIEN2k code.
| 1 |
|
| 2 |
|
| 3 |
|
| 4 |
|
| 5 |
|
| 6 |
|
| 7 |
|
| 8 |
|
| 9 |
|
| 10 |
|
| 11 |
|
| 12 |
|
| 13 |
|
| 14 |
|
| 15 |
|
| 16 |
|
| 17 |
|
| 18 |
|
| 19 |
|
| 20 |
|
| 21 |
|
| 22 |
|
| 23 |
|
| 24 |
|