Phase diagram of the Fermi–Hubbard model with spin-dependent external potentials: A DMRG study

Phase diagram of the Fermi–Hubbard model with spin-dependent external potentials: A DMRG study |
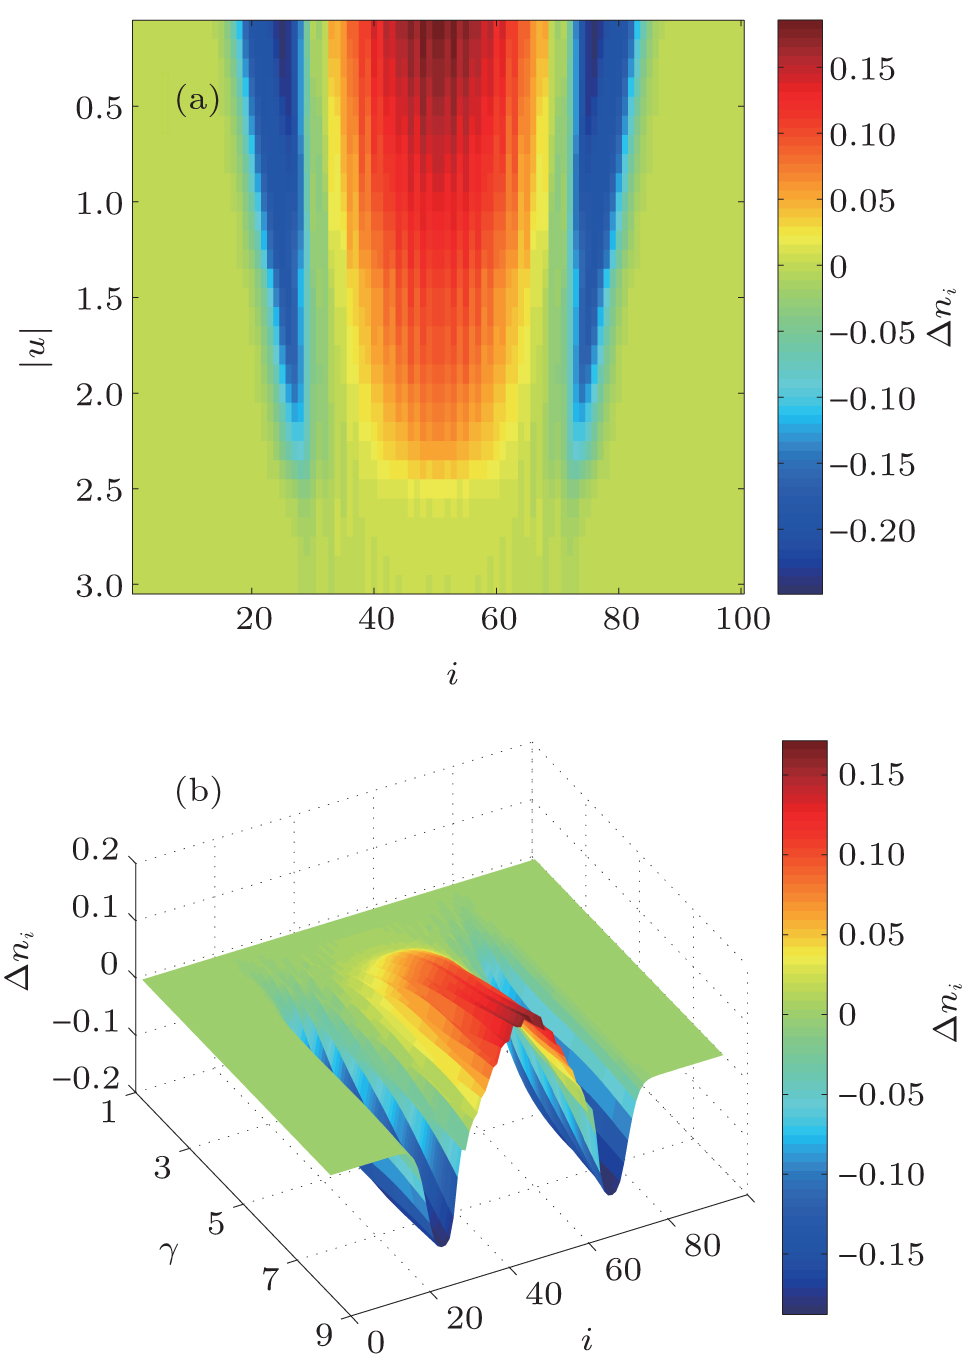
| The contour or 3D plot of the density difference Δ ni = n i ↑ – n i ↓ (a) as a function of the site i and the interaction strength u with γ = 4 and (b) as a function of the site i and the ratio γ with the interaction strength u = −2. The total number of particles is N s = 40 with N ↑ = N ↓, and the lattice size is L = 100. It shows that for the strong attractive interactions and weak potential imbalances, Δ ni = 0 elsewhere, which signals the BCS phase for the attractive case. |
 |