Phase diagram of the Fermi–Hubbard model with spin-dependent external potentials: A DMRG study
Wei Xing-Bo, Meng Ye-Ming, Wu Zhe-Ming, Gao Xian-Long
Phase diagram of the Fermi–Hubbard model with spin-dependent external potentials: A DMRG study |
|
Wei Xing-Bo, Meng Ye-Ming, Wu Zhe-Ming, Gao Xian-Long
|
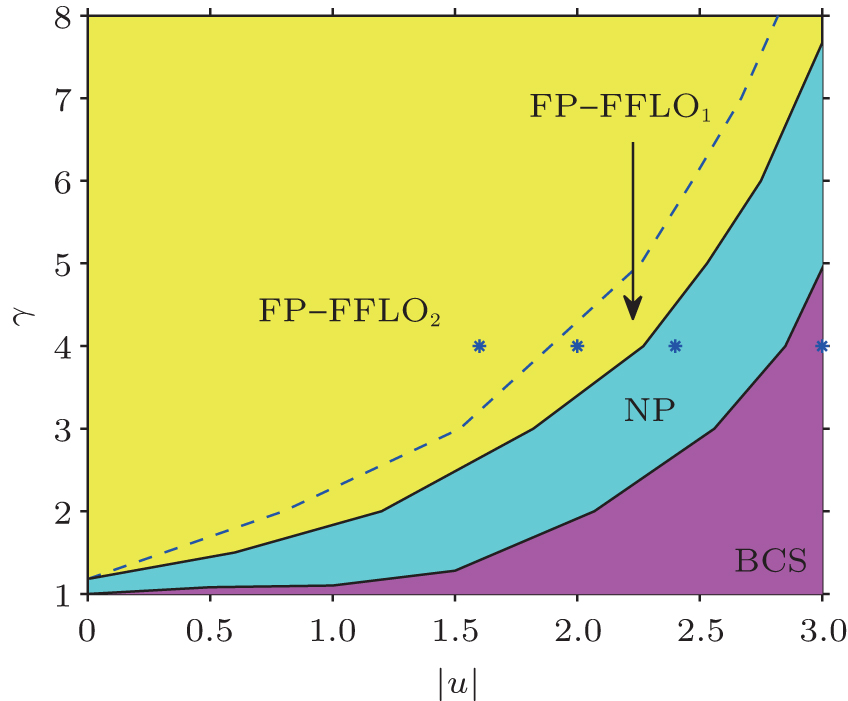
| Phase diagram as a function of the external potential imbalance γ and the attractive interaction strength | u |. There are three different phases: the BCS phase at strong attractive interactions and small γ , the normal polarized (NP) phase in the intermediate parameter range, and the coexisted fully polarized and FFLO (FP-FFLO) phase of one (FP-FFLO1) or two (FP-FFLO2) peaks in the pair–pair correlation function separated by the dashed line. The momentum pair distributions and the density profiles of the four different regions will be plotted in Figs. 3 and 4 , respectively, the corresponding positions are designated by the four stars from left to right. The vertical axis corresponding to u = 0 belongs to the NP phase. The horizontal axis corresponding to γ = 1 is definitely the BCS phase. |
| |