†Corresponding author. E-mail: xjhan@sjtu.edu.cn
*Project supported by the National Basic Research Program of China (Grant No. 2011CB012900), the National Natural Science Foundation of China (Grant No. 51171115), the Natural Science Foundation of Shanghai City, China (Grant No. 10ZR1415700), the Research Fund for the Doctoral Program of Higher Education of China (Grant No. 20100073120008), the Program for New Century Excellent Talents in Universities of China. This work is partially supported by Alexander von Humboldt Foundation.
Solidification behaviors of liquid aluminum at different cooling rates were examined via classical molecular dynamics simulation with an embedded atom method potential. The results demonstrate that solidification point decreases with increasing cooling rate. To explain this phenomenon, solid-like cluster in liquid was analyzed by the structural analysis method of bond order parameters. The results reveal that the size of the largest solid-like cluster in deeply undercooled liquid decreases with the increase of cooling rate, which can provide a structural interpretation to the above phenomenon.
Solidification of liquid metal is a fundamental issue in material sciences since almost all kinds of metals we used have to undergo such a procedure at least once or more.[1] In experiments, solidification process is always influenced by impurity, even advanced levitation techniques are employed, [2, 3] which hinders our further understanding of the fundamental principle of solidification. To overcome the experimental problem, molecular dynamics (MD) simulation has been widely used since the problem of impurity does not exist. MD simulation is a powerful tool to explore the phase transformation and structure of condensed matter at the level of atomic resolution.[4] In MD simulation, aluminum (Al) is often selected as a model metal for investigation[5– 8] due to the wide application of Al as a good engineering material. For example, Shen et al.[9] recently presented different solidification processes of liquid Al with the respective cooling rate, and they found that the high cooling rate leads to glass formation, while the low cooling rate leads to crystallization.
As we know, the cooling rate is an important factor during a solidification process, and has a profound effect on the final structures.[10, 11] However, the dependence of solidification behavior on cooling rate is still poorly understood. Shibuta et al.[12] investigated the effect of cooling rate on the solidification behavior of molybdenum nanoparticle, and they observed that the solidification point decreases with increasing cooling rate. A similar observation was found in bulk nanocrystalline Al.[13] These studies provide us with a deeper knowledge of solidification behavior, but one question coming is why the solidification point decreases with increasing cooling rate. It is well known that, solidification process stems from nucleation except glass transition. Kelton et al.[14] demonstrated that a correlation exists between nucleation barrier and icosahedral short-range order, which is a kind of liquid local structure. Inspired by their work, we think that the decrease of solidification point with increasing cooling rate might be associated with liquid local structure. Recently, liquid local structure has attracted great attention both in experiments[15– 18] and in MD simulations, [19, 20] showing more and more importance in material science. Therefore, in this work, we try to provide an explanation to the above question from the view of liquid local structure.
Firstly, the solidification of liquid Al is conducted using MD simulation with different cooling rate. The cooling rates we selected differ by an order of magnitude, allowing us to clearly observe the discrepancy caused by cooling rate. Secondly, solidification point at each cooling rate is summarized. At last, we present the result of liquid local structure. Based on the result and the classical nucleation theory, [1] the correlation between cooling rate and solidification point is well interpreted. Much attention has been directed to the study of the equilibrium liquid structure, while the liquid structure during a non-equilibrium process like solidification has been rarely reported. We believe this work could attract more attention to further explore the liquid structure at non-equilibrium states.
All simulations were performed under external constant pressure of zero using the open source code LAMMPS.[21] The Finnis– Sinclair potential was adopted to describe the atomic interactions. The original file of the potential for Al is provided by Mendelev.[22] The potential has already been applied to predict the solidification and devitrification of Al.[23] Within the framework of embedded atom method, the total energy Etot consists of two terms
 |
where i, j denote different atoms, N the number of atoms, ri j the distance between atoms i and j, φ i j(ri j) the pair potential between atom i and j at a distance of ri j, Fi(ρ i) the embedded energy, and ρ i the background charge density at the site of atom i
 |
with ψ i(ri j) being the contribution to the charge density at atom i due to atom j.
The system size (8.1 × 8.1 × 8.1 nm with 32000 atoms) we used in simulation is large enough to observe the liquid-solid transition and exhibit negligible size effect of results. During simulations, periodical boundary conditions (PBCs) are used in three directions. Isothermal-isobaric ensemble (NPT) was used and controlled by the Nosé – Hoover method.[24, 25] A time step of 1 fs was applied with Verlet algorithm[26] to integrate Newton’ s equation of motions. The solidification of liquid Al was performed as follows. Firstly, the whole system was heated up to 2050 K, much higher than the experimental melting point (933.47 K), and held there for 600000 steps to make sure that the system is in complete liquid state. Then, the system was cooled linearly in time from 2050 to 50 K at the cooling rate ranging from 2.0 × 10¹⁰ to 2.0 × 10¹³ K/s, i.e., T(t) = T0 – Qt, where Q is the cooling rate. Each cooling process was repeated 3 times. At each desired temperature, the configuration was recorded for further analysis. Table 1 lists the cooling rates and the corresponding numbers of steps.
| Table 1. Cooling rates and correponding numbers of steps. |
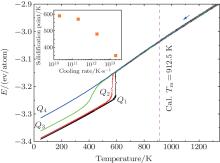
Figure 1 shows the evolution of the total energy per atom (E) with decreasing temperature at the four cooling rates. At Q1, Q2, and Q3, there is an abrupt change of the linear temperature dependence of E, which means liquid Al crystallizes during the cooling. It is observed that, within the transition region, E drops sharply at Q1 and Q2, while smoothly at Q3. This means that the nulceation resistance becomes significantly higher at Q3 than that at Q1 and Q2. For Q1, Q2, and Q3, we define the solidification point as the temperature where the linear decrease in E– T curve disappears. It is seen that the solidification points at the three cooling rates are all far lower than the simulated melting temperature (Tm), Tm = 912.5 K. The simulation details of Tm are illustrated in Appendix A. At Q4, E decreases continuously within the whole temperature range, and no abrupt change can be observed, which is a typical feature of glass transition. The glass transition temperature (Tg) is 350 K, which is determined by the Wendt– Abraham parameter[27] (seen Appendix B). For Q4, Tg is considered as the solidification point. From Fig. 1, we can conclude that the solidification point decreases with increasing cooling rate, which is consistent with the result of Ref. [12].
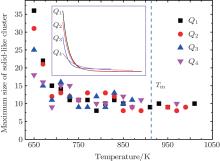
There is now a general consensus that liquid metals are composed of various kinds of local structure.[15– 20] One important kind of local structure is the solid-like cluster which is generated by liquid structure fluctuation. Solid-like cluster is directly related to the solidification process because one proper solid-like cluster in liquid, especially in deeply undercooled liquid, is enough to initiate nucleation and induce crystallization. In order to further examine the potential mechanism underlying the correlation between cooling rate and solidification point, we have calculated the maximum size of solid-like cluster at different temperature in liquid using the recorded configurations. To do this, we determine the solid-like cluster by using the method of bond-order parameters.[28, 29] The advantage of this method is that it can efficiently distinguish solid-like and liquid-like atoms and has little relation to specific type of crystal. This method has been successfully applied in previous studies by other researchers.[30, 31] For each atom i, the normalized order parameter is defined as
 |
where A is a normalization factor, B(i) the number of neighbors of atom i, Ylm a spherical harmonic function, and r̂ i j the unit vector pointing from atom i to j. If the complex inner product 
 |
where r is the nucleus radius, σ sl the solid/liquid interfacial energy, and Δ GV the volumetric free energy change. The maximum Δ G marked as Δ G* is received at a critical radius r*
 |
If the size of solid-like cluster is smaller than r* , the cluster will dissolve. Otherwise, it will grow further and induce crystallization. From Fig. 2, it is most probable for Q1 to firstly form a solid-like cluster with a radius larger than r* . That is to say, it is easier for the liquid to firstly crystallize at Q1 than at the other three cooling rates, and consequently the solidification point at Q1 will be higher than that at Q2 and Q3. The similar discussion can be applied to Q2 and Q3, which can well explain why the solidification point decreases with increasing cooling rate. If the cooling rate (like Q4) is high enough to exceed the critical glass transition cooling rate, the solidification process is a glass transition rather than crystallization. Then the solidification point should be Tg which is considerably lower than the crystallization temperature. Because the solidification mechanism has changed, here we limit our discussion to the crystallization.
In summary, a series of MD simulations were performed to examine the cooling rate effect on the solidification behavior of liquid Al. The observed solidification points are all far lower than the simulated melting point, which indicates that the solidifications at the four cooling rates need a quite large undercooling. At the cooling rate less than or equal to 2.0 × 10¹² K/s, crystallization takes place. At the cooling rate of 2.0 × 10¹³ K/s, glass transition is obtained and the corresponding glass transition temperature is 350 K. Following the increase of cooling rate, there is a clear drop of the solidification point. In order to elucidate that, solid-like clusters in undercooled and superheated liquid were analyzed. The results suggest that, within the temperature range near crystallization, the maximum size of solid-like cluster diminishes remarkably if the cooling rate increases a lot. This observation combined with the classical nucleation theory can reveal the structural origin underlying the effect of cooling rate on solidification point.
| 1 |
|
| 2 |
|
| 3 |
|
| 4 |
|
| 5 |
|
| 6 |
|
| 7 |
|
| 8 |
|
| 9 |
|
| 10 |
|
| 11 |
|
| 12 |
|
| 13 |
|
| 14 |
|
| 15 |
|
| 16 |
|
| 17 |
|
| 18 |
|
| 19 |
|
| 20 |
|
| 21 |
|
| 22 |
|
| 23 |
|
| 24 |
|
| 25 |
|
| 26 |
|
| 27 |
|
| 28 |
|
| 29 |
|
| 30 |
|
| 31 |
|
| 32 |
|
| 33 |
|
| 34 |
|
| 35 |
|


