Simulations of the L–H transition dynamics with different heat and particle sources

Simulations of the L–H transition dynamics with different heat and particle sources |
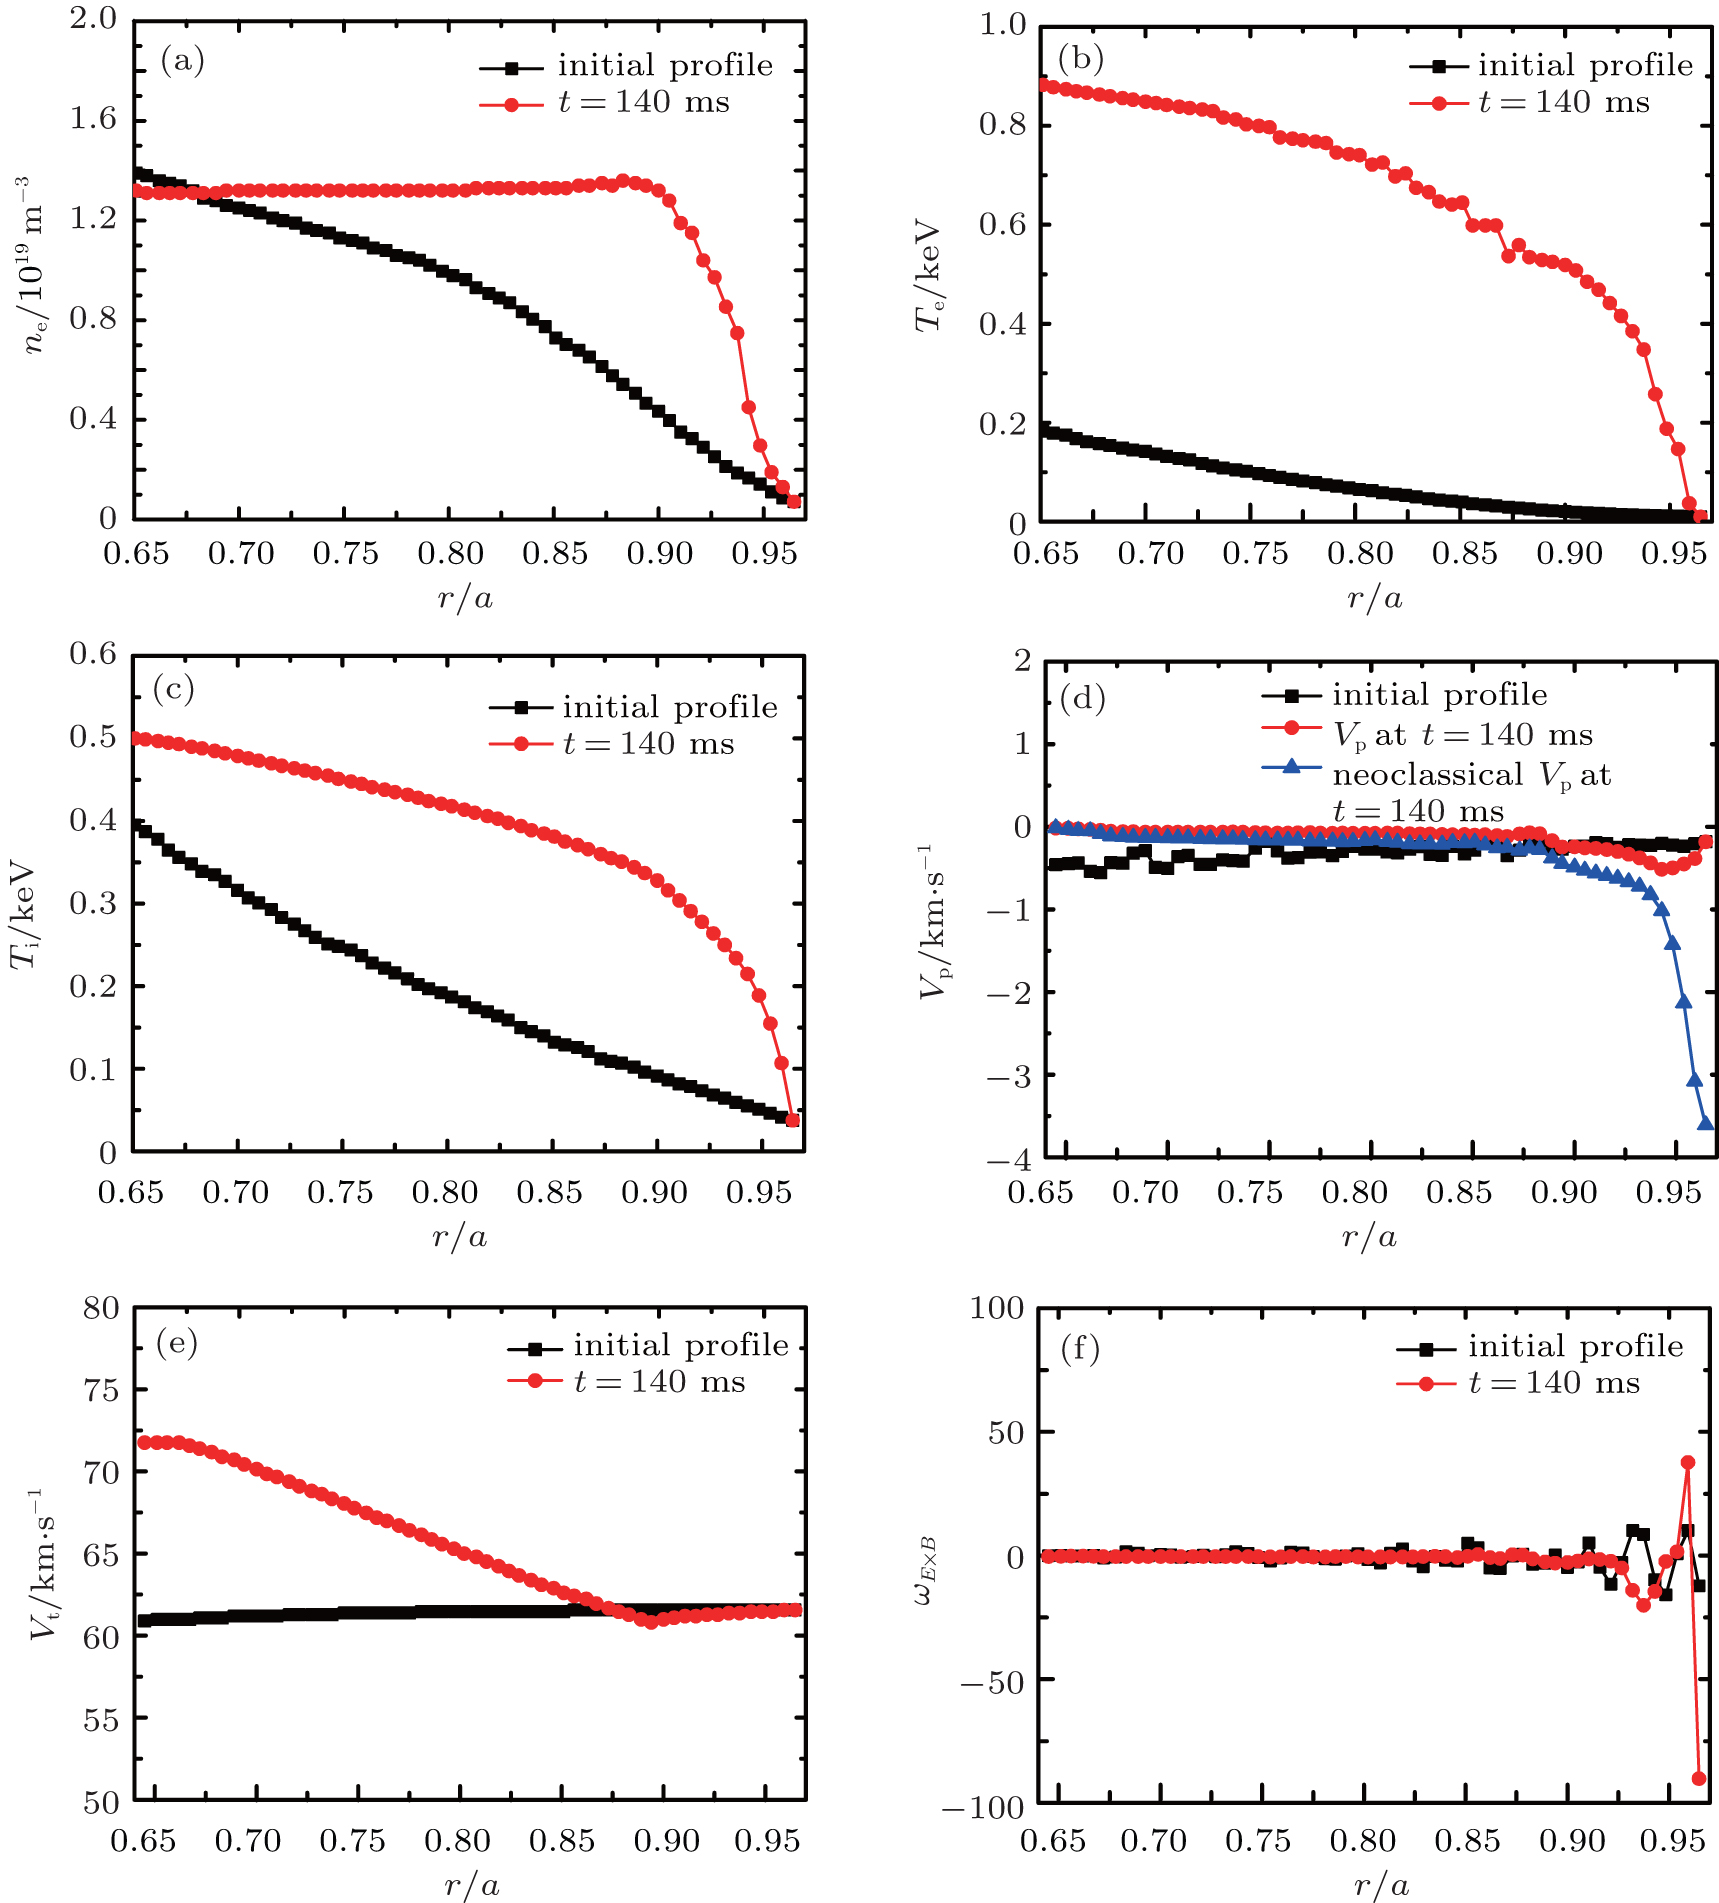
| Profiles of (a) electron density n e, (b) electron temperature T e, (c) ion temperature T i, (d) poloidal velocity V p, (e) toroidal velocity V t (for velocity V , positive refers to the clockwise direction and negative the anticlockwise direction), and (f) the E × B flow shear rate ω E × B profiles (lines with circles) at t = 140 ms and the initial profiles at t = 0 ms (lines with squares). Transport barriers of the electron density, electron temperature, and the ion temperature produced. The flow shear near the boundary is observed. |
 |