Enhancement of photoacoustic tomography in the tissue with speed-of-sound variance using ultrasound computed tomography
Cheng Ren-Xiang, Tao Chao , Liu Xiao-Jun
, Liu Xiao-Jun 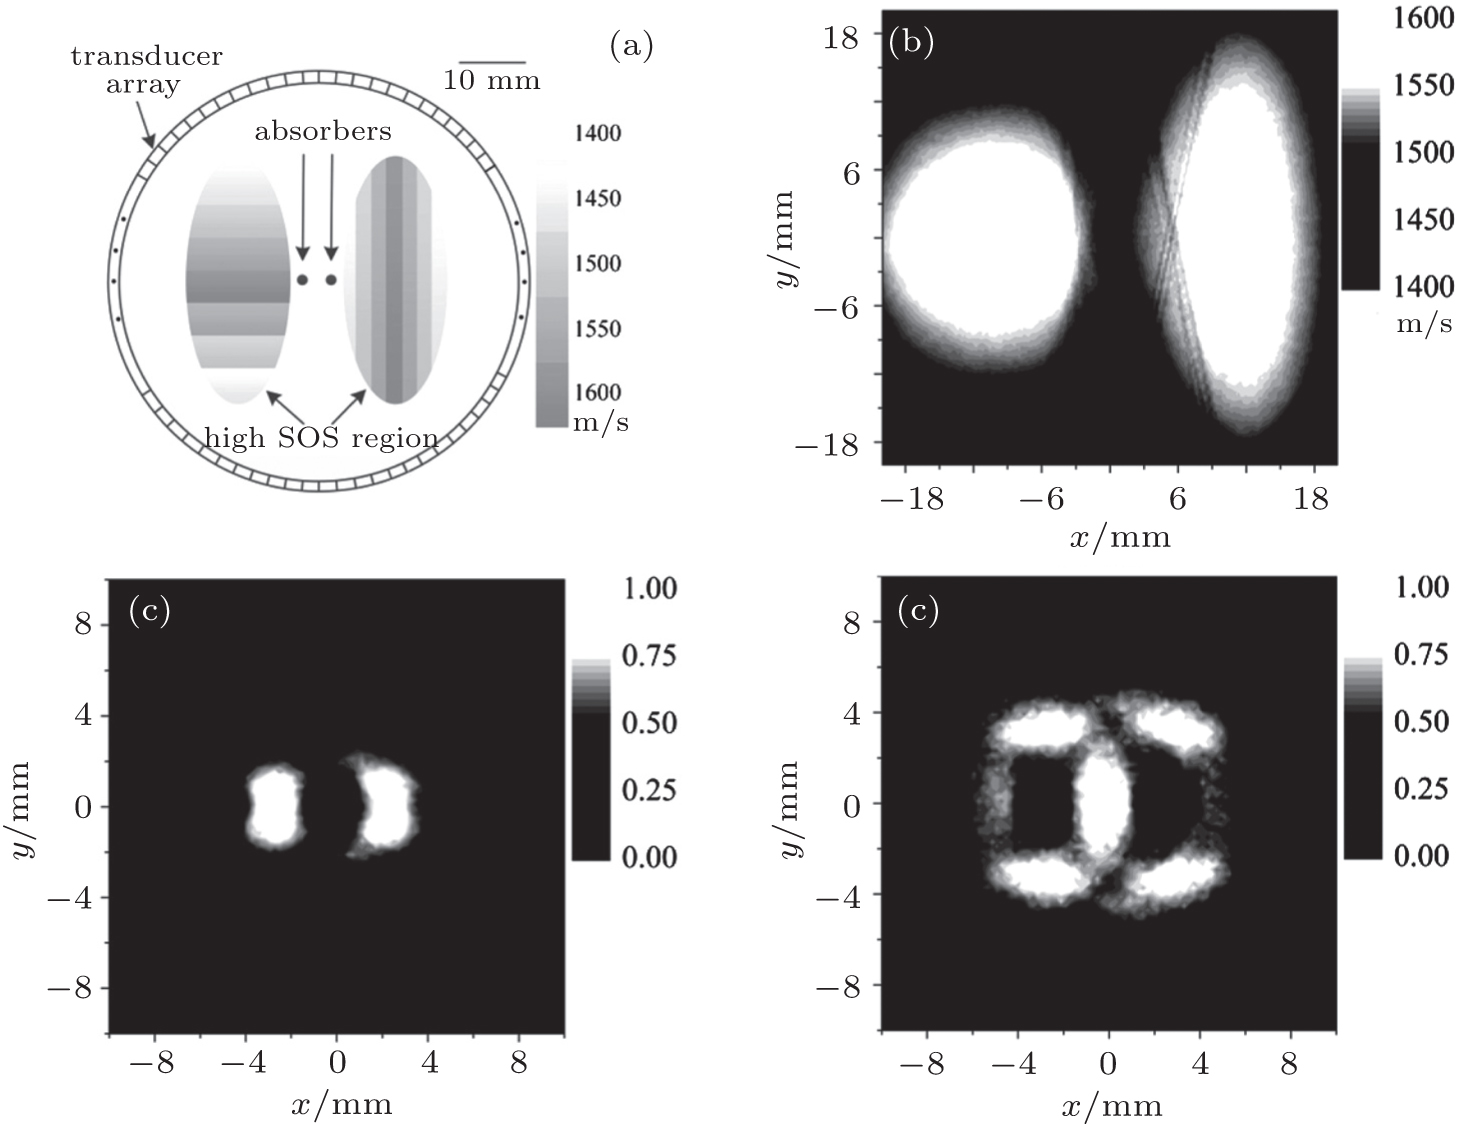
Enhancement of photoacoustic tomography in the tissue with speed-of-sound variance using ultrasound computed tomography |
|
Cheng Ren-Xiang, Tao Chao
, Liu Xiao-Jun |
| (a) Diagram of the simulation setup. The dark gray dots are optical absorbers and the light gray ellipses are the SOS variance region and the SOS distribution is shown by the color bar. (b) The SOS distribution estimated by US-CT. (c) The reconstructed PAT image by the CT-corrected DAS. (d) The reconstructed PAT image by DAS. |
| |