Enhancement of photoacoustic tomography in the tissue with speed-of-sound variance using ultrasound computed tomography
Cheng Ren-Xiang, Tao Chao , Liu Xiao-Jun
, Liu Xiao-Jun 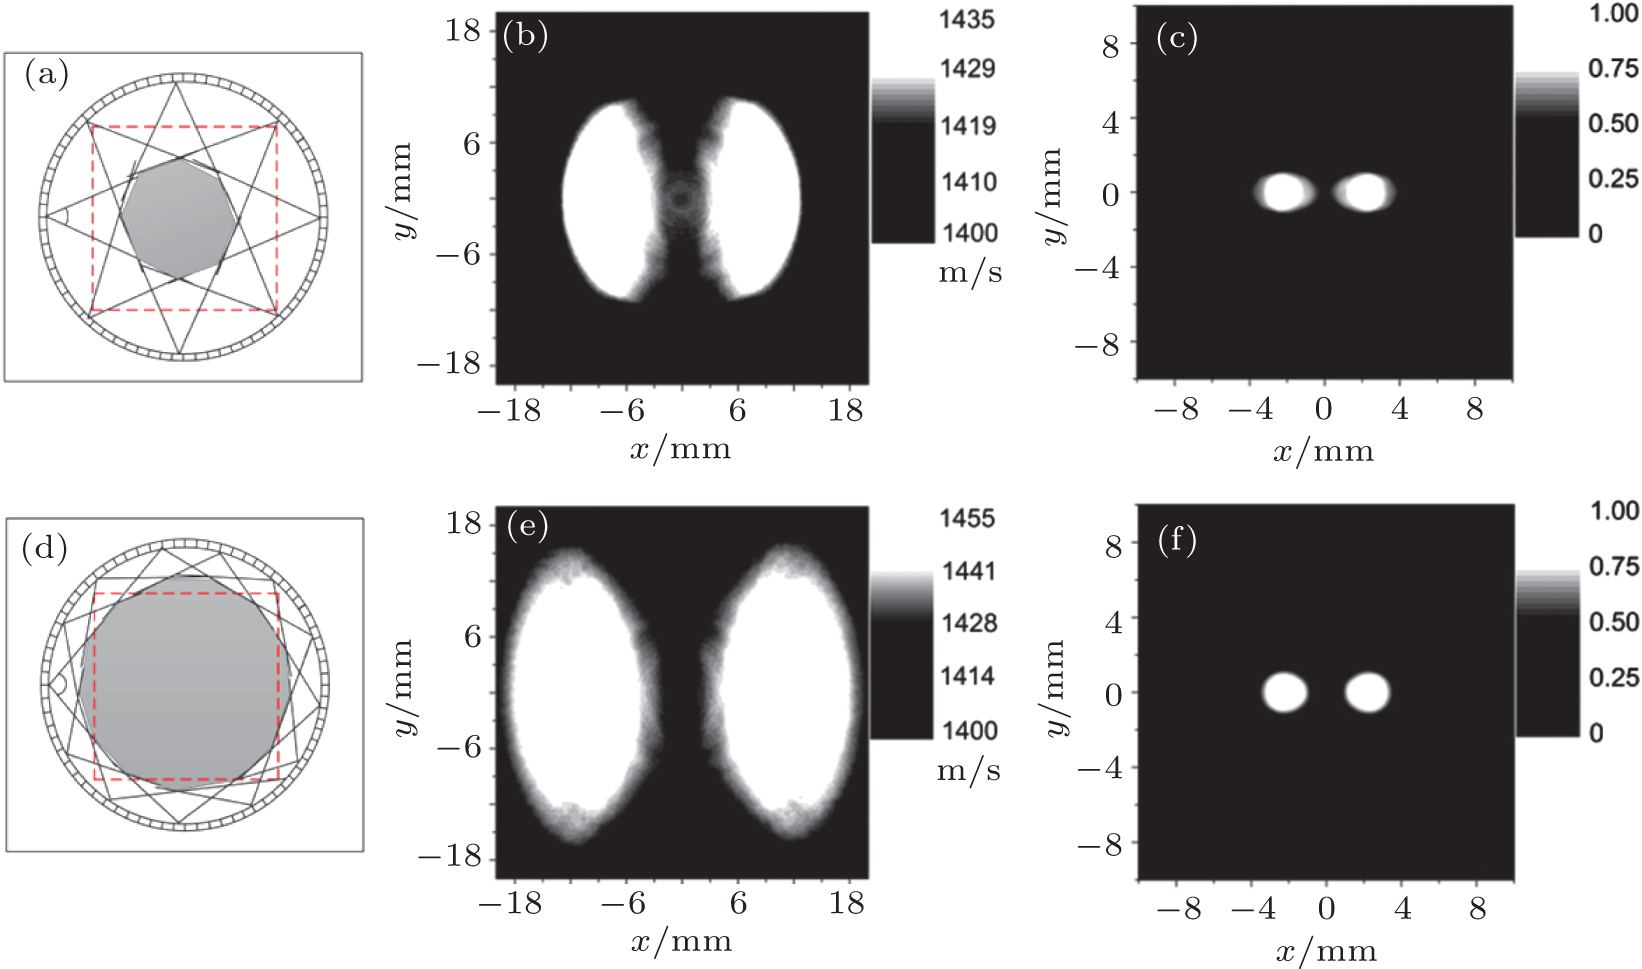
Enhancement of photoacoustic tomography in the tissue with speed-of-sound variance using ultrasound computed tomography |
|
Cheng Ren-Xiang, Tao Chao
, Liu Xiao-Jun |
| Comparison of reconstructed images in different fan angles. The upper row (a)–(c) and lower row (d)–(f) are reconstructed with fan angles 48° and 100°, respectively. The SOS of the high SOS region is 1455 m/s. The gray region in the left column is the region covered by US-CT. The red dashed square represents the acoustically inhomogeneous region. The middle columns are the recovered SOS distributions. The right columns are the reconstructed PA images. |
| |