Enhancement of photoacoustic tomography in the tissue with speed-of-sound variance using ultrasound computed tomography

Enhancement of photoacoustic tomography in the tissue with speed-of-sound variance using ultrasound computed tomography |
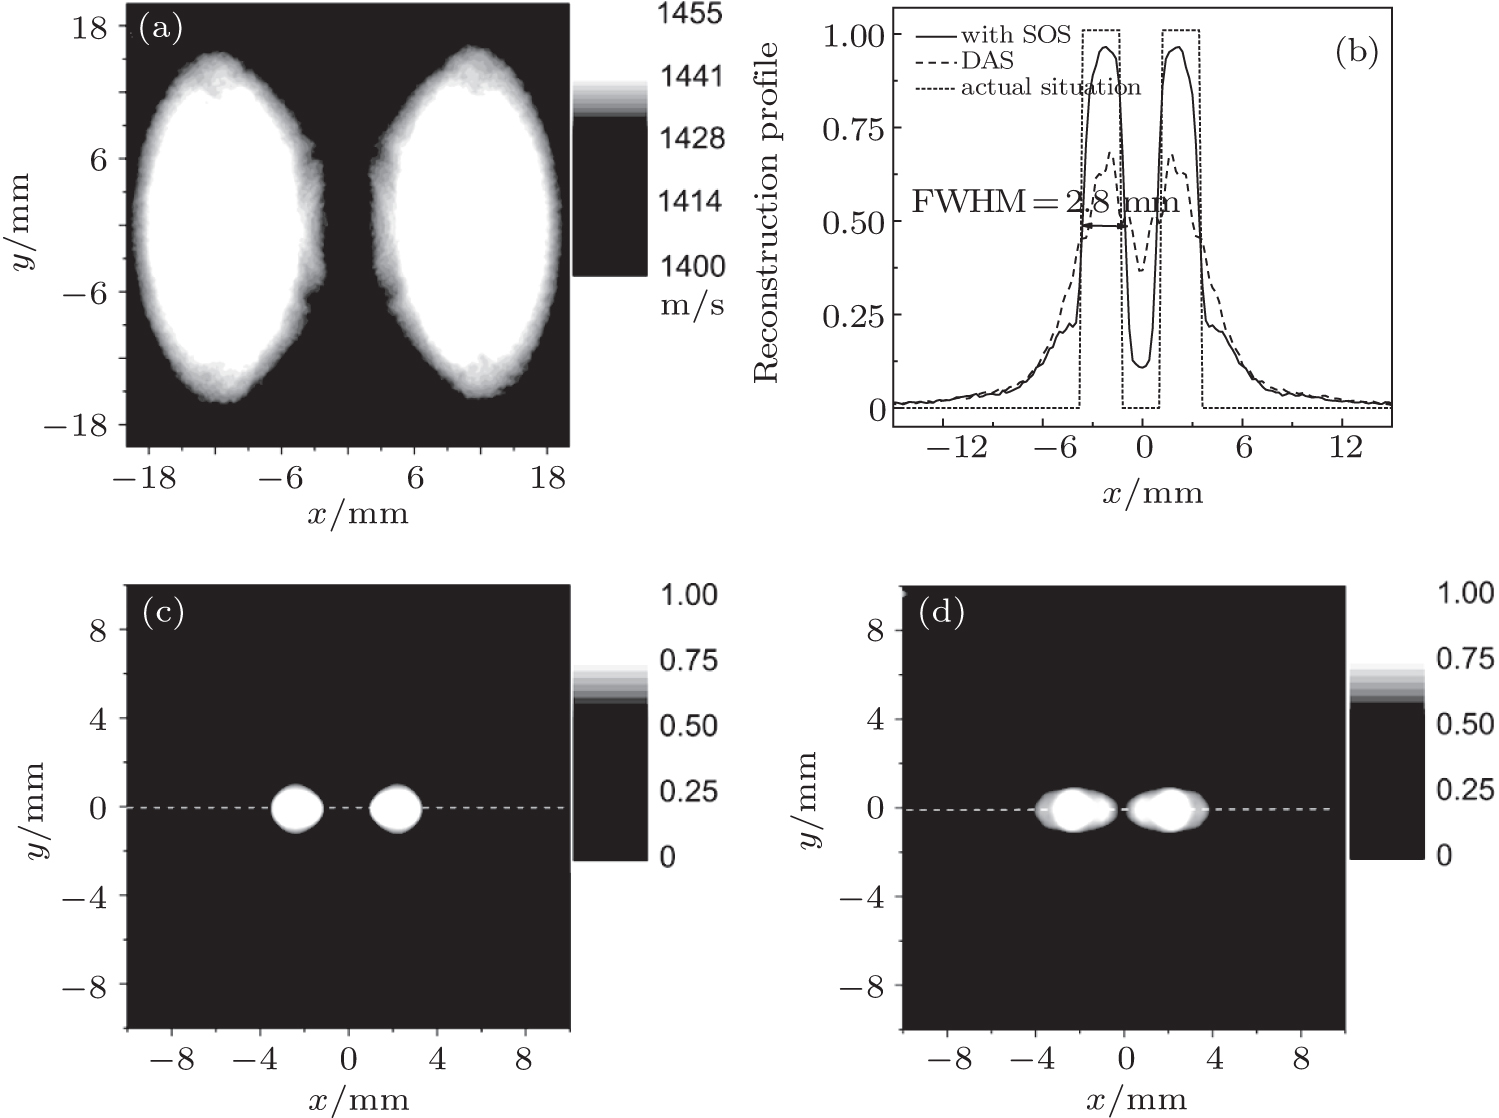
| Comparison of PAT reconstruction by using the proposed method and the DAS method. The SOS of the high SOS region is 1455 m/s. (a) The SOS distribution estimated by US-CT. (b) The profile of image intensity along the cross section at y = 0 (the dotted lines in panels (c) and (d)). The short dash line is the actual profile. The solid line and the dash dashed line are the reconstructed profiles with the proposed method and DAS, respectively. (c) The reconstructed PAT image by the CT-corrected DAS. (d) The reconstructed PAT image by DAS. |
 |