Yu Xin, Yang Zhen, Peng Jiang-Bo, Zhang Lei, Ma Yu-Fei, Yang Chao-Bo, Li Xiao-Hui, Sun Rui. Quantitative measurements of one-dimensional OH absolute concentration profiles in a methane/air flat flame by bi-directional laser-induced fluorescence* . Chinese Physics B, 24(11): 114204
Permissions
Quantitative measurements of one-dimensional OH absolute concentration profiles in a methane/air flat flame by bi-directional laser-induced fluorescence*
Yu Xina),b), Yang Zhena),b), Peng Jiang-Boa),b), Zhang Leic), Ma Yu-Feia),b), Yang Chao-Boa),b), Li Xiao-Huia),b), Sun Ruic)
National Key Laboratory of Science and Technology on Tunable Laser, Harbin Institute of Technology, Harbin 150080, China
Institute of Opto-electronics, Harbin Institute of Technology, Harbin 150080, China
School of Energy Science and Engineering, Harbin Institute of Technology, Harbin 150001, China
*Project supported by the National Key Scientific Instrument and Equipment Development Projects of China (Grant No. 2012YQ040164), the National Natural Science Foundation of China (Grant Nos. 61275127 and 91441130), the China Postdoctoral Science Foundation (Grant No. 2014M560262), and the Postdoctoral Fellowship in Heilongjiang Province, China (Grant No. LBH-Z14074).
Abstract
The one-dimensional (1D) spatial distributions of OH absolute concentration in methane/air laminar premixed flat flame under different equivalence ratios at atmospheric pressure are investigated by using bi-directional laser-induced fluorescence (LIF) detection scheme combined with the direct absorption spectroscopy. The effective peak absorption cross section and the average temperature at a height of 2 mm above the burner are obtained by exciting absorption on the Q1(8) rotational line in the A2Σ+ ( ʋ′ = 0) ← X2Π ( ʋ″ = 0) at 309.240 nm. The measured values are 1.86×10⁻¹⁵ cm2 and 1719 K, respectively. Spatial filtering and frequency filtering methods of reducing noise are used to deal with the experimental data, and the smoothing effects are also compared using the two methods. The spatial distribution regularities of OH concentration are obtained with the equivalence ratios ranging from 0.8 to 1.3. The spatial resolution of the measured result is 84 μm. Finally, a comparison is made between the experimental result of this paper and other relevant study results.
The hydroxyl radical has been recognized as a common and extremely important intermediate species in most hydrocarbon fuel combustions over the past several decades.[1] Measurement of the OH concentration has a great significance for further understanding the chemical reaction mechanism and kinetic model validation. In recent years, a large number of experimental studies and theoretical analyses[2– 21] have been made to accurately determine the OH concentration in a flame by using a variety of laser diagnostic techniques such as coherent anti-Stokes Raman scattering (CARS), degenerate four-wave mixing (DFWM), laser-induced fluorescence (LIF), cavity ring-down spectroscopy (CRDS), and direct absorption spectroscopy. With the exception of LIF, other laser diagnostic techniques can only determine single point or several point OH concentration in flame and hardly give the OH concentration details at different locations. Although massive efforts have been made to measure the OH concentration by many laser spectroscopy methods, unfortunately, the quantitative measurement of the OH concentration still has many unresolved issues until now. These problems are mainly manifested in the following aspects. (i) CARS and DFWM belong to nonlinear and coherent spectral techniques, despite their high measuring accuracy, and because of their complicated optical arrangements[22] and limitation of only a single point measurement of flame, the spatial resolution is extremely low, so none of them is an ideal OH concentration measurement tool. (ii) Absorption spectroscopy, including CRDS and direct absorption spectroscopy, has the advantages of high sensitivity and the simple optical arrangements compared with CARS and DFWM, but it can only obtain the integrated concentration of the absorber and its spatial resolution is very low. (iii) LIF diagnostic technique, including planar laser-induced fluorescence (PLIF), laser-induced predissociative fluorescence (LIPF), saturated LIF and short-pulse (ps) LIF, has an excellent sensitivity and a spatial resolution[23] (of the order of μ m in magnitude), but in the process of quantitative measurement it will be affected by many factors, such as temperature, pressure, collisional (electronic) quenching rate, fluctuation of laser energy, performance of optical collection system, quantum efficiency of detector and calibration relationship between LIF signal intensity and image grey value.
Among various factors affecting LIF signal intensity, temperature and collisional quenching play a dominating role in quantitative measurement. For weakening the quenching problem, LIPF, saturated LIF, and short-pulse LIF were proposed, but LIPF and saturated LIF demand high laser energy and require enough knowledge of the energy transfer process, therefore, neither of them are the appropriate ways to eliminate the effect of quenching. Short-pulse LIF simultaneously requires a picosecond laser system and a picosecond gated intensified camera. However, the high costs of the short-pulse LIF experimental system make it difficult to use in the actual combustion environments. By using a combination of bi-directional laser beam configuration and direct absorption spectroscopy, Versluis et al.[24] proposed a new method, as a solution, to eliminate the influences on quantitative measurement caused by quenching, temperature, pressure, optical collection system and detecting system. This method requires a very high beam coincidence degree and a good signal-to-noise ratio, so the research of measuring OH concentration by using this technique are quite rare. In 2007, Brackmann et al.[25] investigated experimentally a diffusion flame of dimethyl ether (DME) and air in a counter-flow by means of bi-directional laser-induced fluorescence. Quantitative measurements of the OH absolute concentration and the relative concentration of CH2O have been carried out in their work. A linear fitting to the logarithm of the signal ratio has been made for obtaining the OH and CH2O number density. Therefore, the values of concentration at different horizontal positions of flame were not determined in their experiments. A recent piece of research has been reported by Tian et al.[26] for determining the absolute concentration of the iron atoms in laminar premixed propene flame. In their experiments, only a one-directional laser beam configuration was adopted, because the flame is axially symmetric and the central part can be considered as a one-dimensional (1D) flame.
First, in this paper, the effective peak absorption cross section and the average temperature at 2 mm from the surface of the burner are obtained by exciting absorption on the Q1(8) rotational line in the A2Σ + (ʋ ' = 0) ← X2Π (ʋ ″ = 0) at 309.240 nm, and then, the characteristics of different data smoothing methods are compared. Finally, the 1D spatial distributions of OH absolute concentration in methane/air laminar premixed flat flame, under the equivalence ratios ranging from 0.8 to 1.3 and atmospheric pressure, are investigated by an absorption-sensitive bi-directional LIF technique.
2. Theory of bi-directional LIF
Based on the LIF technique and direct absorption spectroscopy, the bi-directional LIF is able to circumvent some physical quantities difficult to determine, such as collisional quenching, pressure and the fluctuation of the laser energy, and measure the concentration of flame species by using two laser beams which propagate into the flame oppositely.
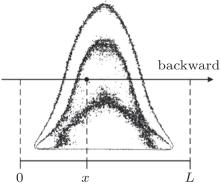
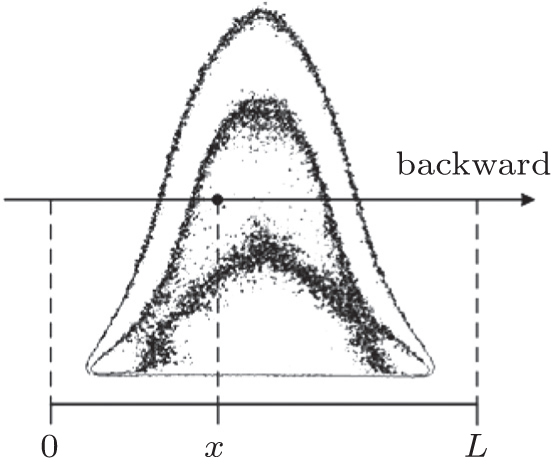
A schematic of 1D bi-directional LIF for OH concentration measurement is shown in Fig. 1. First we give a definition as described in the following. With ICCD camera for reference, the direction in which the laser beam traverses the flame from left to right is the backward direction, instead of reverse for the forward direction. The points x = 0 and x = L denote the boundaries for the concentration calculation. The laser-induced fluorescence signal intensity at the point x is given by the following expression:
where C is a constant depending on the collection angle of fluorescence signal and the detector sensitivity, S(x) denotes the fluorescent quantum yield which is only dependent on the spontaneous emission rate and the collisional quenching rate Q(x), σ 0 is the effective peak absorption cross section of OH radical, and N(x) represents the particle number density at point x. Consider a laser beam propagating through the flame at a fixed height from left to right along the x axis in Fig. 1. The beam will be attenuated according to the Lambert– Beer law and the intensity is given by the following equation:
Fig. 1. A schematic diagram for a 1D bi-directional LIF. The direction of the arrow is the backward direction.
Equation (2) is established in the unsaturated condition. In Eq. (2), Ib(x) is the laser intensity in the backward direction at point x, and Ib, 0 is the initial laser intensity of the backward beam at point x = 0. Similarly, if the laser propagates in the opposite direction from right to left, at the same height, the forward equation of the laser beam is given as
where If(x) is the laser intensity in the forward direction at point x, and If, 0 is the initial laser intensity of the forward beam. Note that the incident point of the forward beam is located at x = L. The ratio of fluorescence signals, R(x), is equal to the ratio between the laser intensities because the factors of C, i.e., S(x), σ 0, and N(x) are canceled in the division expressed as
Take the logarithm of the fluorescence ratio R(x), then one will obtain the following equation:
Finally taking the differential operation on Eq. (6), one can obtain
which is the functional relationship between particle number density and LIF fluorescence intensity. Equation (7) clearly shows that the particle number density is only associated with the forward and backward fluorescence intensities and the effective peak absorption cross section of particles under the linear excitation, independent of the temperature, pressure, quenching rate, laser energy, etc. It also suggests that the derivative of the fluorescence ratio R(x) is very sensitive to noise in the LIF signal. In this paper, in order to improve the signal-to-noise ratio (SNR), 500 single-shot images acquired by ICCD camera will be averaged (or accumulated) during the process of each determination.
The forward and backward fluorescence signal intensities can be obtained by an ICCD camera. The effective peak absorption cross section σ 0 is commonly obtained by scanning laser wavelength over the absorption line shape. The integral of absorption cross section across the line is given as the following equation:
where A is the integral area of relative absorption cross section, me and e are the mass and the charge of electron respectively, c is the speed of light, is the wavenumber, and fʋ ′ ʋ ″ J′ J″ is the oscillator strength for the particular transition and given by
where fʋ ′ ʋ ″ (0, 0) is the oscillator strength of the vibrational transition (0, 0), SJ′ J″ is the transition probability of the rotational transition, and TJ′ J″ is a correction factor for the ro-vibrational interaction. More detailed calculation can be found in Refs. [27] and [28]. Therefore calculating the value of the right item in Eq. (8) and combining with the measured values A, one can obtain the effective absorption cross section. All quantities of Eq. (8) are adopted in CGS system of units.
As shown in Fig. 2, the relative absorption cross section of Q1(8) absorption against relative wavenumber is obtained by the method described above. The Voigt fitting curve of the experimental data is used to calculate the value A. The experimental values of A and effective peak absorption cross section at Q1(8) are 0.43 cm− 1 and 1.86× 10− 15 cm2, respectively. Temperature is the main factor affecting the peak effective absorption cross section, so the deviation in flame temperature will lead to a large error. Generally, in a temperature range of 1500– 2500 K the error is up to 15%.
Fig. 2. Experimental data of relative absorption cross section and the curve obtained by Voigt fitting within (0, 0) band at Q1(8) excitation line.
At the same time, it should also be noted that the results measured by Eq. (7) are the concentration in N″ = 8 at X2Π (ʋ ″ = 0) state rather than the OH number densities in the ground state. Therefore, the OH concentration in an excited state should be converted into the value in ground state. In the conversion process, we assume that the flame is always in thermodynamic equilibrium state (in this case), so the populations in rotational energy levels obey the law of Boltzmann distribution which is a function of temperature. This indicates that the concentrations in ground state will be largely influenced by the deviations of flame temperature at a fixed height and the different horizontal positions of the flat flame burner. As a consequence, the necessity of measuring the flame temperature and choosing a proper excitation wavelength should be taken for reducing the influence on the concentration measurements. Calculation by Wang[29] demonstrated that when the temperature changes in a range of 1500– 2200 K, the Q1(8) line results in a minimum error. In the present paper, the excitation wavelength within the transitions of A2Σ + (ʋ ' = 0) ← X2Π (ʋ ″ = 0) in Q1(8) line is selected. The simulation performed by LIFBASE software[30] shows that the corresponding wavelength in air is 309.240 nm.
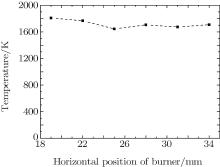
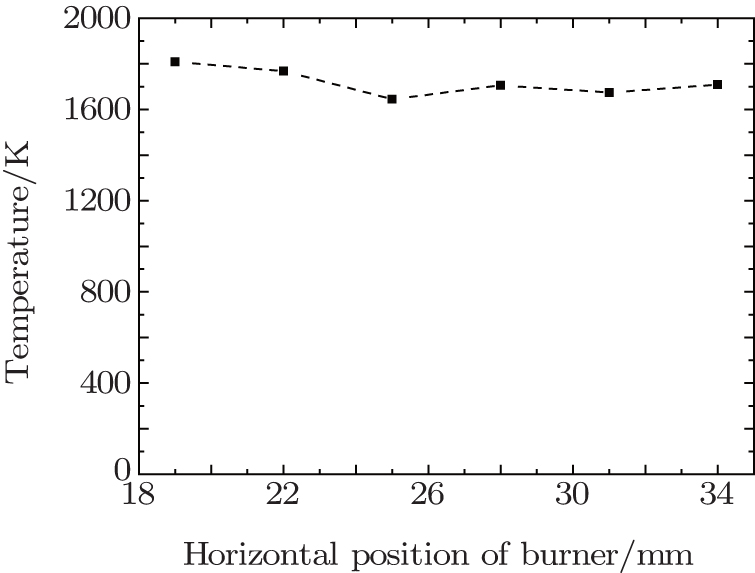
Zhang[31] in our research group, measured the temperatures on the flat flame at different heights above the burner by means of ultraviolet absorption spectroscopy. The results are consistent with other investigations, e.g., by Hartung et al.[32] The temperatures measured at a height of 2 mm above the burner and different horizontal positions with an equivalence ratio 0.8 are shown in Fig. 3. Here, we take an average of temperatures for each measured point and obtain an average temperature of 1719 K. As a matter of fact, the fluctuations of flame temperature in the horizontal direction are not drastic for the flat flame burner. The error which is introduced by selected excitation wavelength is less than 10% in the case of large temperature variations. As a result, we suppose that the average temperature of 1719 K is a true reflection of the actual temperature in the process of calculation for the ground state concentration.
Fig. 3. Curve of temperature versus horizontal position of burner, measured by direct absorption at the height of 2 mm (Φ = 0.8).
3. Experimental setup
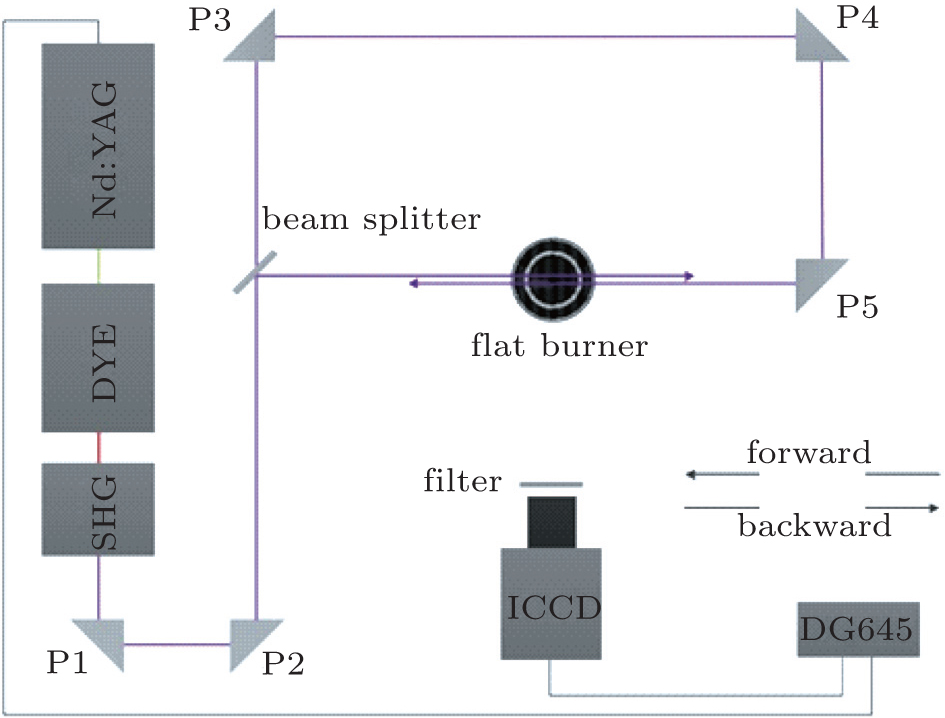
Figure 4 illustrates the schematic diagram of the experimental setup for a bi-directional LIF. A pulsed Nd:YAG laser (Continuum, Precision II 9010) delivering a fundamental beam at 1064 nm is used to generate a second harmonic at 532 nm with an energy of 55 mJ per pulse. The 532-nm beam is then coupled into a dye laser (Lamda Physik, Scanmate Pro) to generate a UV-laser beam which is frequency doubled by BBO crystal for OH detection at 309.240 nm with a line width of 0.15 cm− 1, pulse duration of about 7 ns, and pulse energy of 2 mJ. In order to enhance the conversion efficiency of dye laser, dyes used for dye laser are mixed by DCM and PM580 in methanol.[33] The DCM and PM580 concentrations of the oscillator are 1× 10− 3 mol/L and 0.33× 10− 3 mol/L, respectively. For the amplifier of the dye laser, the concentrations of DCM and PM580 are 0.3× 10− 3 mol/L and 0.1× 10− 3 mol/L, respectively. To avoid saturation effects and ensure collinear for the forward and backward laser beams when the beams propagate through the flame, the laser spot diameters are reduced down to 2 mm by placing two circular apertures on both sides of the burner, which results in a laser energy density of about 300 μ J/cm2. The output 309.240 nm UV-laser is separated into two beams by a beam splitter (BS). The forward beam will transmit out of the BS and successively propagates through the prisms P3, P4, and P5 before traversing the flame, while the backward laser beam, after being reflected out of BS, will propagate through the flame in the opposite direction with respect to the forward beam. The two beams should have to be collinear with each other.
Fig. 4. Schematic diagram of experimental setup for a bi-directional LIF.
The fluorescence signal of OH is collected with the intensified CCD (ICCD) camera (Andor Technology, iStar, chip size 1024× 1024 pixels) perpendicular to the laser beam. The gate width is set to be 20 ns to ensure that the OH fluorescence signal will be collected completely into the ICCD camera. The UV lens (Jenoptik Precision Instrument, f = 105 mm) is used and the aperture is set to be f/4.5. A glass filter (Semrock, FF01-315/50) is mounted in front of the UV lens to block flame spontaneous radiation. A digital signal delay generator (Stanford Research Systems, DG645) is employed to control the synchronization between Nd:YAG laser and ICCD camera. The burner system is adopted with a flat flame burner designed by Hartung et al.[32] The specific design parameters and characteristics can be found in Ref. [32]. This flat flame burner has good temperature uniformity with the laminar premixed flame temperature in the horizontal direction of the burner. Therefore, it is very conducive to the OH concentration measurements. In this paper, selecting the flat flame burner aims to minimize the adverse influence of temperature fluctuations in the OH absolute concentration determination.
4. Data smoothing method
As can be seen from Eq. (7), the derivative of the signal ratio R(x) must be taken before calculating the OH concentration. In fact, the fluorescence signal collected by ICCD camera consists of discrete data points and some inevitable noise. It cannot be directly used for differential operation. The noise contained in the experimental data, therefore, also should be removed so as to obtain the smoothing experimental curve which is used to calculate the OH density. Generally, the smoothing of a signal, also known as filtering, consists of two categories as follows: spatial (or time) domain smoothing and frequency domain smoothing. Spatial filtering is implemented directly on the data by means of some space operations or transformations to achieve the purposes of smoothing. For frequency domain filtering, a Fourier transform should be carried out before designing an appropriate filter to remove the noise. Then inverse transform is performed for restoring the spatial domain signal (or image). Compared with the frequency filtering, spatial filtering is an adjacent operation that any pixel value of the output signal is obtained by executing a certain algorithm to the pixel value in a certain range of input signal.
4.1. Spatial domain smoothing
Spatial smoothing mainly consists of the following three routines: the adjacent (or moving) averaging, the Savitzky– Golay filter, and the local regression using weighted linear least squares (lowess) by the first degree polynomial model, also known as locally weighted scatterplot smoothing. In spite of the fact that the spatial smoothing method can rapidly reduce the noise for most of the data, the shortcoming is exposed apparently in the fact that it can only deal with the data in the spatial domain but cannot observe the frequency distribution features of experimental data.
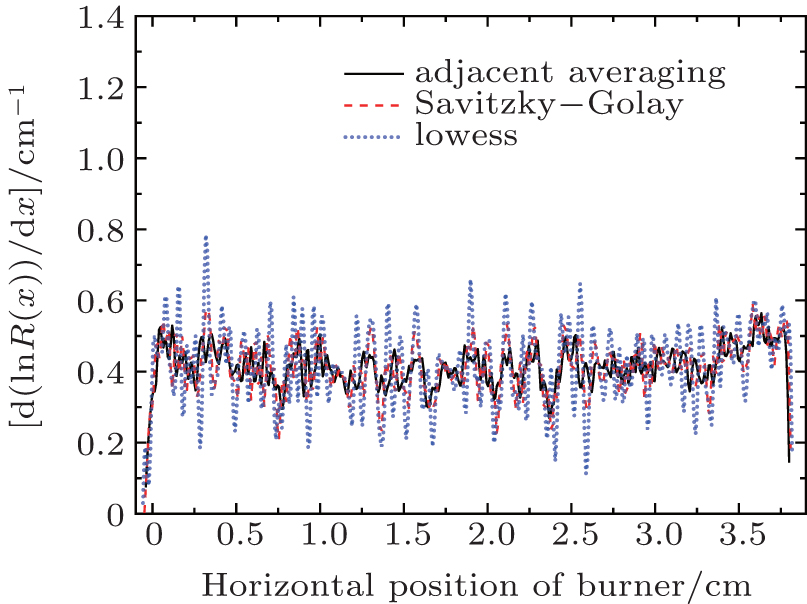
The smoothing results of the experimental data, ln R(x), performed by three methods described above are shown in Fig. 5. In order to facilitate the comparison, the proportions of span for these three spatial smoothing methods are set to be 0.68%. As can be seen from Fig. 5, after performing adjacent averaging, Savitzky– Golay filtering, and lowess smoothing the results still contain lots of high frequency noise. However, the calculation results imply that the lowess smoothing has a larger fluctuation than the adjacent averaging and the Savitzky– Golay filtering. Such fluctuations can cause a loss of the accuracy of calculation in the horizontal position of burner, while using adjacent averaging and using Savitzky– Golay filtering are able to suppress the fluctuations of OH density effectively.
Fig. 5. Curves of d(ln R)/d x versus horizontal position of burner, obtained by using adjacent averaging, Savitzky– Golay filter, and lowess smoothing method (Φ = 1.0).
4.2. Frequency domain smoothing
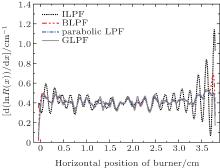
The main idea of frequency smoothing is to take a Fourier transformation of the original data into the frequency domain and then investigate the frequency profile before designing an applicable filter to remove the noise. Finally, the smoothing data are converted into the spatial domain by the inverse Fourier transform for restoring the spatial signal. For most of the experimental data, the signal and the noise are generally characterized by low frequency (or direct current, DC) and high frequency components in the experimental data, respectively. In this way, the interference of high frequency noise to the experimental data can be weakened even eliminated by designing an appropriate low-pass filter. Fast Fourier transform (FFT) is implemented for smoothing the fluorescence ratio in this paper. The key point for obtaining a positive smoothing effect is to design an effective low-pass filter since different smoothing filters will generate distinct effects on the experimental data. There are mainly several filters used commonly such as ideal low-pass filter (ILPF), Butterworth low-pass filter (BLPF), Gaussian low-pass filter (GLPF), and parabolic low-pass filter (parabolic LPF). In this paper, the cut-off frequencies of these four low-pass filters are all set to be 8.18 for comparing with the effect of spatial domain smoothing.
The results for d ln R/dx versus horizontal position of burner, calculated by using ILPF, BLPF, parabolic LPF, and GLPF, are displayed in Fig. 6. At the boundaries of the burner, the ideal low-pass filtering presents a pseudo-Gibbs phenomenon, so the smoothing results cannot reflect the real distribution of OH concentration, as can be seen from Fig. 6. Compared with the ideal low-pass filter, the degree of oscillation at boundaries position of the burner have been crippled a lot by Butterworth low-pass filter (second order), but there is still a weak pseudo-Gibbs phenomenon at the boundaries of the flame. Figure 6 also shows that the existence of pseudo-Gibbs phenomenon can hardly be found at the boundaries of the flame after performing Gaussian and parabolic low-pass filtering. There is more detailed information about the GLPF although these two filters are capable of preserving the true signal component when removing the noise. For this reason, in terms of selecting a low-pass filter, a Gaussian low-pass filtering will be utilized for smoothing all the experimental data in this paper.
Fig. 6. Curves of d ln R/dx versus horizontal position of burner, obtained by using ILPF, BLPF, parabolic LPF, and GLPF (Φ = 1.0).
4.3. Comparison between spatial filtering and frequency filtering
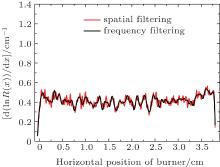
So far, the smoothing effectiveness has already been discussed respectively with the methods of spatial and frequency domain filtering. The consequence has confirmed that using the adjacent averaging (or Savitzky– Golay filter) smoothing can obtain a more reasonable effect for spatial filtering and the Gaussian low-pass filter has achieved a more excellent effect than the other three schemes for frequency filtering. Here, we intend to make a comparison of the smoothing effect between the spatial filtering and the frequency filtering, which is displayed in Fig. 7.
Fig. 7. Curves of d ln R/dx versus horizontal position of burner, obtained by using spatial filtering and frequency filtering (Φ = 1.0).
As can be seen from Fig. 7, performing spatial filtering to the fluorescence ratio has indeed removed the majority of noise but also damaged some useful signal component, which results in the reduction of spatial resolution of the OH relative concentration and a large loss of accuracy for the calculation in the horizontal position of flame. In contrast, using frequency domain filtering to the fluorescence ratio can not only remove most of the noise but also retain the fluorescence signal and the accuracy of OH concentration to a great extent in the flame. Therefore, we choose frequency domain filtering to smooth the experimental data. It is worth noting that an appropriate cut-off frequency needs to be fixed before carrying out the frequency filtering to smooth the fluorescence ratio. If the cut-off frequency is set too large it is unable to remove the noise effectively, or if too small, it can easily reduce the useful signal thereby reducing the calculation accuracy of the OH concentration.
5. Experimental results and discussion
In this experiment, the laser repetition rate is set to be 5 Hz by DG645 to keep the synchronization between ICCD camera and Nd:YAG laser. The size of the image recorded by ICCD is 1024× 35. The proportion, which is obtained by a calibration plate board (Amoyca, AY-Chess 50× 50 mm) between the real size of the burner and the image acquired by the camera, is 119.2:1. The overall flow rate of mixed gas is kept at 6.26 L/min and the equivalence ratio is varied from 0.8 to 1.3 in steps of 0.1. Because of the stable burning for flat flames, we first measure the LIF signal generated by the forward beam and then capture the LIF signal induced by the backward beam. The advantage of this is that it can reduce the instrument error caused by employing two ICCD cameras. The de-noised image of the LIF signal, which is obtained by accumulating images over 500 single shots and then taking the average of the OH fluorescence signal for all rows of the image so as to reduce the interferences caused by noise and the experimental errors brought by the fluctuations of the UV-laser power, is accepted as the OH fluorescence signal at a height of 2 mm above the burner. It is found that the statistical uncertainties caused by the shot-to-shot laser power fluctuation are less than 4.9%.
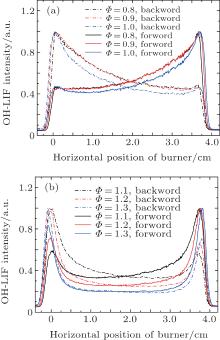
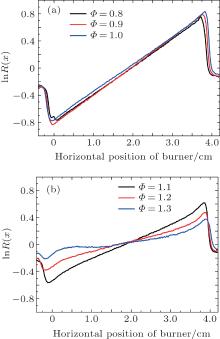
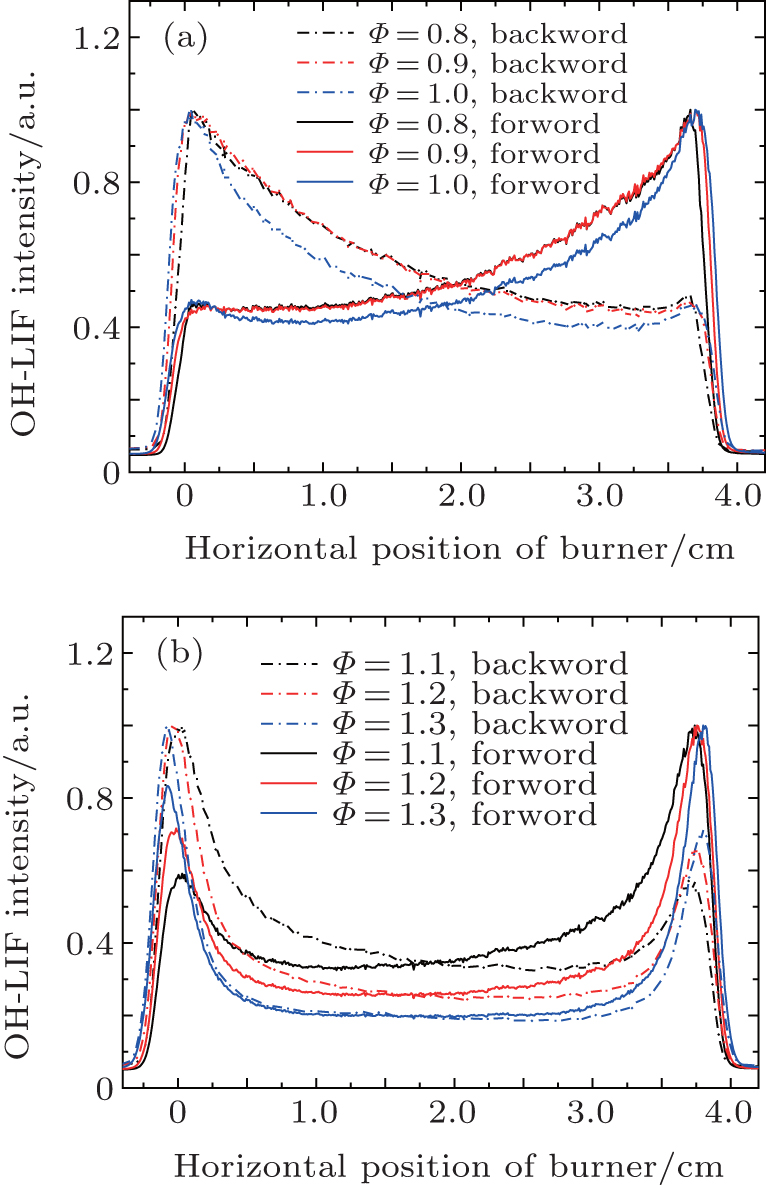
Figure 8 shows the forward and backward normalized OH fluorescence signal intensity profiles by varying the equivalence ratio from 0.8 to 1.3 in methane/air laminar premixed flame. As can be seen, it shows that the OH-LIF signal intensity decreases gradually due to the absorption effect of the hydroxyl radical and rises slightly at the outlet of the flame (for backward beam) when the equivalence ratio increases from 0.8 to 1.0. The phenomenon that the OH fluorescence intensity presents two stable peaks at the boundaries of the flame is observed when the equivalence ratio varies from 1.1 to 1.3. Calculations for the experimental fluorescence ratio ln R(x) are shown in Fig. 9. With the combination of the average temperature and the effective peak absorption cross section σ 0 obtained previously, we can calculate the OH absolute concentration profiles (for J″ = 8.5) at a height of 2 mm as shown in Fig. 10.
Fig. 8. Variations of OH-LIF signal intensities with horizontal position of burner for forward beam and backward beam at (a) Φ = 0.8, Φ = 0.9, Φ = 1.0; (b) Φ = 1.1, Φ = 1.2, Φ = 1.3.
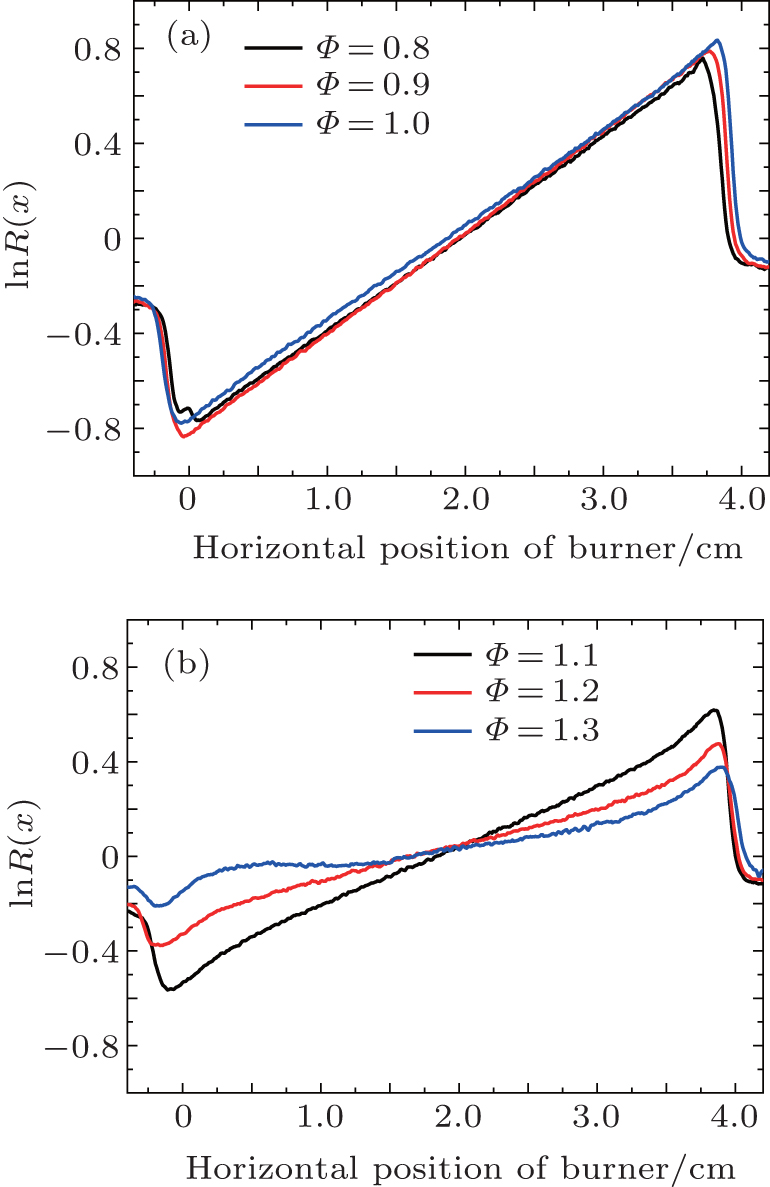
Fig. 9. Variations of experimental data of the lnR(x) with horizontal position of burner at (a) Φ = 0.8, Φ = 0.9, Φ = 1.0; (b) Φ = 1.1, Φ = 1.2, Φ = 1.3.
Fig. 10. Variations of OH absolute concentration with horizontal position of burner at a height of 2 mm at (a) Φ = 0.8, (b) Φ = 0.9, (c) Φ = 1.0, (d) Φ = 1.1, (e) Φ = 1.2, and (f) Φ = 1.3.
Figure 10 indicates that the OH concentration varies with the equivalence ratio. When the equivalence ratios are set to be 0.8, 0.9, and 1.0, the variations of the OH average concentration are very small and can even be ignored. It is notable that with the equivalence ratio increasing from 1.1 to 1.3, OH radicals diminish drastically in the middle region of the flame. Here, it is worth mentioning that the OH number densities are null in somewhere from 0.5 cm to 1.5 cm in Fig. 10(f). The reason for this phenomenon is that taking the derivative of ln R(x) with respect to x for this case results in the negative values. As can be seen from Fig. 9(b), the ln R(x) profile is found to change rather slowly in a range from 0.5 cm to 1.5 cm for Φ = 1.3, which results in the fact that the derivatives of ln R(x) in this region are susceptible to the variation of background noise. So there are some negative values in the range from 0.5 cm to 1.5 cm. However, the OH concentrations in flame should be positive values or zero in the actual combustion process. Therefore, the negative values should be ignored. We thus suppose that the OH densities are null (or zero) in the regions where the derivatives of ln R(x) have the negative values.
The variation trends of OH mean concentration under different equivalence ratios are shown in Fig. 11. The OH average number densities with increasing the equivalence ratio from 0.8 to 1.3 are 6.65× 1015 cm− 3, 6.86× 1015 cm− 3, 6.66× 1015 cm− 3, 4.81× 1015 cm− 3, 3.37× 1015 cm− 3, and 2.60× 1015 cm− 3, respectively. It is obviously shown that the OH mean concentration is almost unchanged by varying the equivalence ratio from 0.8 to 1.0. However, the OH average concentration is found to decrease gradually as the equivalence ratio increases from 1.1 to 1.3. In addition, we also observe that the region where the OH radical occurs shifts toward both edges of the flame with increasing the equivalence ratio. The variation of regularity of OH radical width with equivalence ratio increasing is shown in Fig. 12. Apparently, the width of OH region increases with increasing the equivalence ratio from 0.8 to 1.2. However, when the equivalence ratio rises to 1.2 the width of OH radical region almost remains unchanged.
Fig. 12. Width of OH radical region versus equivalence ratio at a height of 2 mm.
The uncertainties in the measurements of OH density by bi-directional LIF technique are mainly caused by the following several aspects. The measuring errors of the temperature-dependent Boltzmann fraction and the effective peak absorption cross section are less than 10% and 15%, respectively. The statistical uncertainty caused by the fluctuation of shot-to-shot laser power is approximately 5%. The noise error brought by ICCD camera is approximately 4%. Therefore, we estimate that the total uncertainty in our absolute measurements of OH number density is approximately 19.2%.
The spatial resolution of OH concentration measured in this paper is 84 μ m. The current literature has indicated that the spatial resolution of our experimental measurements is better than most other research results, e.g., Bechtel and Teets[34] obtained the 100 μ m spatial resolution in the reaction zone of methane-air flame at atmospheric pressure, Zhang et al.[5] reported that the spatial resolution of OH concentration between two points in the turbulent non-premixed flame was about 250 μ m.
It is found that different laser spectroscopic methods will result in an inequable magnitude for OH concentration under the same conditions, e.g., the magnitude of 1016– 1017 molecules/cm3 for the OH absolute average concentration is obtained by means of the direct absorption spectroscopy[31] and 1015 molecules/cm3 with the method of CRDS.[19] It is worth noting that Mercier et al.[19] in 1999 investigated the OH concentration using an identical flame (CH4/air premixed) with an equivalence ratio of 1.05 by CRDS. The OH concentration at a height of 6 mm for J″ = 6.5 was 0.93× 1014 cm− 3. Under a similar experimental condition, the OH concentration obtained by bi-directional LIF at 2 mm above the burner for J″ = 8.5 was 1.35× 1014 cm− 3. The temperature in the flame at 6 mm above the burner in their experiments was 1370 K, so the OH concentration NOH = 3.52× 1015 cm− 3 at 6 mm above the burner with an equivalence ratio of 1.05 by CRDS is obtained in the ground state. According to the calculation performed by Battles, [17] the OH concentration at 2 mm above the burner was approximately 1.4 times the OH concentration at a height of 6 mm. Using this relationship, we can deduce the OH number density at 2 mm above the burner to be around 4.93× 1015 cm− 3 by CRDS. If we roughly assume that the OH concentration changes linearly with equivalence ratio in a range between 1.0 and 1.1, the OH concentration NOH = 5.7× 1015 cm− 3 will be obtained under the condition of equivalence ratio 1.05. As a result, good agreement between bi-directional LIF and CRDS shows the reliability of the result measured by bi-directional LIF, but the difference between bi-directional LIF and direct absorption spectroscopy mainly lies in the accuracy of effective peak absorption cross section. Oh[18] in 1995 estimated an OH line-center absorption cross section (T = 298 K, P = 1 atm) of 3× 10− 16 cm2. This result is one order of magnitude smaller than the absorption cross-section measured in this paper. As is well known, the database for OH absorption cross section in low-temperature range has already been well-established. Its accuracy and reliability have been recognized basically by many researchers, however, there are always some controversial data in high temperature range. Therefore, it is very important to determine a reliable OH absorption cross section under the high temperature condition.
6. Conclusions
Measurements of the 1D OH absolute concentration profiles in methane/air laminar premixed flat flame under the equivalence ratios ranging from 0.8 to 1.3 at atmospheric pressure are performed by using the absorption-sensitive bi-directional LIF technique. The effective peak absorption cross section and the average temperature at a height of 2 mm above the burner are obtained by exciting absorption on the Q1(8) rotational line in the A2Σ + (ʋ ' = 0) ← X2Π (ʋ ″ = 0) at 309.240 nm. The measuring results are 1.86× 10− 15 cm2 and 1719 K. The key issues of this experiment are manifested in the following several aspects. (i) The spatial overlap of the forward and backward laser beams should be guaranteed. (ii) The output wavelength of the dye laser will drift with the ambient temperature, so the excitation wavelength needs to be calibrated before carrying out the experiments. (iii) An accurate determination of the effective peak absorption cross section should be performed before calculating the OH absolute concentration. (iv) Temperature is also required to be determined if one expects an OH absolute concentration in the ground state. Our experimental results suggest that the OH radicals exhibit a uniform distribution in the reaction zone and the OH average number density appears to be a constant, if the burner is operated under the conditions of the fuel-lean (Φ = 0.8, 0.9) and the stoichiometric combustion (Φ = 1.0). However, when the flame burns under the fuel-rich condition (Φ = 1.1, 1.2, 1.3), the OH number densities decrease in the middle region of the flame. Additionally, we also give a detailed analysis of the difference generated by using spatial filtering and frequency filtering methods to smooth the experimental fluorescence ratio. The evaluation eventually indicates that using FFT (Gaussian low-pass filtering) works best with the advantages of reserving the OH concentration gradient and removing most of the high frequency noise. Finally, comparing our experimental results with the results from other studies, the result in this paper shows good agreement with the result obtained by CRDS.
Acknowledgment
The author would like to thank Prof. Yu Xin, Dr. Peng Jiang-Bo, et al. for providing many valuable insights and extensive help.
FredetteC F2009Quantitative Hydroxyl (OH) Concentration Calibration by Use of a Flat Flame BurnerThermocouple and Planar Laser Induced Fluorescence (PLIF) System (MS Dissertation)BostonNortheastern University[Cited within:1]
BattlesB E1994Quantitative Fluorescence Measurements of Nitric Oxide and the Hydroxyl Radical in High Pressure Methane FlamesPh. D. Dissertation StanfordStanford University[Cited within:1]
WangN2009The Research and Application of Quantitative Measuring Concentration of OH by PLIF TechniqueMS Dissertation) (ChangshaNational University of Defense Technology(in Chinese)[Cited within:1]
30
LuqueJ and CrosleyD R1999LIFBASE: Database and Spectral Simulation Program (Version 2. 1) SRI International ReportMP-99-009[Cited within:1]
31
ZhangY L2014Study on the CH4/O2/N2 Flame Temperature and OH Radical Concentration by Ultra-Violet Absorption SpectroscopyMS DissertationHarbinHarbin Institute of Technologyin Chinese[Cited within:2]
WangW B2009Investigation on Resonant Degenerate Four Wave Mixing Technique and its Application in Gas-Media SpectroscopyPh. D. DissertationHarbinHarbin Institute of Technology(in Chinese)[Cited within:1]
... [1] Measurement of the OH concentration has a great significance for further understanding the chemical reaction mechanism and kinetic model validation ...
1
1997
0.0
0.0
... In recent years, a large number of experimental studies and theoretical analyses[2#cod#x2013 ...
1
1997
0.0
0.0
1
2000
0.0
0.0
1
2005
0.0
0.0
... [5] reported that the spatial resolution of OH concentration between two points in the turbulent non-premixed flame was about 250#cod#x00A0 ...
1
2009
0.0
0.0
1
2009
0.0
0.0
1
2011
0.0
0.0
1
2012
0.0
0.0
1
1995
0.0
0.0
1
1998
0.0
0.0
1
2000
0.0
0.0
1
2000
0.0
0.0
1
2002
0.0
0.0
1
1999
0.0
0.0
1
2000
0.0
0.0
1
1994
0.0
0.0
... According to the calculation performed by Battles,[17] the OH concentration at 2#cod#x00A0 ...
1
1995
0.0
0.0
... Oh[18] in 1995 estimated an OH line-center absorption cross section (T #cod#x003D ...
2
1999
0.0
0.0
... [19] It is worth noting that Mercier et al ...
... [19] in 1999 investigated the OH concentration using an identical flame (CH4/air premixed) with an equivalence ratio of 1 ...
1
2003
0.0
0.0
1
1999
0.0
0.0
... 21] have been made to accurately determine the OH concentration in a flame by using a variety of laser diagnostic techniques such as coherent anti-Stokes Raman scattering (CARS), degenerate four-wave mixing (DFWM), laser-induced fluorescence (LIF), cavity ring-down spectroscopy (CRDS), and direct absorption spectroscopy ...
1
2009
0.0
0.0
... (i) CARS and DFWM belong to nonlinear and coherent spectral techniques, despite their high measuring accuracy, and because of their complicated optical arrangements[22] and limitation of only a single point measurement of flame, the spatial resolution is extremely low, so none of them is an ideal OH concentration measurement tool ...
1
2014
0.0
0.0
... LIF diagnostic technique, including planar laser-induced fluorescence (PLIF), laser-induced predissociative fluorescence (LIPF), saturated LIF and short-pulse (ps) LIF, has an excellent sensitivity and a spatial resolution[23] (of the order of #cod#x03BC ...
1
1997
0.0
0.0
... [24] proposed a new method, as a solution, to eliminate the influences on quantitative measurement caused by quenching, temperature, pressure, optical collection system and detecting system ...
1
2006
0.0
0.0
... [25] investigated experimentally a diffusion flame of dimethyl ether (DME) and air in a counter-flow by means of bi-directional laser-induced fluorescence ...
1
2009
0.0
0.0
... [26] for determining the absolute concentration of the iron atoms in laminar premixed propene flame ...
1
1984
0.0
0.0
... [27] and [28] ...
1
1967
0.0
0.0
... [27] and [28] ...
1
2009
0.0
0.0
... Calculation by Wang[29] demonstrated that when the temperature changes in a range of 1500#cod#x2013 ...
1
1999
0.0
0.0
... The simulation performed by LIFBASE software[30] shows that the corresponding wavelength in air is 309 ...
2
2014
0.0
0.0
... Zhang[31] in our research group, measured the temperatures on the flat flame at different heights above the burner by means of ultraviolet absorption spectroscopy ...
... 1017 molecules/cm3 for the OH absolute average concentration is obtained by means of the direct absorption spectroscopy[31] and 1015 molecules/cm3 with the method of CRDS ...
3
2006
0.0
0.0
... [32] The temperatures measured at a height of 2#cod#x00A0 ...
... [32] The specific design parameters and characteristics can be found in Ref ...
... [32] ...
1
2009
0.0
0.0
... [33] The DCM and PM580 concentrations of the oscillator are 1#cod#x00D7 ...
1
1979
0.0
0.0
... , Bechtel and Teets[34] obtained the 100#cod#x00A0 ...
Quantitative measurements of one-dimensional OH absolute concentration profiles in a methane/air flat flame by bi-directional laser-induced fluorescence*
[Yu Xina),b), Yang Zhena),b), Peng Jiang-Boa),b), Zhang Leic), Ma Yu-Feia),b), Yang Chao-Boa),b), Li Xiao-Huia),b), Sun Ruic)]


 , Yang Zhen