†These authors contribute equally to the work.
Corresponding author. E-mail: gzsun@nju.edu.cn
*Project supported by the National Basic Research Program of China (Grant Nos. 2011CB922104 and 2011CBA00200), the National Natural Science Foundation of China (Grant No. 11474154), the Natural Science Foundation of Jiangsu Province, China (Grant No. BK2012013), the Priority Academic Program Development of Jiangsu Higher Education Institutions, China, the Specialized Research Fund for the Doctoral Program of Higher Education of China (Grant No. 20120091110030), and the Dengfeng Project B of Nanjing University, China.
We have realized a frequency-tunable transmon in a three-dimensional cooper cavity using a direct current superconducting quantum interference device. Both the transition frequency of the transmon and the frequency of the dressed cavity can be varied with the applied external flux bias, which are well consistent with the theoretical model. The range of the variable transition frequency is from 5.188 GHz to 7.756 GHz. The energy relaxation time of the transmon is hundreds of nanoseconds.
Superconducting quantum bit (qubit) is a key element in building a quantum computer as it can be conveniently designed and integrated.[1– 3] Among superconducting qubits, three-dimensional transmon (3D transmon) has attracted much attention because of its good stability and long coherence time.[4– 6] There have been many achievements in improving coherence time[5] and entangling qubits[7, 8] in recent years. However, few works about frequency-tunable transmon in 3D cavity have been reported, while frequency-tunable qubits are vital in the coupling between superconducting qubits.
The transmon can be described by the Hamiltonian[4]
 |
where n̂ and 
 |
On the other hand, as we know, the critical current of a direct current superconducting quantum interference device (dc-SQUID), containing two Josephson junctions incorporated into a superconducting loop, can be modulated by external magnetic flux[10] in the case of identical junctions and very low inductance, i.e.,
 |
where I0 is the average critical current of junctions, ϕ a is the applied magnetic flux, and ϕ 0 is the magnetic flux quantum. When we replace a single Josephson junction with a dc-SQUID, we can realize a tunable transmon, in which EJ is determined by the critical current IC of the dc-SQUID and EC is a constant. Thus ω ge of the transmon is modulated by the applied magnetic flux
 |
When the transmon is put in a resonant cavity, the coupled system can be described by the Jaynes– Cummings Hamiltonian[11– 13]
 |
The first term describes the resonant cavity with the resonance frequency ω r. The second term describes the qubit. The third term describes the coherent exchange of energy between the qubit and the resonant cavity at a rate g/2π . Therefore, the resonant cavity acts as an entanglement bus and readout circuit. We can distinguish states of the qubit by measuring transmission characteristics of the cavity.[14]
As shown in Fig. 1, a dc-SQUID is coupled to a bulk oxygen-free high thermal conductivity (OFHC) copper resonant cavity through the dipole antenna. We use an OFHC copper cavity rather than an aluminum cavity in order to get a longer coherence time benefiting from the copper cavity’ s good thermal conductivity.[4] The OFHC copper cavity is also convenient for the applying of flux bias with a superconducting coil outside the cavity.
The cavity is located in the dilution refrigerator under 10 mK with magnetic shielding. The microwave drive is heavily attenuated in the dilution refrigerator. The applied magnetic flux in the dc-SQUID can be adjusted by changing the bias voltage of a waveform generator. Details of the measurement system are shown in Fig. 2.
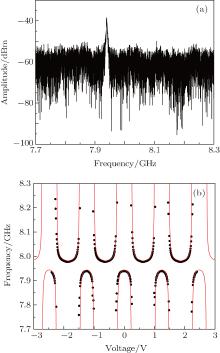
First, we use a vector network analyzer to measure the S21 parameter of the cavity. The bare cavity frequency ω bare is 7.977 GHz at a high input microwave power. When measured by a lower microwave power, the cavity frequency shifts due to the interaction between qubit and cavity. The frequency shift between the bare cavity frequency ω bare and that dressed by qubit ω dressed is determined by[9]
 |
where Δ = ω ge − ω bare, and g is the coupling strength between qubit and cavity. Therefore, the dressed cavity frequency ω dressed is determined by ω ge of the qubit. We measure the S21 curve of the cavity by changing the bias voltage at a low microwave power of − 30 dBm. As shown in Fig. 3(b), the dressed cavity frequency indicated by the black dots changes periodically while the bias voltage varies from − 2.4 V to 2.4 V.
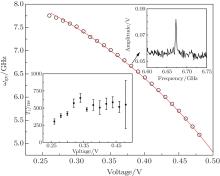
Next, we use the Jaynes– Cummings readout[15] to scan the spectrum of the qubit. Two microwave tones are used to drive the cavity and qubit, respectively. When the cavity is driven at high power, it responds differently to the ground state and the first excited state of the qubit, i.e., the amplitude of S21 at the bare cavity frequency is different. By measuring the amplitude of S21 at the bare cavity frequency with high power, the spectrum of the qubit is easily obtained by changing the frequency of the microwave driving the qubit, ω ge of the qubit at each bias voltage can be extracted from the spectrum as shown in the upper right inset of Fig. 4. As the applied flux bias voltage changes, ω ge changes from 7.756 GHz to 5.188 GHz as shown in Fig. 4. We calculate the coupling strength g to be 165 MHz using the dependance of the dressed cavity frequency on ω ge of the qubit. With the Jaynes– Cummings model and measured parameters, the theoretical ω ge (red lines in Fig. 4) is obtained, which is consistent with the experimental data. The theoretical dressed cavity frequency according to Eq. (6) also agrees well with the experimental result as shown in Fig. 3(b).
We have also measured the relaxation time T1 as a function of bias voltage. To do so, a resonant microwave pulse is applied to the qubit to make the qubit transit from the ground state to the first excited state. After a varied delay time Δ t, the Jaynes– Cummings readout discussed above is to detect the amplitude of the output signal which decays with the delay time Δ t as e− Δ t/T1. By fitting the measured data, the energy relaxation time T1 is obtained. The result is shown in the lower left inset of Fig. 4. Note that the energy relaxation time becomes longer as the bias voltage increases, which is qualitatively consistent with the Purcell effect.
We have realized a frequency-tunable superconducting qubit by using a dc-SQUID as a 3D transmon in a copper cavity. The transition frequency of the transmon can be well controlled with a range of 2.568 GHz through the applied flux bias voltage, which agrees well with the theoretical calculation. These results are helpful to the research of entanglement between qubits. Further investigation is needed on the quantitative dependence of the energy relaxation time on the flux bias.
| 1 |
|
| 2 |
|
| 3 |
|
| 4 |
|
| 5 |
|
| 6 |
|
| 7 |
|
| 8 |
|
| 9 |
|
| 10 |
|
| 11 |
|
| 12 |
|
| 13 |
|
| 14 |
|
| 15 |
|


