Movement of a millimeter-sized oil drop pushed by optical force
[Zhang Li, She Wei-Long† ]
]
]
|
|


†Corresponding author. E-mail: shewl@mail.sysu.edu.cn
*Project supported by the National Natural Science Foundation of China (Grant Nos. 90921009 and 11274401).
We show experimentally that when an unfocused continuous wave (CW) laser beam is obliquely incident onto the surface of a millimeter-sized mineral oil drop on sucrose solution, it will exert a pushing force on the oil drop, making it move forwards along the surface of the sucrose solution. However, after a period of time, the oil drop stops moving. This can be explained as the phenomenon caused by the change of Abraham momentum, the optical gradient force, and friction together.
Since the invention of the optical tweezer by Ashkin et al., [1] using optical forces to manipulate small objects has become popular. Optical forces have been successfully used in many disciplines and applications. The most common example is that in biomedicine people use the gradient force of a tightly focused laser beam to trap beads, virus, bacterium cells, or organelles with sizes ranging from several micrometers to a few hundred nanometers.[2– 4] In addition, dipole force, gradient force, and radiation pressure of the light have been widely utilized to drive the microscale and nanoscale optomechanical devices.[5– 8] Li et al. have demonstrated the photic excitation of the integrated photonic circuit on the chip of scale below the optical wavelength.[9, 10] Also people have made use of optical force to realize oscillation of the microcavity.[11, 12] In atomic physics, optical force was used for optical cooling of various atoms.[13, 14] Moreover, optical manipulation has had a great development in soft materials in recent years, in which photo-induced deformation of cells[15] and optical trapping tiny particles in liquids are the typical applications. Xin et al.[16] and Xu et al.[17] took advantage of the gradient force and the thermal effect of light to assemble micro/nanoscale particles by launching a laser beam into a tapered fiber. Kajorndejnukul et al. used the ‘ negative’ force caused by a light field to pull the small oil droplets on pure water, which prodives a new insight into studying surface effects.[18] However, almost all the lasers currently used for manipulating the particles on liquid surface are tightly or loosely focused. Unlike the previous studies, here we use an unfocused laser beam to manipulate a millimeter-sized oil drop and simulate the experiments. It is found that the Abraham momentum[19] plays its role in interesting experiments.
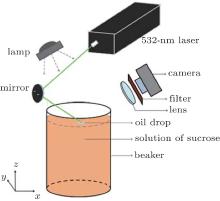
The experiment was performed as follows. Under the room temperature of 21 ° C, a Gaussian laser beam with a wavelength of 532 nm, beam diameter of 1.5 mm, far-field divergence angle of 1 mrad, and power of 1.8 W is reflected by a mirror and then incident onto the surface of the oil drop on the 75% sucrose solution. The sucrose solution is poured into a beaker of 10 cm in depth and 6.5 cm in diameter. The oil drop of 0.015 ml with a base diameter of 8 mm can be regarded as a spherical cap. The incident ray is in the x– z plane and has an incident angle of 60° with respect to the z axis. The distance between the laser exit and the oil drop is about 19 cm so that the beam can be regarded as a parallel one. In order to avoid the influence of reflected light from the beaker, an orange filter is placed between the camera and the lens. In addition, an energy-saved reading lamp is used to make the camera well focused on the liquid surface. The experimental apparatus diagram is shown in Fig. 1.
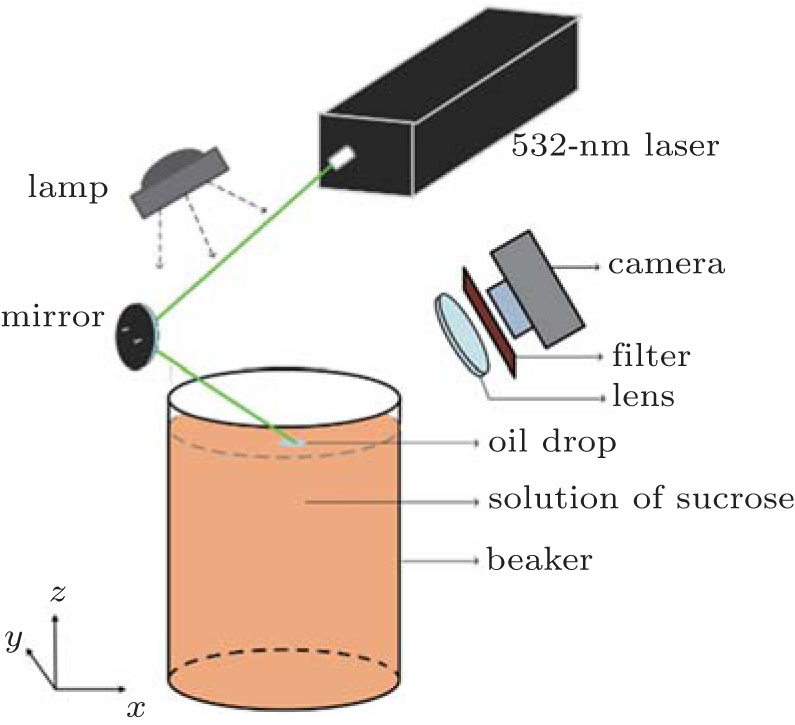 | Fig. 1. Experimental apparatus diagram, where x, y, and z represent the three dimensional (3D) coordinate directions, with the x direction being the direction of the central axis of an oil drop along the liquid surface. |
The density of sucrose solution, 1.333 g/cm3, is larger than the density of mineral oil, 0.76 g/cm3. The two liquids do not dissolve each other, which makes the interface between oil drop and saturated sucrose solution smoother so as to reduce the friction resulting from the deformation of interface and to facilitate the sliding of the oil drop driven by an optical force. Further, the surface of the sucrose solution is stable, so the weak friction between the oil drop and sucrose solution can make the oil drop stay on the surface of the sucrose solution when there is no illumination of light. This is favorable for observing the effect of optical forces. In addition, we measure the surface tension coefficients of mineral oil and sucrose solution with a Krü ss surface tensionmeter. They are 25.053 mN/m and 75.481 mN/m, respectively. We also measure the transmissivity 98% for sucrose solution and the absorption coefficient 6.029 × 10− 3/cm for oil at 532 nm with a Lambda 900 Spectrophotometer. The evaporation temperature of the mineral oil is measured by GC-MS, which is ≥ 200 ° C. The refractive indices of the sucrose solution and oil, also measured with a WAY-2S digital Abbe Refractometer, are 1.4430 and 1.4555 at 21 ° C respectively, which are so close that the interface reflection and the momentum exchange are greatly reduced when light travels through the oil solution interface.
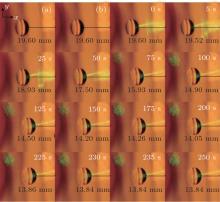
At first, we make the incident point located on the front side of the top of the oil drop. Then we record the movement of the oil drop by the camera set at movie mode with a rate of 15 frames/s. The whole recording time is 280 s, in which the illumination time is 250 s. The experimental result is shown in Fig. 2.
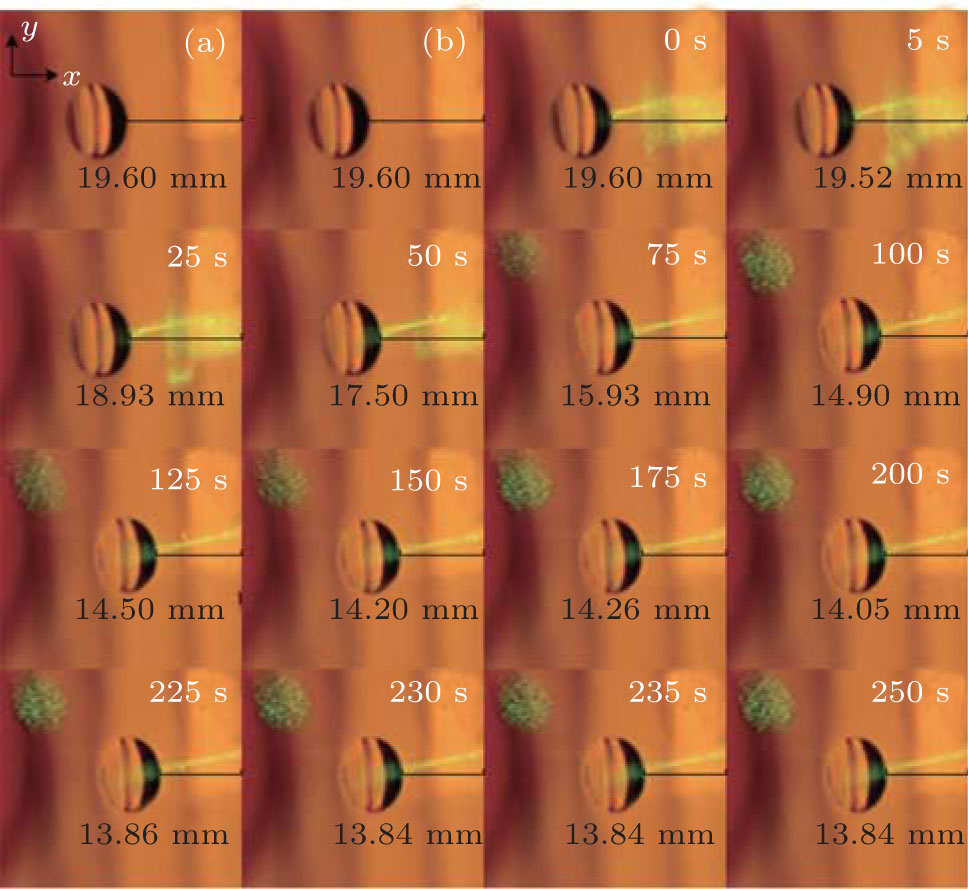 | Fig. 2. Experimental result. Here panels (a) and (b) show the frames without illumination, which are the first frame and the frame is about to turn on the light respectively, and their time interval is 30 s. The others show the frames with illumination. The white numbers indicate the illumination time in sec, where 0 s refers to the moment of beginning to turn on the laser beam. The black line and numbers denote the distance from the front edge of the oil drop to the right edge of the frame. The dark part in the front face of the oil drop is the shadow of the dark area of the energy-saved reading lamp. |
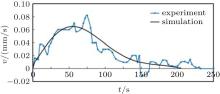
All the frames are intercepted at the same position of the same record. We find that the oil drop almost keeps its position from the first frame of panel (a) to the frame at 0 s. That means that the oil drop almost stays on the surface of the sucrose solution when there is no irradiation. However, after being irradiated by the laser, the oil drop begins to move forwards along the x axis. That is to say, the oil drop is pushed by the laser beam. We calculate the velocity v along the x axis at different illumination moments by the Eulerian method. Figure 3 shows the v– t curve.
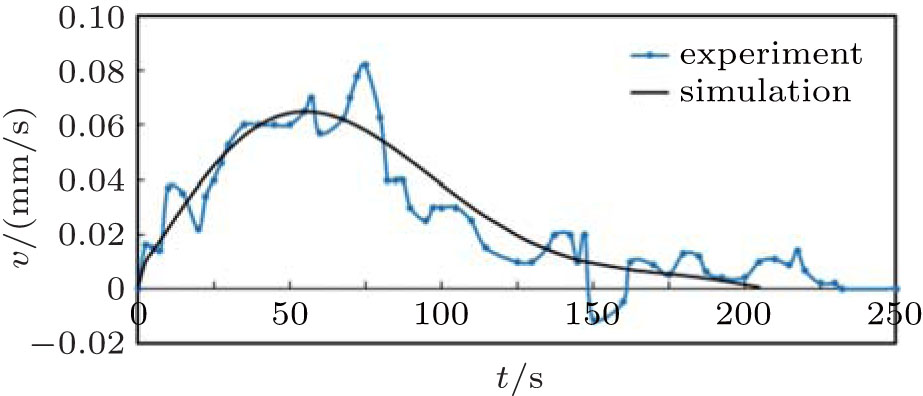 | Fig. 3. Experimental and simulation velocity of oil drop along the x axis versus illumination time. |
The experimental data demonstrates that in general the velocity of the drop along the x axis increases with time t increasing from 0 s to 75 s, then decreases and finally comes to zero at t = 230 s. The velocity of the oil drop is almost positive, which means that the oil drop nearly moves forward along the x axis until it stops. We can obtain that the moving distance of the oil drop is 5.76 mm from Fig. 2, which means that the incident point can change from one side of the spherical cap-top to the other side since the radius of the oil drop is 4 mm. The undulations in the experiments may be because the incident light is not just in the x– z plane, so the oil drop may be subjected to a small component force along the y axis.
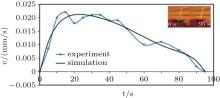
Unlike the above case, for the second experiment, we let the incident point be at the top of the oil drop at the beginning. Figure 4 shows the v– t curve, where v is the velocity along the x axis at different moments of illumination.
 | Fig. 4. Experimental and simulation velocity of the oil drop along the x axis versus the illumination time. The inset shows the raw frame of t = 0 s and the frame of t = 95 s (the moment when the oil drop stops moving). The green arrow in the inset indicates the incident beam. |
We see that the oil drop is also pushed to move along the x axis under illumination. The velocity of the oil drop also first increases and then decreases to zero. By comparison with the results of the first experiment, here the velocity of the oil drop along the x axis reaches its maximum value (0.023 mm/s) at t = 15 s, and becomes zero at t = 92.5 s. The oil drop travels only 1.46 mm and it moves slower than in the first experiment.
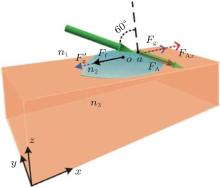
For the above experimental results, we try to give an explanation with a force diagram, shown in Fig. 5.
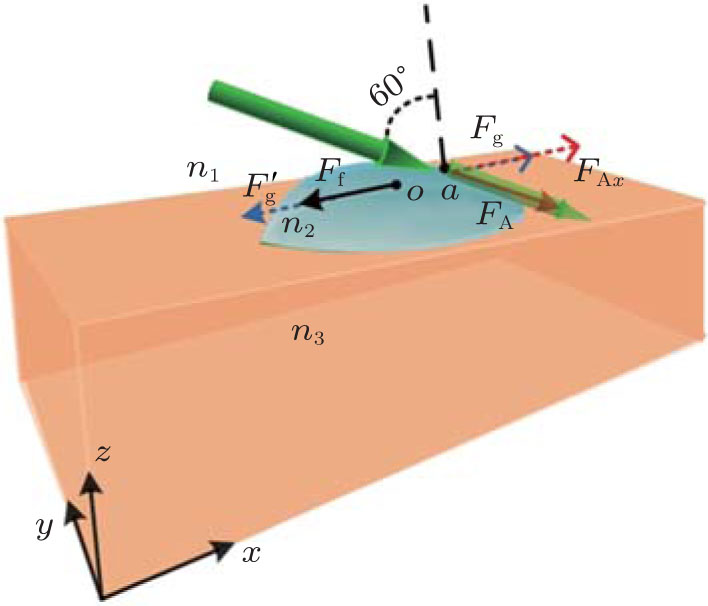 | Fig. 5. Schematic diagram of the force analysis. The lower transparent body denotes the amplified oil drop. The cylinders with an arrow represent the incident and transmitted rays. n1, n2, and n3 signify the refractive indices of the air, oil, and sucrose solutions respectively. The dot of a is the incident point of the first experiment. The O point is the spherical cap-top (the incident point of the second experiment). |
According to Abraham theory, [19] when the laser beam from air with refractive index n1 is incident onto the oil drop with refractive index n2, there is a force on the oil drop along the propagation direction of the laser beam due to the change of light momentum as n1 < n2. There is another force against the propagation direction due to the momentum change at the interface of oil– sucrose solution as n2 < n3. However, n2 is so close to n3 that the latter one can be neglected. Of course, the force caused by absorption of oil also works along the propagation direction of the laser beam. In addition, when an incident laser beam with wavelength λ is incident onto the oil drop, where λ is smaller than the radius of the oil drop, the spherical oil– air interface acts as a convex lens to focus transmitted light. Thus the gradient force along the propagation direction of the laser beam will be generated. However, using the parameters of volume and diameter for the oil drop mentioned above, we obtain that the radius of curvature of the spherical interface is 13.626 mm and the focal length is 42.829 mm. According to the ABCD law of a Gaussian beam, we calculate that the focused beam has a width of 0.52987 mm at the focus, and is very close to the incident beam (0.53 mm). The focusing effect is so weak that we can neglect the gradient force along the propagation direction of the laser beam. Also, when the laser is incident onto the oil drop, it produces a lateral optical gradient force (LOGF) on the drop, which is perpendicular to the propagation direction of light. Moreover, when the oil drop is moving, there is also a force of friction along the oil– solution interface (see Fig. 5).[20]

where f is the friction coefficient depending on both the liquid (sucrose solution) and oil drop. This force depends on the velocity of the movement. So Ff changes continually as the velocity of the oil drop changes with the illumination moment (see Figs. 3 and 5).
According to Abraham momentum[19] and Fresnel’ s formula, [21]FA in Fig. 5, caused by the change of light momentum, will decrease because of transmission and specular reflection at the oil surface when light enters into the surface of the oil drop. In the tangential direction of the oil surface the change of light momentum is E/c(1 − 1/n2)(1 − r2)sin α , where E, n, α , and r are the energy of light incident onto the surface, the refractive index of oil film, the incident angle, and the amplitude reflectivity of light, respectively; and r = tan(α − α ′ )/tan(α + α ′ ) for H-polarization or r = sin(α ′ − α )/sin(α ′ + α ) for E-polarization, where α ′ = sin− 1(sin α /n). The momentum change of light will lead to a tangential pushing force FAx (see Fig. 5)
where P is the incident power of light. For an incident angle of α = 60° , the H-polarization component of incident power is 61.5%, and the tangential pushing force is 1.62 × 10− 9N.
For the force caused by absorption, according to the oil drop parameters of volume, diameter, and the absorption coefficient at 532 nm, with the formula F = P/c[1 – exp(− 0.006029L)], where L is the maximum height of the spherical crown and is estimated to be 0.06 cm, F can be estimated to be about 2.17 × 10− 12 N. This is far less than the force caused by the momentum change so that it can be neglected.
For the LOGF, it always points to a high intensity area. So the LOGF is positive when the incident point is on the front side of the O point (the point a in Fig. 5) at the beginning and it has a component along the x axis, shown as Fg in Fig. 5. With the movement of the oil drop, Fg becomes smaller. As long as the incident point is behind O point, the LOGF becomes negative and it has a negative component along the x axis, shown as 


where ε = ε 0ε r is the dielectric constant of mineral oil; χ is the polarizability of mineral oil and it has the value χ = ε r − 1 = 1.1, in which ε r = 2.1; P is the polarization; E is the electric field intensity. We know that in the oil drop there is a relation between E and I:

and

where I(r) is the transmitted intensity; T is intensity transmissivity, with T = 4n2/(1 + n2)2; μ = μ 0μ r is the magnetic permeability of the oil, with μ r ≈ 1; P and w are the power and radius of the beam, respectively. Using Eqs. (3), (4), and (5), we have

Then the LOGF along the x axis which exerts on the whole oil drop can be calculated as

Clearly, the LOGF depends on the position of the incident point. When the incident point is at the edge of the oil drop, the LOGF has a maximum value.
Therefore, in the first experiment when the incident point is on the front side of the top of the oil drop, the resultant force along the x axis can be expressed as Fx = FAx + Fg + Ff. With the drop moving, Fg decreases and Ff increases gradually (0 s– 75 s in Fig. 3), so Fx decreases. Once the resultant force vanishes, the velocity along the x axis reaches a maximum value (at 75 s in Fig. 3). Afterwards, the resultant force becomes negative and the friction Ff begins to decrease. As long as the incident point is behind the O point, the Fg changes into 

In the second experiment, as the incident point is located on the top of the oil drop at the beginning, the LOGF is zero and the resultant force is F = FAx + Ff. So the oil drop moves slower than in the first experiment. With the drop moving, the incident point is behind the top O point and the drop is subjected to the LOGF 

For these experiments, we also carry out the simulations based on Eqs. (1)– (7) and F = ma = FAx + Fg + Ff with the same parameters described above. The black lines in Figs. 3 and 4 show the simulation results. The tendencies of experimental data are almost consistent with the simulations, except that in Fig. 3 the simulation velocity comes to zero at t = 210 s and the experimental one becomes zero at t = 230 s. This may be due to the fact that we assumed that the oil drop did not deform and only traveled along the x axis under illumination. In the simulations, we find the friction coefficient to be 5.0 × 10− 6 N· s/m.
In this paper, we show experimentally that when an unfocused CW light beam of 1.8 W is incident, at an incident angle 60° , onto the surface of a mineral oil drop of 8 mm in diameter on the sucrose solution, it will exert a pushing force on the oil drop, making it move forwards along the surface of the sucrose solution, which cannot be explained by Minkowski momentum evidently. The experiments would provide some new applications of optical force in soft materials.
| 1 |
|
| 2 |
|
| 3 |
|
| 4 |
|
| 5 |
|
| 6 |
|
| 7 |
|
| 8 |
|
| 9 |
|
| 10 |
|
| 11 |
|
| 12 |
|
| 13 |
|
| 14 |
|
| 15 |
|
| 16 |
|
| 17 |
|
| 18 |
|
| 19 |
|
| 20 |
|
| 21 |
|
| 22 |
|