|
|
|
Evidence for bosonic mode coupling in electron dynamics of LiFeAs superconductor |
| Cong Li(李聪)1,2, Guangyang Dai(代光阳)1,2, Yongqing Cai(蔡永青)1,2, Yang Wang(王阳)1,2, Xiancheng Wang(望贤成)1,2, Qiang Gao(高强)1,2, Guodong Liu(刘国东)1, Yuan Huang(黄元)1, Qingyan Wang(王庆艳)1, Fengfeng Zhang(张丰丰)3, Shenjin Zhang(张申金)3, Feng Yang(杨峰)3, Zhimin Wang(王志敏)3, Qinjun Peng(彭钦军)3, Zuyan Xu(许祖彦)3, Changqing Jin(靳常青)1,2,4, Lin Zhao(赵林)1,†, and X J Zhou(周兴江)1,2,4,5,‡ |
1 Beijing National Laboratory for Condensed Matter Physics, Institute of Physics, Chinese Academy of Sciences, Beijing 100190, China
2 University of Chinese Academy of Sciences, Beijing 100049, China
3 Technical Institute of Physics and Chemistry, Chinese Academy of Sciences, Beijing 100190, China
4 Songshan Lake Materials Laboratory, Dongguan 523808, China
5 Beijing Academy of Quantum Information Sciences, Beijing 100193, China |
|
|
|
|
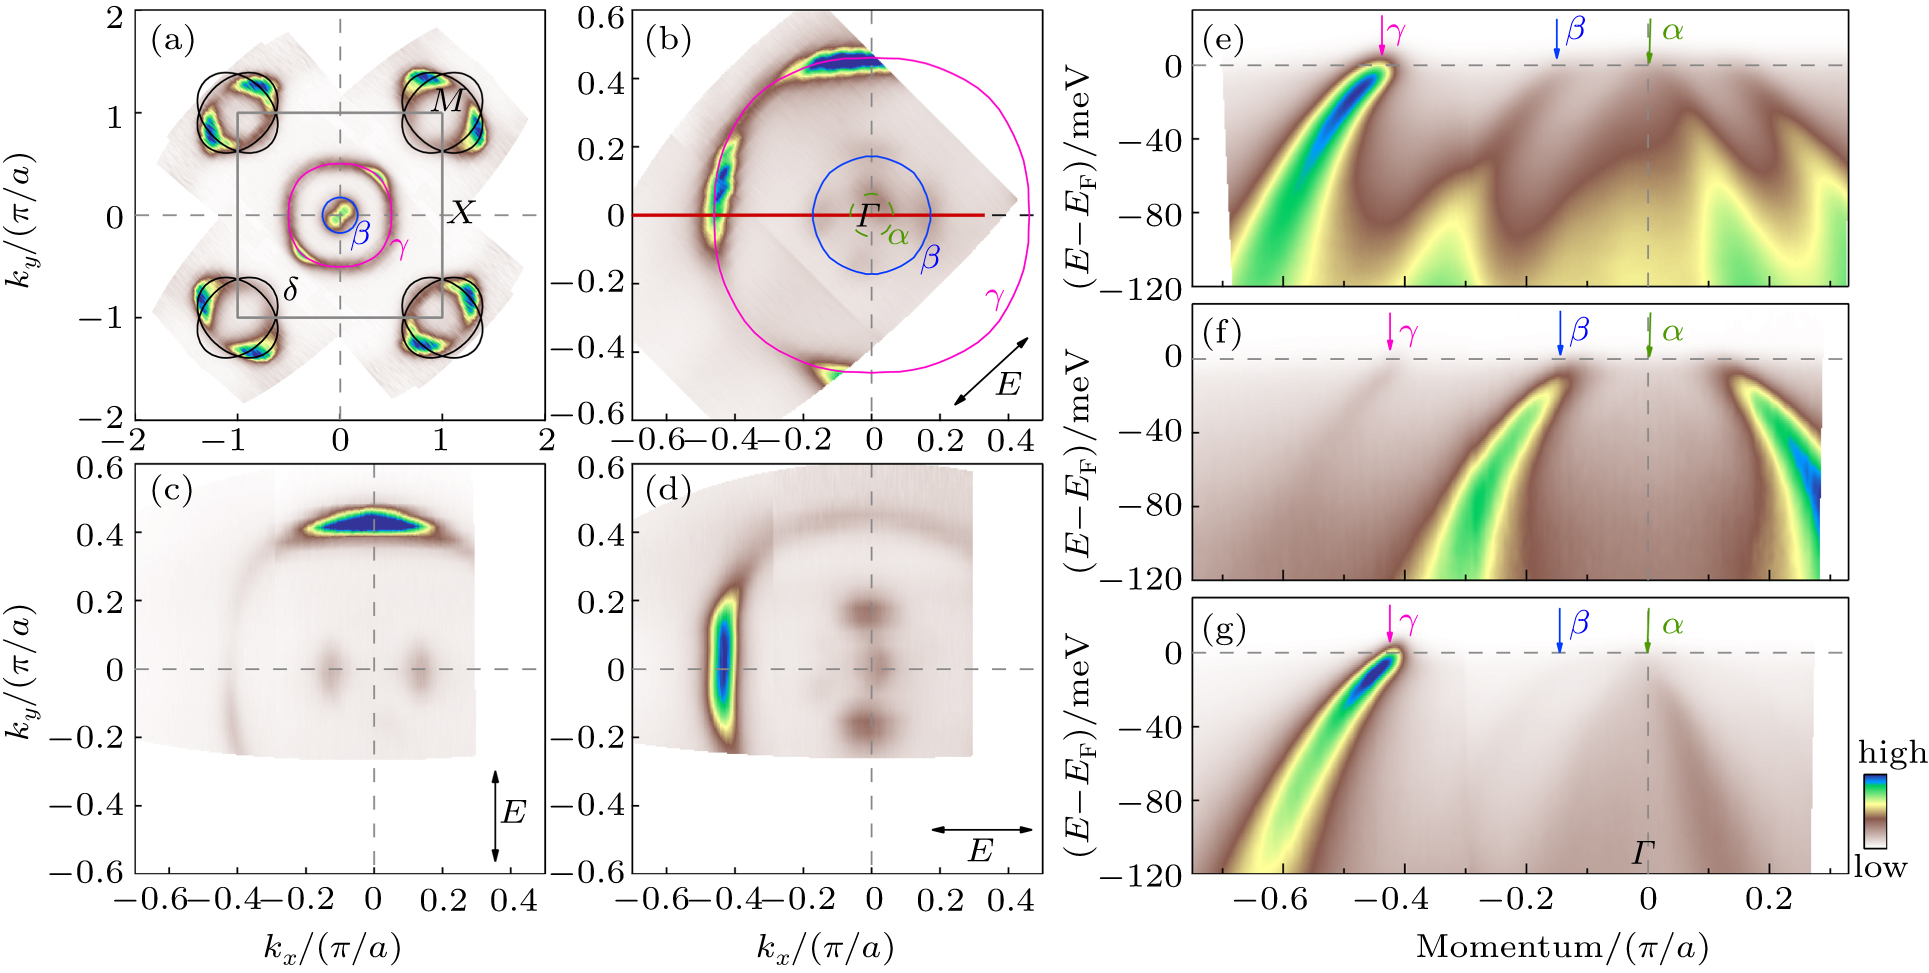
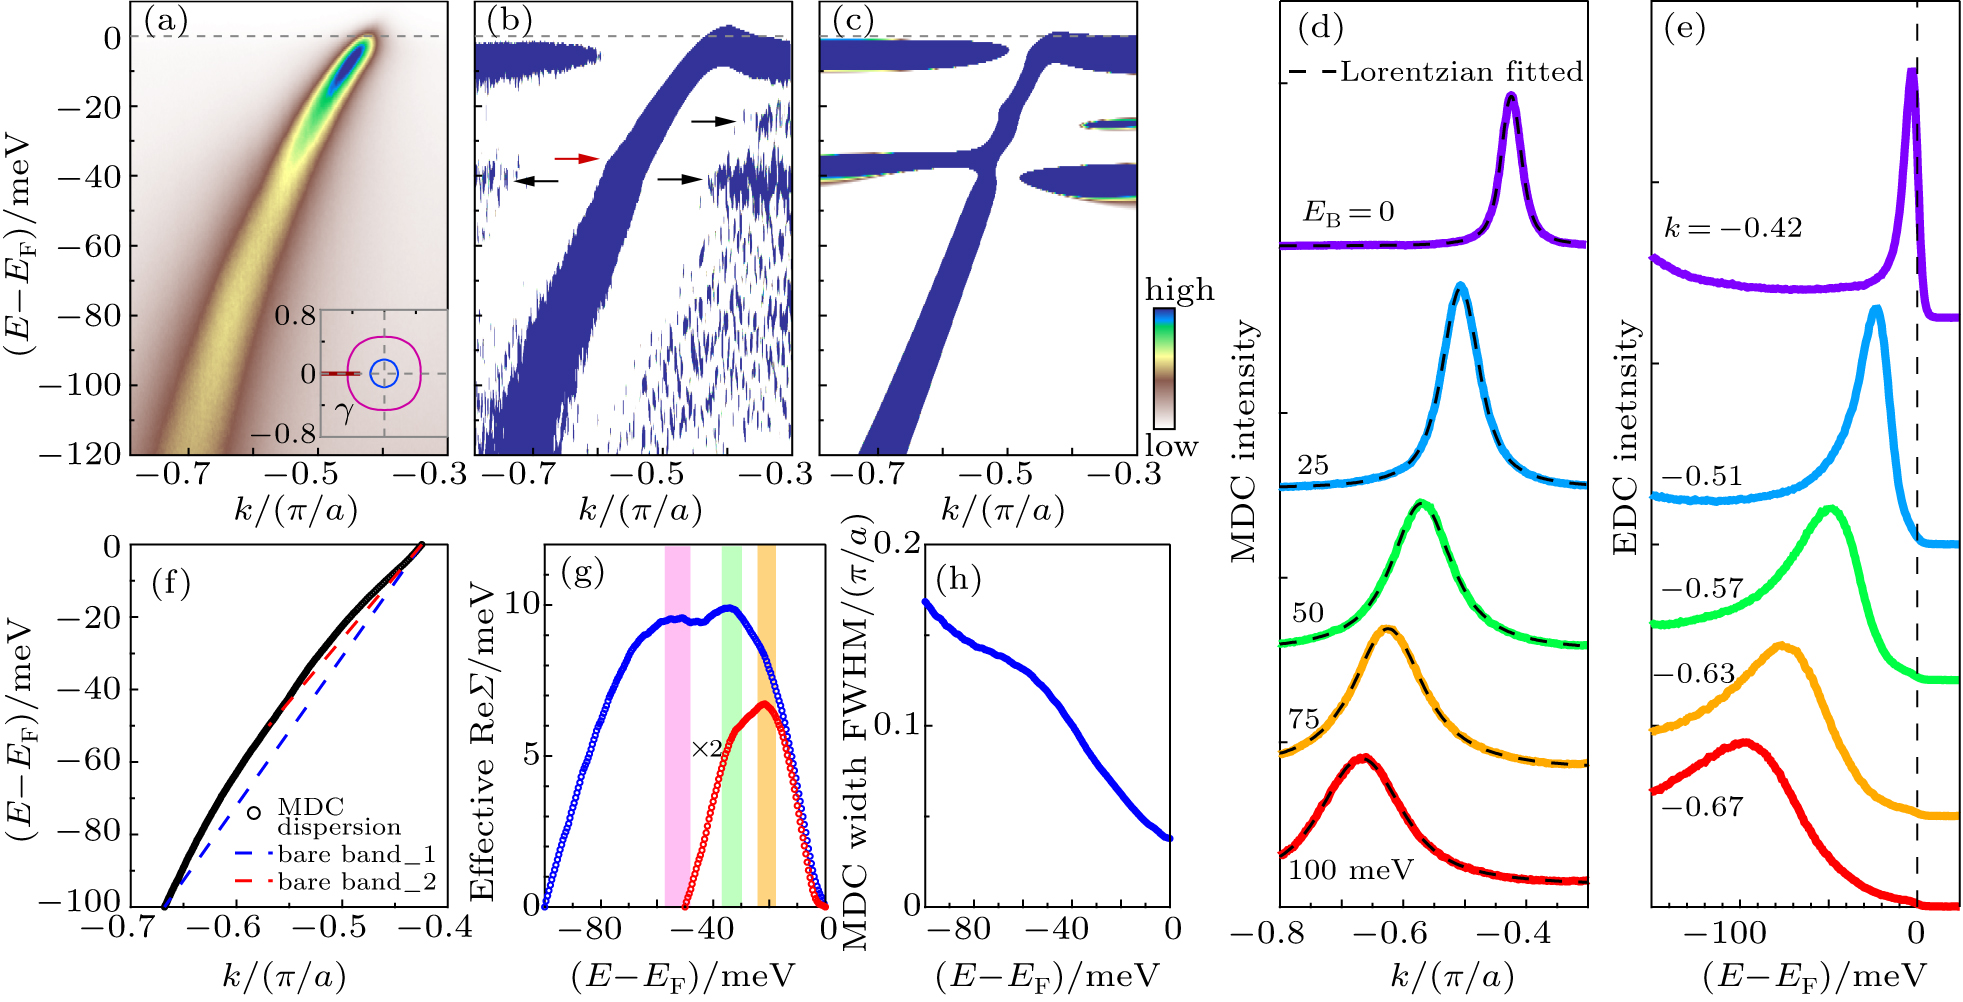
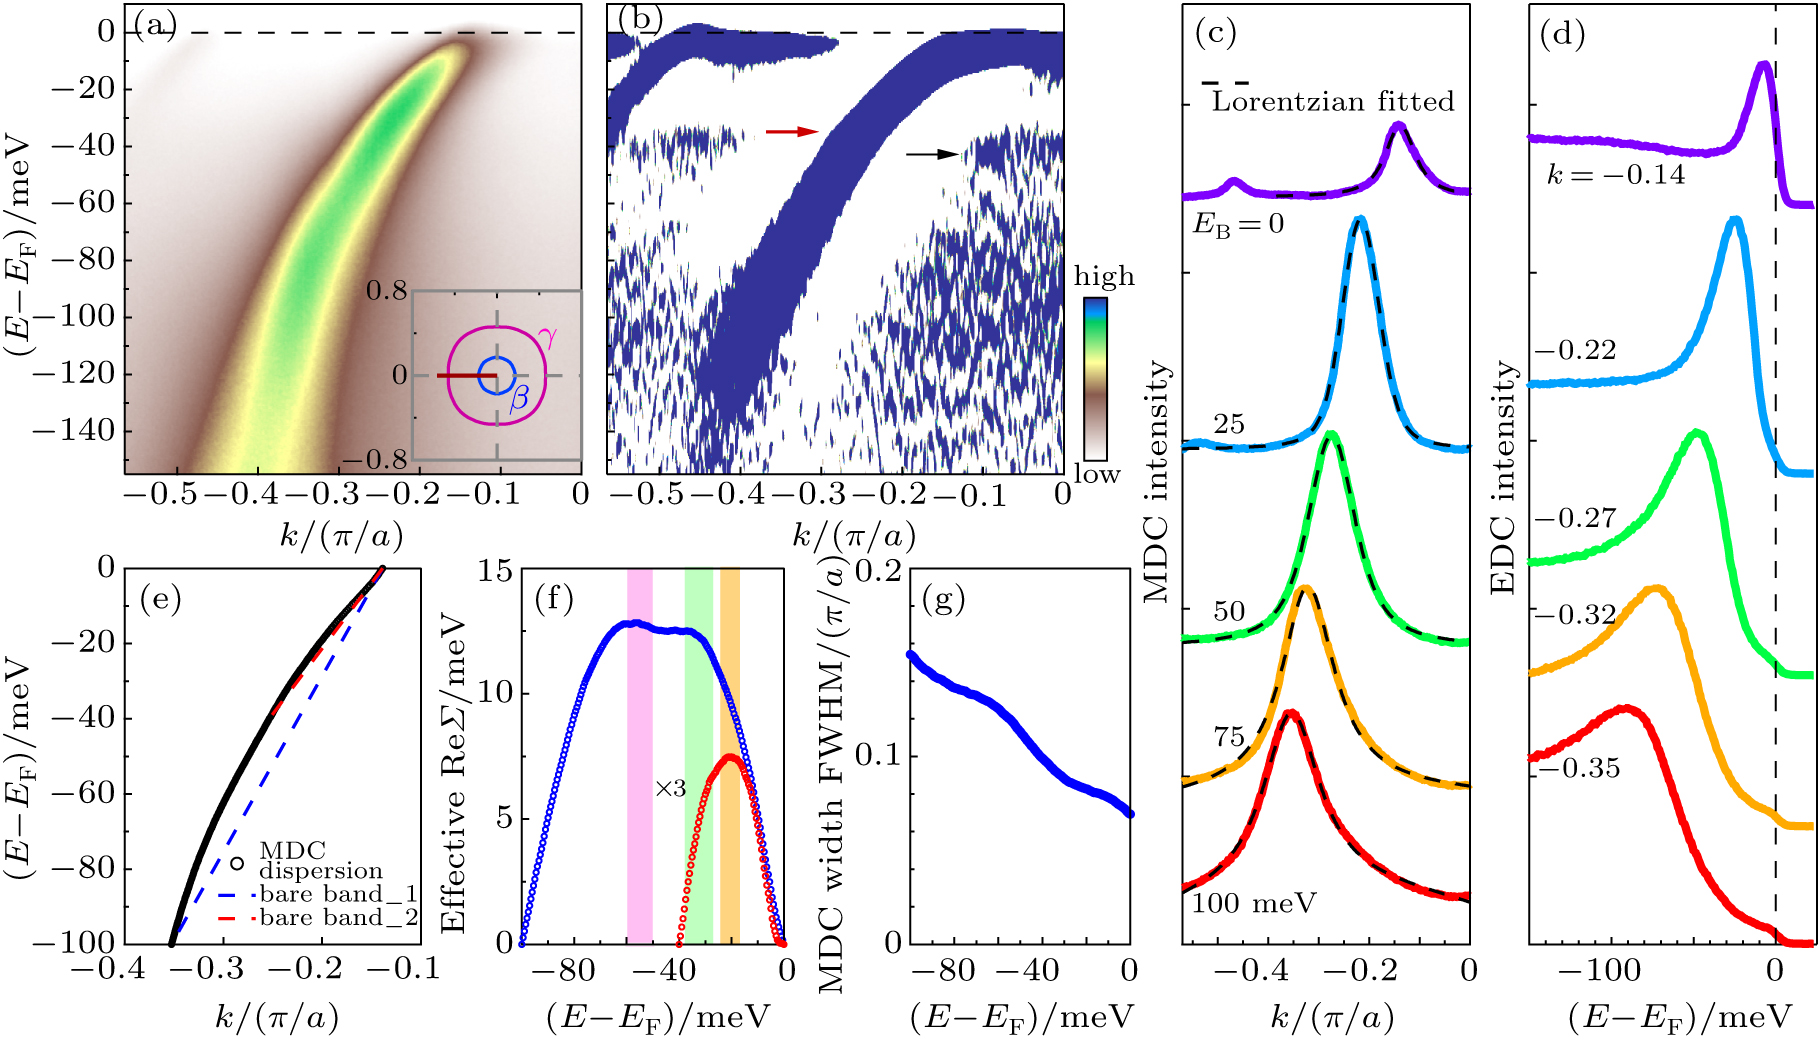
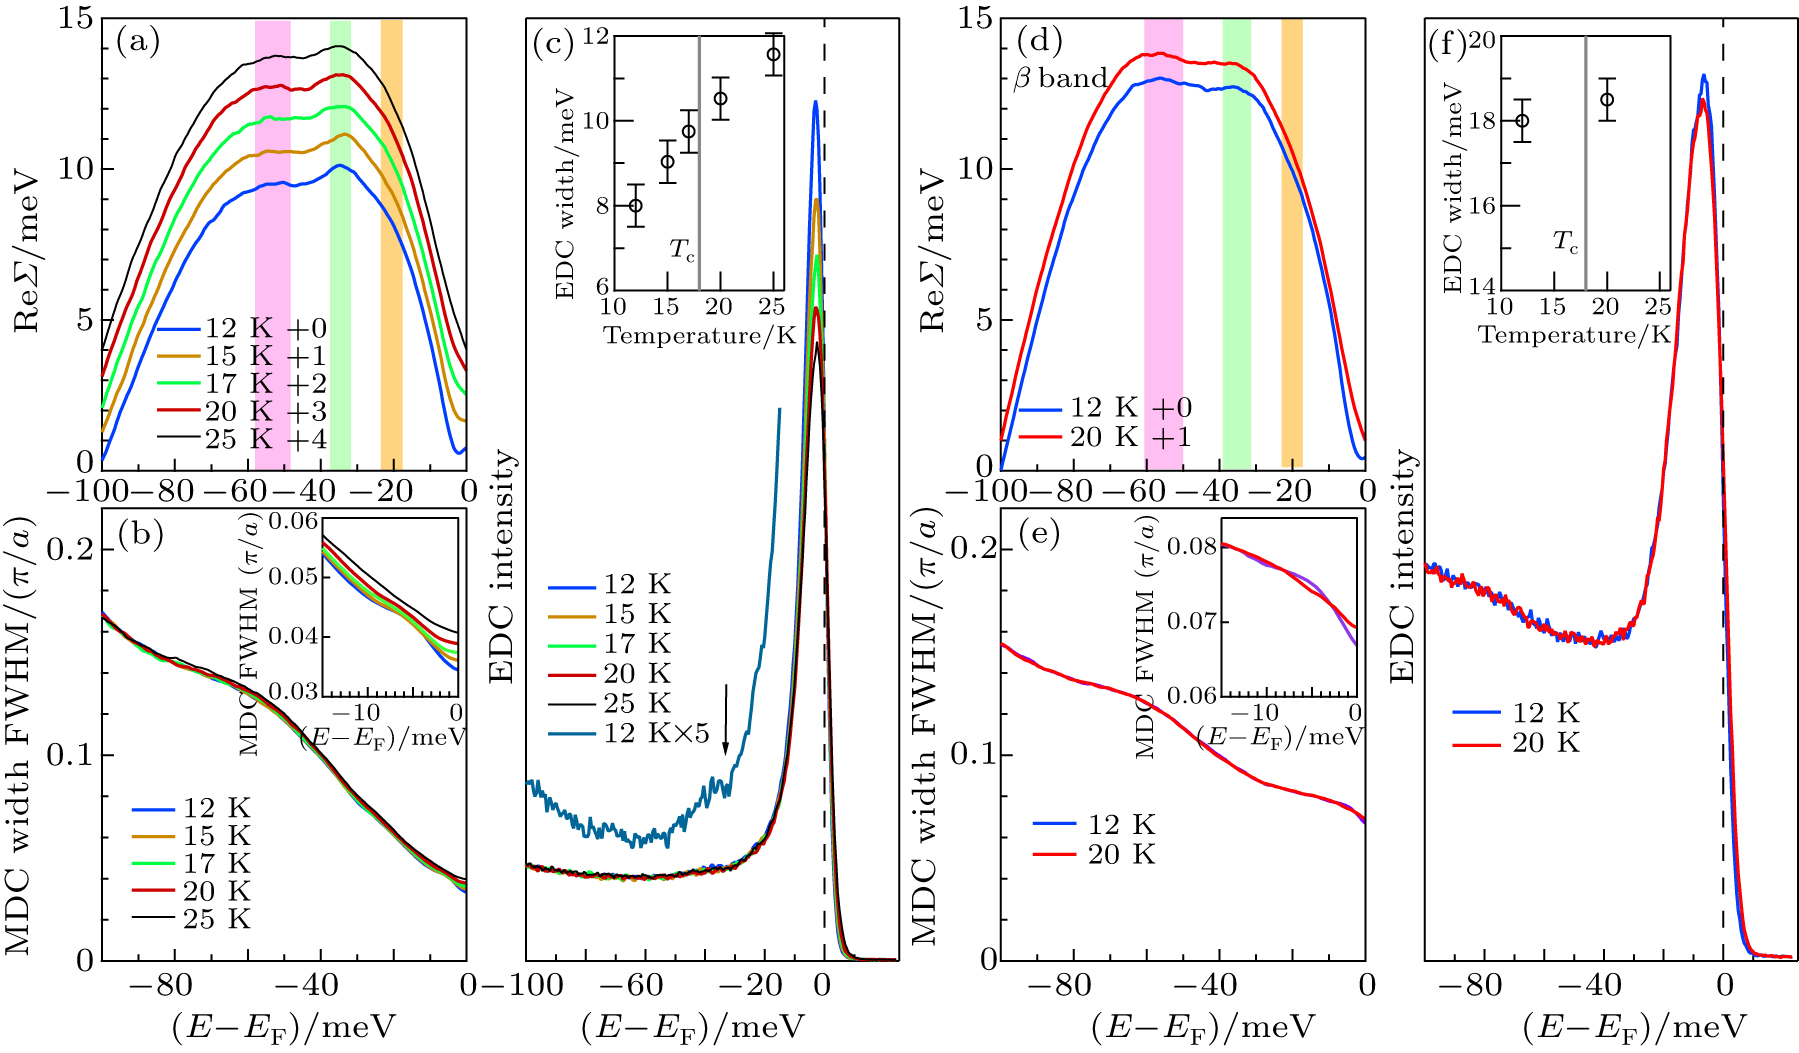
Abstract Super-high resolution laser-based angle-resolved photoemission measurements are carried out on LiFeAs superconductor to investigate its electron dynamics. Three energy scales at ∼ 20 meV, ∼ 34 meV, and ∼ 55 meV are revealed for the first time in the electron self-energy both in the superconducting state and normal state. The ∼ 20 meV and ∼ 34 meV scales can be attributed to the coupling of electrons with sharp bosonic modes which are most likely phonons. These observations provide definitive evidence on the existence of mode coupling in iron-based superconductors.
|
Received: 14 August 2020
Revised: 14 August 2020
Accepted manuscript online: 25 August 2020
|
|
PACS:
|
74.25.Jb
|
(Electronic structure (photoemission, etc.))
|
| |
63.20.kd
|
(Phonon-electron interactions)
|
| |
74.25.Kc
|
(Phonons)
|
|
|
Corresponding Authors:
†Corresponding author. E-mail: lzhao@iphy.ac.cn ‡Corresponding author. E-mail: XJZhou@iphy.ac.cn
|
| About author: †Corresponding author. E-mail: lzhao@iphy.ac.cn ‡Corresponding author. E-mail: XJZhou@iphy.ac.cn * Project supported by the National Key Research and Development Program of China (Grant Nos. 2016YFA0300300, 2016YFA0300600, 2017YFA0302900,2018YFA0704200, 2018YFA0305600, and 2019YFA0308000), the National Natural Science Foundation of China (Grant Nos. 11888101, 11922414, and 11874405), the Strategic Priority Research Program (B) of the Chinese Academy of Sciences (Grant Nos. XDB25000000 and XDB33010300), the Youth Innovation Promotion Association of the Chinese Academy of Sciences (Grant No. 2017013), and the Research Program of Beijing Academy of Quantum Information Sciences (Grant No. Y18G06). |
Cite this article:
Cong Li(李聪), Guangyang Dai(代光阳), Yongqing Cai(蔡永青), Yang Wang(王阳), Xiancheng Wang(望贤成), Qiang Gao(高强), Guodong Liu(刘国东), Yuan Huang(黄元), Qingyan Wang(王庆艳), Fengfeng Zhang(张丰丰), Shenjin Zhang(张申金), Feng Yang(杨峰), Zhimin Wang(王志敏), Qinjun Peng(彭钦军), Zuyan Xu(许祖彦), Changqing Jin(靳常青), Lin Zhao(赵林)†, and X J Zhou(周兴江)‡ Evidence for bosonic mode coupling in electron dynamics of LiFeAs superconductor 2020 Chin. Phys. B 29 107402
|
| [1] |
|
| [2] |
|
| [3] |
|
| [4] |
Zhou X J et al. 2007 Handbook of high-temperature superconductivity: Theory and experiment Schrieffer J R Berlin Springer
|
| [5] |
|
| [6] |
|
| [7] |
|
| [8] |
|
| [9] |
Lanzara A, Bogdanov P V, Zhou X J et al. 2001 Nature 412 510 DOI: 10.1038/35087518 |
| [10] |
|
| [11] |
|
| [12] |
|
| [13] |
|
| [14] |
|
| [15] |
|
| [16] |
|
| [17] |
|
| [18] |
|
| [19] |
|
| [20] |
|
| [21] |
|
| [22] |
|
| [23] |
|
| [24] |
|
| [25] |
|
| [26] |
|
| [27] |
|
| [28] |
|
| [29] |
|
| [30] |
|
| [31] |
|
| [32] |
|
| [33] |
|
| [34] |
|
| [35] |
|
| [36] |
|
| [37] |
|
| [38] |
|
| [39] |
|
| [40] |
|
| [41] |
|
| [42] |
|
| [43] |
|
| [44] |
|
| [45] |
|
| [46] |
|
| [47] |
|
| [48] |
|
| No Suggested Reading articles found! |
|
|
Viewed |
|
|
|
Full text
|
|
|
|
|
Abstract
|
|
|
|
|
Cited |
|
|
|
|
Altmetric
|
|
blogs
Facebook pages
Wikipedia page
Google+ users
|
Online attention
Altmetric calculates a score based on the online attention an article receives. Each coloured thread in the circle represents a different type of online attention. The number in the centre is the Altmetric score. Social media and mainstream news media are the main sources that calculate the score. Reference managers such as Mendeley are also tracked but do not contribute to the score. Older articles often score higher because they have had more time to get noticed. To account for this, Altmetric has included the context data for other articles of a similar age.
View more on Altmetrics
|
|
|